Collingdale, PA (Pennsylvania) Houses and Residents
| Collingdale: | $139,927 |
| Pennsylvania: | $245,500 |
Mean price in 2022:
Detached houses: $210,901
Here: $210,901 State: $317,202 Townhouses or other attached units: $157,217
Here: $157,217 State: $254,369 In 2-unit structures: $140,736
Here: $140,736 State: $249,182
Total population: 8,797 (Urban population: 8,664, Rural population: 0)
Houses: 3,753 (3,406 occupied: 1,965 owner occupied, 1,442 renter occupied)
| % of renters here: | 42% |
| State: | 31% |
Housing density: 4,330 houses/condos per square mile
Median price asked for vacant for-sale houses and condos in 2022: $77,911.
Median contract rent in 2022: $954 (lower quartile is $645, upper quartile is $1,278)
Median rent asked for vacant for-rent units in 2022: $1,132
Median gross rent in Collingdale, PA in 2022: $1,158
Housing units in Collingdale with a mortgage: 1,242 (17 second mortgage, 0 home equity loan, 18 both second mortgage and home equity loan)
Houses without a mortgage: 8
Median household income for houses/condos with a mortgage: $60,478
Median household income for apartments without a mortgage: $57,862
Median monthly housing costs: $1,164
Compare current foreclosures near Collingdale, PA:
| Photo | Address | Area | Beds / Baths | Price | Details |
|---|---|---|---|---|---|

|
#1
Broadway
Westville, NJ 08093
|
1,548 sq. feet
|
1 baths 3 beds |
$259,900
|
show details |

|
#2
Edwards Ave
Barrington, NJ 08007
|
1,112 sq. feet
|
1 baths 3 beds |
$325,500
|
show details |

|
#3
N Forklanding Rd
Maple Shade, NJ 08052
|
1,450 sq. feet
|
1 baths 3 beds |
$259,900
|
show details |

|
#4
N Front St Apt B
Philadelphia, PA 19123
|
2,491 sq. feet
|
2 baths 3 beds |
$659,500
|
show details |

|
#5
N 5th St
Philadelphia, PA 19126
|
1,420 sq. feet
|
2 baths 3 beds |
$313,900
|
show details |

|
#6
N Norman Ave
Penns Grove, NJ 08069
|
882 sq. feet
|
1 baths 2 beds |
$74,900
|
show details |

|
#7
Covered Bridge Rd
Cherry Hill, NJ 08034
|
1,343 sq. feet
|
1 baths 3 beds |
$450,000
|
show details |

|
#8
Browning Rd
Merchantville, NJ 08109
|
2,376 sq. feet
|
3 baths 5 beds |
$489,900
|
show details |

|
#9
Cooper St
Woodbury, NJ 08096
|
936 sq. feet
|
1 baths 3 beds |
$255,000
|
show details |

|
#10
Harvey Ave
Pennsauken, NJ 08110
|
1,555 sq. feet
|
2 baths 4 beds |
$415,000
|
show details |
| Photo | Address | Area | Beds / Baths | Price | Details |
|---|---|---|---|---|---|

|
#11
S 8th St
Philadelphia, PA 19148
|
1,170 sq. feet
|
1 baths 3 beds |
$178,500
|
show details |

|
#12
N 59th St
Philadelphia, PA 19151
|
1,244 sq. feet
|
1 baths 3 beds |
$241,500
|
show details |

|
#13
W Olney Ave
Philadelphia, PA 19120
|
1,782 sq. feet
|
2 baths 4 beds |
$112,500
|
show details |

|
#14
W Oakdale Street
Philadelphia, PA 19132
|
1,152 sq. feet
|
2 baths 3 beds |
$108,900
|
show details |

|
#15
Manchester Rd
Elkins Park, PA 19027
|
3,444 sq. feet
|
2 baths 3 beds |
$559,900
|
show details |

|
#16
N Parkview Dr
Norristown, PA 19403
|
2,602 sq. feet
|
2 baths 4 beds |
$240,000
|
show details |

|
#17
Mockingbird Ln
Swedesboro, NJ 08085
|
2,076 sq. feet
|
2 baths 4 beds |
$429,900
|
show details |

|
#18
Edgewood Ave
Audubon, NJ 08106
|
1,250 sq. feet
|
1 baths 4 beds |
$375,000
|
show details |

|
#19
Ashbourne Rd
Elkins Park, PA 19027
|
3,104 sq. feet
|
3 baths 6 beds |
$154,500
|
show details |

|
#20
Kershaw St
Philadelphia, PA 19131
|
1,284 sq. feet
|
1 baths 3 beds |
$139,900
|
show details |
| Photo | Address | Area | Beds / Baths | Price | Details |
|---|---|---|---|---|---|

|
#21
Yeadon Ave
Lansdowne, PA 19050
|
1,388 sq. feet
|
1 baths 3 beds |
$273,000
|
show details |

|
#22
Christian St
Philadelphia, PA 19146
|
1,612 sq. feet
|
2 baths 5 beds |
$449,900
|
show details |

|
#23
Jessamine Ave
Oaklyn, NJ 08107
|
864 sq. feet
|
2 baths 5 beds |
$399,900
|
show details |

|
#24
Presidential Blvd Unit 915b
Bala Cynwyd, PA 19004
|
579 sq. feet
|
1 baths 1 beds |
$104,531
|
show details |

|
#25
Valley Dr
West Chester, PA 19382
|
945 sq. feet
|
1 baths 2 beds |
$103,336
|
show details |

|
#26
E Strasburg Rd
West Chester, PA 19380
|
4,204 sq. feet
|
3 baths 3 beds |
$668,955
|
show details |

|
#27
Leonard St
Philadelphia, PA 19149
|
1,024 sq. feet
|
1 baths 3 beds |
$54,557
|
show details |

|
#28
Hamilton St
Swedesboro, NJ 08085
|
- sq. feet
|
1 baths 3 beds |
$260,000
|
show details |

|
#29
Cornelius St
Philadelphia, PA 19138
|
1,166 sq. feet
|
1 baths 3 beds |
$118,648
|
show details |

|
#30
Gulph Rd
Wayne, PA 19087
|
3,262 sq. feet
|
2 baths 4 beds |
$651,481
|
show details |
| Photo | Address | Area | Beds / Baths | Price | Details |
|---|---|---|---|---|---|

|
#31
Pickering St
Philadelphia, PA 19150
|
1,170 sq. feet
|
1 baths 3 beds |
$169,900
|
show details |

|
#32
Larchwood Rd
West Chester, PA 19382
|
2,276 sq. feet
|
2 baths 3 beds |
$3,640
|
show details |

|
#33
L Fleur
Devon, PA 19333
|
1,412 sq. feet
|
1 baths 2 beds |
$50,690
|
show details |

|
#34
Shady Brook Ln
Malvern, PA 19355
|
3,974 sq. feet
|
3 baths 4 beds |
$185,445
|
show details |

|
#35
Coventry Ln
West Chester, PA 19382
|
1,580 sq. feet
|
2 baths 3 beds |
$205,686
|
show details |

|
#36
W Oakdale St
Philadelphia, PA 19132
|
1,134 sq. feet
|
1 baths 3 beds |
$1,322,645
|
show details |

|
#37
Reedland St
Philadelphia, PA 19142
|
1,118 sq. feet
|
1 baths 3 beds |
$125,252
|
show details |

|
#38
Dekalb Pike
Norristown, PA 19401
|
2,583 sq. feet
|
2 baths 4 beds |
$255,189
|
show details |

|
#39
Poplar St
Philadelphia, PA 19130
|
1,036 sq. feet
|
1 baths 3 beds |
$145,497
|
show details |

|
#40
44th St
Pennsauken, NJ 08110
|
- sq. feet
|
1 baths 3 beds |
$94,900
|
show details |
| Photo | Address | Area | Beds / Baths | Price | Details |
|---|---|---|---|---|---|

|
#41
S 19th St
Philadelphia, PA 19145
|
1,544 sq. feet
|
1 baths 4 beds |
$75,082
|
show details |

|
#42
New Market Ct
Wayne, PA 19087
|
1,080 sq. feet
|
1 baths 2 beds |
$98,656
|
show details |

|
#43
Hopkinson Ct # 160
Wayne, PA 19087
|
1,656 sq. feet
|
2 baths 2 beds |
$214,896
|
show details |

|
#44
Richmond Rd
Paoli, PA 19301
|
1,215 sq. feet
|
1 baths 2 beds |
$263,438
|
show details |

|
#45
N Newkirk St
Philadelphia, PA 19132
|
960 sq. feet
|
1 baths 3 beds |
$1,128,765
|
show details |

|
#46
N Bambrey St
Philadelphia, PA 19121
|
964 sq. feet
|
1 baths 3 beds |
$107,333
|
show details |

|
#47
E Wishart St
Philadelphia, PA 19134
|
1,064 sq. feet
|
1 baths 3 beds |
$1,290,613
|
show details |

|
#48
67th Ave
Philadelphia, PA 19138
|
1,146 sq. feet
|
1 baths 3 beds |
$8,900
|
show details |

|
#49
Richmond Rd
Paoli, PA 19301
|
1,706 sq. feet
|
2 baths 2 beds |
$179,198
|
show details |

|
Check over 1 million property listings on Foreclosure.com!
|
browse all offers | |||

Latest news about housing in Collingdale, PA collected exclusively by city-data.com from local newspapers, TV, and radio stations

 | Collingdale Concerns? (9 replies) |
| Delaware County by Median Household Income... Interesting (17 replies) |
| The City of Philadelphia vs the suburbs, whats the real deal? (80 replies) |
| Should I move to Philly? (54 replies) |
| Many properties in Havertown.why? (17 replies) |
| Why does Philadelphia have a reputation of being a rude, mean city? (211 replies) |

Median year apartment built: 1952
Household type by relationship:
Households: 8,862- Male householders: 1,102 (446 living alone), Female householders: 2,291 (778 living alone)
811 spouses (808 opposite-sex spouses), 228 unmarried partners, (223 opposite-sex unmarried partners), 3,058 children (2,841 natural, 106 adopted, 109 stepchildren), 388 grandchildren, 192 brothers or sisters, 183 parents, 0 foster children, 289 other relatives, 313 non-relatives
Size of family households: 712 2-persons, 607 3-persons, 242 4-persons, 158 5-persons, 138 6-persons, 82 7-or-more-persons.
Size of nonfamily households: 1,286 1-person, 91 2-persons, 21 4-persons, 28 6-persons.
599 married couples with children.
1,108 single-parent households (39 men, 1,069 women).
85.5% of residents of Collingdale speak English at home.
2.6% of residents speak Spanish at home (30% speak English very well, 10% speak English well, 60% don't speak English at all).
6.4% of residents speak other Indo-European language at home (48% speak English very well, 32% speak English well, 19% speak English not well, 1% don't speak English at all).
2.3% of residents speak Asian or Pacific Island language at home (38% speak English very well, 16% speak English well, 32% speak English not well, 14% don't speak English at all).
1.4% of residents speak other language at home (17% speak English very well, 79% speak English well, 3% speak English not well).
Foreign born population: 1,028 (11.6%)
(52.6% of them are naturalized citizens)
| Here: | 6.4 |
| State: | 6.8 |
| Here: | 5.4 |
| State: | 4.3 |

- Bedrooms in owner-occupied houses and condos in Collingdale, Pennsylvania
- 3no bedroom
- 121 bedroom
- 992 bedrooms
- 1,5453 bedrooms
- 2014 bedrooms
- 1055+ bedrooms

- Bedrooms in renter-occupied apartments in Collingdale, Pennsylvania
- 19no bedroom
- 1551 bedroom
- 4252 bedrooms
- 7693 bedrooms
- 694 bedrooms
- 65+ bedrooms

- Cars and other vehicles available in Collingdale in owner-occupied houses/condos
- 313no vehicle
- 7211 vehicle
- 6142 vehicles
- 2483 vehicles
- 474 vehicles
- 225+ vehicles

- Cars and other vehicles available in Collingdale in renter-occupied apartments
- 399no vehicle
- 7081 vehicle
- 2442 vehicles
- 513 vehicles
- 414 vehicles
- 05+ vehicles

- Rooms in owner-occupied houses in Collingdale, Pennsylvania
- 01 room
- 02 rooms
- 33 rooms
- 554 rooms
- 1475 rooms
- 8646 rooms
- 4077 rooms
- 2148 rooms
- 2769+ rooms

- Rooms in renter-occupied apartments in Collingdale, Pennsylvania
- 191 room
- 172 rooms
- 1043 rooms
- 2704 rooms
- 2225 rooms
- 5366 rooms
- 2057 rooms
- 338 rooms
- 369+ rooms


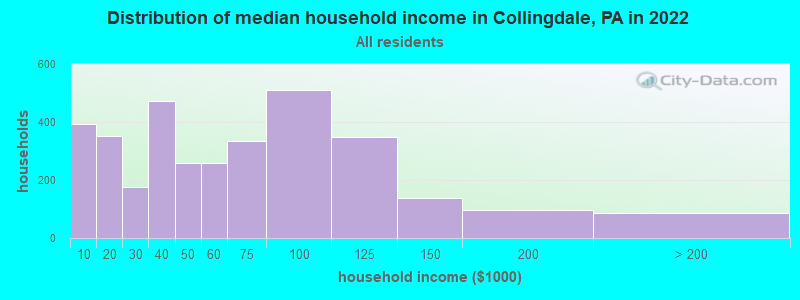
Collingdale, PA household income distribution

- 392Less than $10,000
- 352$10,000 to $19,999
- 177$20,000 to $29,999
- 472$30,000 to $39,999
- 260$40,000 to $49,999
- 259$50,000 to $59,999
- 334$60,000 to $74,999
- 511$75,000 to $99,999
- 349$100,000 to $124,999
- 138$125,000 to $149,999
- 95$150,000 to $199,999
- 87$200,000 or more
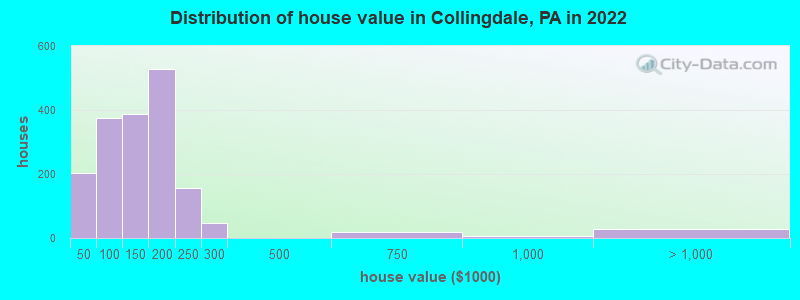
Home value of owner - occupied houses in 2022 in Collingdale, PA
-
- 135Less than $10,000
- 11$10,000 to $14,999
- 33$25,000 to $29,999
- 22$40,000 to $49,999
- 37$50,000 to $59,999
- 36$60,000 to $69,999
- 62$70,000 to $79,999
- 155$80,000 to $89,999
- 61$90,000 to $99,999
- 290$100,000 to $124,999
- 98$125,000 to $149,999
- 235$150,000 to $174,999
- 291$175,000 to $199,999
- 157$200,000 to $249,999
- 46$250,000 to $299,999
- 20$500,000 to $749,999
- 6$750,000 to $999,999
- 28$1,000,000 to $1,499,999
Rent paid by renters in 2022 in Collingdale, PA
-
- 73$100 to $149
- 55$150 to $199
- 37$200 to $249
- 6$250 to $299
- 75$500 to $549
- 18$550 to $599
- 137$600 to $649
- 78$650 to $699
- 20$700 to $749
- 77$750 to $799
- 93$800 to $899
- 199$900 to $999
- 243$1,000 to $1,249
- 266$1,250 to $1,499
- 74$1,500 to $1,999
- 18No cash rent


Percentage of workers working in this county: 59.3%
Number of people working at home: 396 (9.7% of all workers)
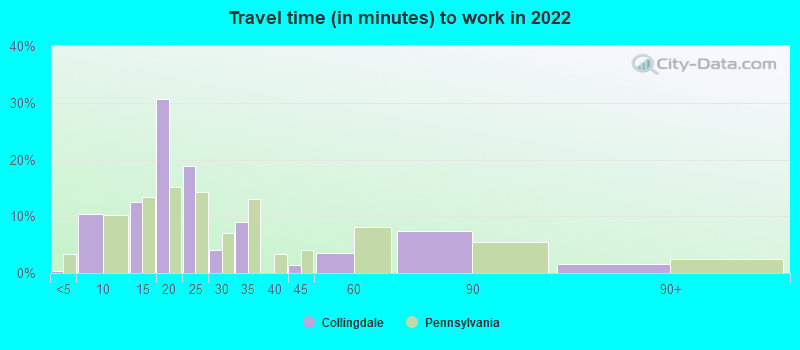
Travel time to work (commute)
- Less than 5 minutes: 11
- 5 to 9 minutes: 312
- 10 to 14 minutes: 255
- 15 to 19 minutes: 174
- 20 to 24 minutes: 535
- 25 to 29 minutes: 109
- 30 to 34 minutes: 823
- 35 to 39 minutes: 184
- 40 to 44 minutes: 225
- 45 to 59 minutes: 463
- 60 to 89 minutes: 443
- 90 or more minutes: 36
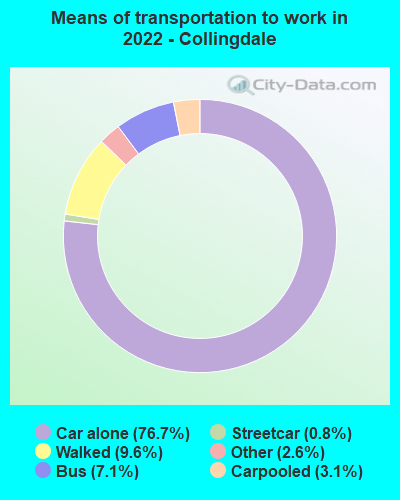
Means of transportation to work:
- Drove a car alone: 849 (57.7%)
- Carpooled: 32 (2.2%)
- Bus: 47 (3.2%)
- Subway or elevated rail: 8 (0.5%)
- Taxi: 48 (3.3%)
- Walked: 126 (8.6%)
- Worked at home: 396 (26.9%)

- Unemployment by race in 2022
- Unemployment rate for White non-Hispanic residents
- 5.4%Males
- 3.5%Females
- Unemployment rate for Black residents
- 12.8%Males
- 6.1%Females
- Unemployment rate for Asian residents
- 15.8%Females
- Unemployment rate for two or more race residents
- 30.7%Males
- Unemployment rate for Hispanic or Latino residents
- 7.3%Males

- Year of entry for the foreign-born population in Collingdale, Pennsylvania
- 4542010 or later
- 2822000 to 2009
- 1751990 to 1999
- 151980 to 1989
- 131970 to 1979
- 51Before 1970

First ancestries reported:
- Irish: 438 (7.7%)
- American: 271 (4.8%)
- Italian: 266 (4.7%)
- Liberian: 156 (2.8%)
- Haitian: 140 (2.5%)
- Sierra Leonean: 139 (2.5%)
- Jamaican: 132 (2.3%)
- African: 109 (1.9%)
- German: 83 (1.5%)
- English: 63 (1.1%)
- Polish: 31 (0.5%)
- European: 24 (0.4%)
- Scottish: 10 (0.2%)
- Swedish: 5 (0.09%)
- British: 4 (0.07%)
- Pennsylvania German: 4 (0.07%)
Most common places of birth for foreign-born residents (%):
| Collingdale: | 22.9% (263) |
| Pennsylvania: | 5.8% (54,190) |
| Collingdale: | 12.8% (147) |
| Pennsylvania: | 1.6% (15,224) |
| Collingdale: | 12.1% (139) |
| Pennsylvania: | 1.4% (12,910) |
| Collingdale: | 10.1% (116) |
| Pennsylvania: | 2.4% (22,612) |
| Collingdale: | 9.5% (109) |
| Pennsylvania: | 0.4% (3,949) |
| Collingdale: | 4.3% (49) |
| Pennsylvania: | 1.8% (16,884) |
| Collingdale: | 3.3% (38) |
| Pennsylvania: | 0.6% (5,479) |
| Collingdale: | 3.2% (37) |
| Pennsylvania: | 1.0% (9,386) |
| Collingdale: | 2.8% (32) |
| Pennsylvania: | 0.4% (3,736) |
| Collingdale: | 2.4% (27) |
| Pennsylvania: | 7.2% (67,704) |
| Collingdale: | 2.4% (27) |
| Pennsylvania: | 0.1% (1,134) |
| Collingdale: | 2.2% (25) |
| Pennsylvania: | 0.6% (5,368) |
| Collingdale: | 1.9% (22) |
| Pennsylvania: | 0.5% (5,099) |
Place of birth for U.S.-born residents:
- This state: 6,704
- Other state: 952
- Northeast: 537
- Midwest: 83
- South: 300
- West: 7
94.5% of Collingdale residents lived in the same house 1 years ago.
Out of people who lived in different houses, 40.6% lived in this county.
Out of people who lived in different counties, 76.3% lived in Pennsylvania.
| Collingdale: | 94.5% |
| State average: | 89.3% |
Education attainment for males 25 years and older:
- No schooling: 71
- Nursery to 4th grade: 43
- 5th and 6th grade: 30
- 7th and 8th grade: 97
- 9th grade: 32
- 10th grade: 44
- 11th grade: 23
- 12th grade, no diploma: 48
- High school graduate (or equivalency): 954
- Less than 1 year of college: 279
- Some college more than 1 year, no degree: 263
- Associate degree: 245
- Bachelor's degree: 172
- Master's degree: 94
- Professional school degree: 9
- Doctorate degree: 0

Education attainment for females 25 years and older:
- No schooling: 75
- Nursery to 4th grade: 0
- 5th and 6th grade: 0
- 7th and 8th grade: 50
- 9th grade: 99
- 10th grade: 28
- 11th grade: 83
- 12th grade, no diploma: 46
- High school graduate (or equivalency): 1,193
- Less than 1 year of college: 345
- Some college more than 1 year, no degree: 503
- Associate degree: 321
- Bachelor's degree: 397
- Master's degree: 131
- Professional school degree: 0
- Doctorate degree: 4


Housing units in structures:
- One, detached: 695
- One, attached: 2,198
- Two: 640
- 3 or 4: 181
- 5 to 9: 27
- 10 to 19: 3
- Mobile homes: 8
Housing units lacking complete kitchen facilities in 2022: 4.4%
House/condo owner moved in on average 13 years ago
Renter moved in on average 3 years ago

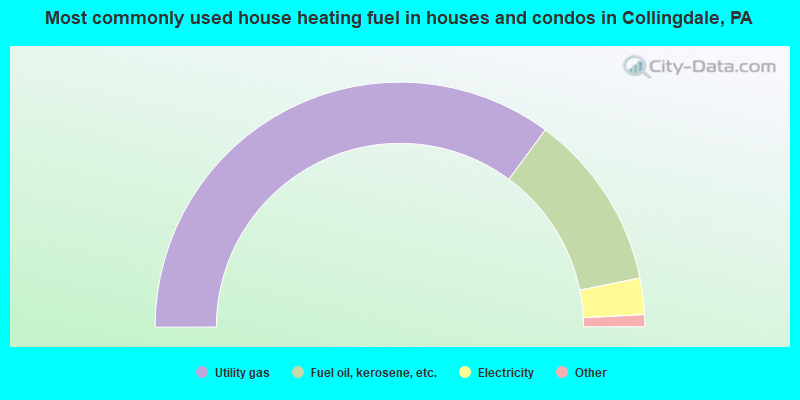
- 70.3%Utility gas
- 23.4%Fuel oil, kerosene, etc.
- 4.8%Electricity
- 0.6%No fuel used
- 0.5%Wood
- 0.5%Bottled, tank, or LP gas
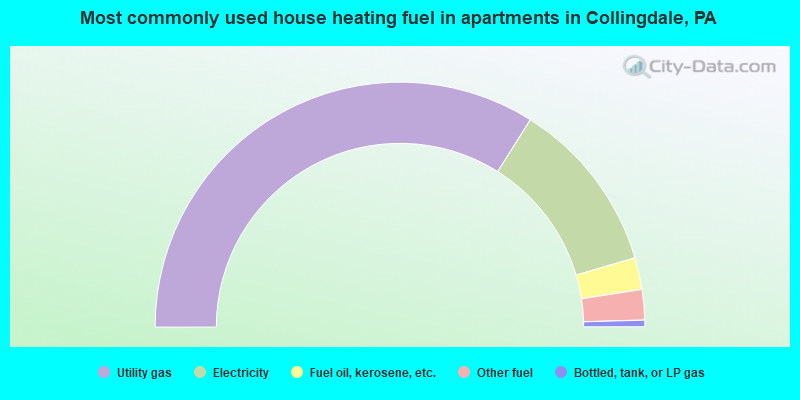
- 67.8%Utility gas
- 23.0%Electricity
- 4.2%Fuel oil, kerosene, etc.
- 4.0%Other fuel
- 0.9%Bottled, tank, or LP gas
Private vs. public school enrollment:
| Here: | 27.0% |
| Pennsylvania: | 15.7% |
| Here: | 18.1% |
| Pennsylvania: | 13.4% |
| Here: | 21.2% |
| Pennsylvania: | 39.8% |


