College Station, TX (Texas) Houses and Residents
Estimated median house or condo value in 2022: $326,000 (it was $114,000 in 2000 )
College Station:
$326,000Texas:
$275,400
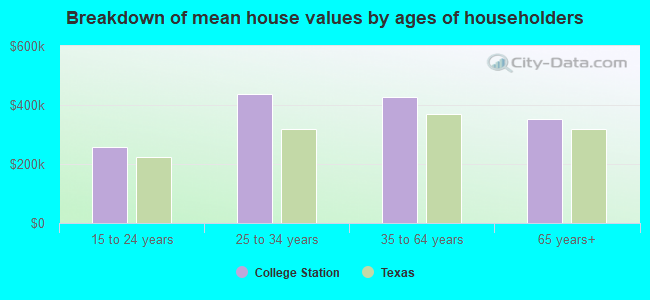
Lower value quartile - upper value quartile: $252,300 - $472,200Mean price in 2022: Detached houses: $425,363 Here:
$425,363State:
$369,058
Townhouses or other attached units: $255,203 Here:
$255,203State:
$327,631
In 2-unit structures: $284,053 Here:
$284,053State:
$374,947
In 3-to-4-unit structures: $239,007 Here:
$239,007State:
$209,652
In 5-or-more-unit structures: $341,349 Here:
$341,349State:
$413,944
Mobile homes: $111,672 Here:
$111,672State:
$124,413
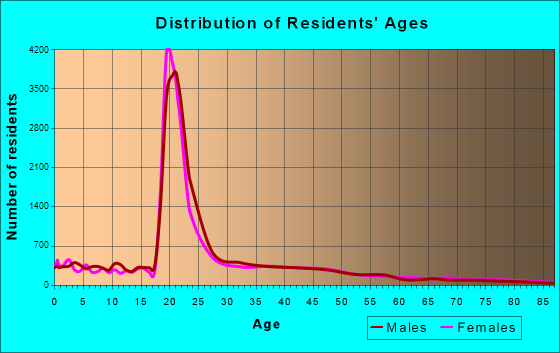
Total population: 103,483 (Urban population: 65,832, Rural population: 2,068 (all nonfarm) )
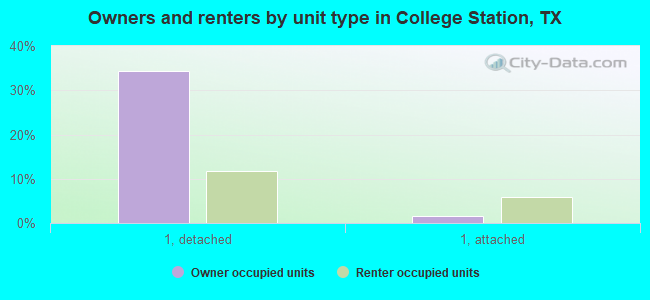
Houses: 49,597 (45,612 occupied: 15,085 owner occupied, 30,527 renter occupied )
% of renters here:
67%State:
38%
Housing density: 1,232 houses/condos per square mile
Median price asked for vacant for-sale houses and condos in 2022: $184,044.
Median contract rent in 2022: $957 (lower quartile is $713, upper quartile is $1,477)
Median rent asked for vacant for-rent units in 2022: $786
Median gross rent in College Station, TX in 2022: $1,134
Housing units in College Station with a mortgage: 10,076 (225 second mortgage, 0 home equity loan, 194 both second mortgage and home equity loan )Houses without a mortgage: 107
Median household income for houses/condos with a mortgage: $133,458
Median household income for apartments without a mortgage: $84,863
Median monthly housing costs: $1,236
Data:
Median house or condo value ($)
Median house or condo value ($ change since 2000)
Median house or condo value ($) - White
Median house or condo value ($) - Black or African American
Median house or condo value ($) - Asian
Median house or condo value ($) - Hispanic or Latino
Median house or condo value ($) - American Indian and Alaska Native
Median house or condo value ($) - Multirace
Median house or condo value ($) - Other Race
Median price asked for mobile homes ($)
Household density (households per square mile)
Mean house or condo value by units in structure - 1, detached ($)
Mean house or condo value by units in structure - 1, attached ($)
Mean house or condo value by units in structure - 2 ($)
Mean house or condo value by units in structure by units in structure - 3 or 4 ($)
Mean house or condo value by units in structure - 5 or more ($)
Mean house or condo value by units in structure - Boat, RV, van, etc. ($)
Mean house or condo value by units in structure - Mobile home ($)
Median contract rent ($)
Median contract rent - Lower quartile ($)
Median contract rent - Upper quartile ($)
Median gross rent ($)
Urban houses (%)
Rural houses (%)
Houses occupied (%)
Houses occupied (% change since 2000)
Houses owner occupied (%)
Houses owner occupied (% change since 2000)
Houses renter occupied (%)
Houses renter occupied (% change since 2000)
Vacant housing units - For rent (%)
Vacant housing units - For rent (% change since 2000)
Vacant housing units - For sale only (%)
Vacant housing units - For sale only (% change since 2000)
Vacant housing units - Rented or sold, not occupied (%)
Vacant housing units - Rented or sold, not occupied (% change since 2000)
Vacant housing units - For seasonal, recreational, or occasional use (%)
Vacant housing units - For seasonal, recreational, or occasional use (% change since 2000)
Vacant housing units - For migrant workers (%)
Vacant housing units - For migrant workers (% change since 2000)
Vacant housing units - Other vacant (%)
Vacant housing units - Other vacant (% change since 2000)
Median monthly housing costs ($)
Median household income for houses/condos with a mortgage ($)
Median household income for houses/condos without a mortgage ($)
Median household income ($)
Median household income ($) - White
Median household income ($) - Black or African American
Median household income ($) - Asian
Median household income ($) - Hispanic or Latino
Median household income ($) - American Indian and Alaska Native
Median household income ($) - Multirace
Median household income ($) - Other Race
Mortgage status - with mortgage (%)
Mortgage status - with second mortgage (%)
Mortgage status - with home equity loan (%)
Mortgage status - with both second mortgage and home equity loan (%)
Mortgage status - without a mortgage (%)
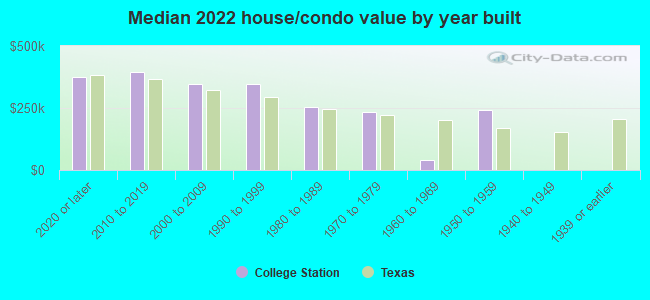
Median year house/condo built
Median year apartment built
Household type by relationship - Male householder living alone (%)
Household type by relationship - Male householder not living alone (%)
Household type by relationship - Female householder living alone (%)
Household type by relationship - Female householder not living alone (%)
Household type by relationship - Opposite-Sex spouse (%)
Household type by relationship - Same-Sex spouse (%)
Household type by relationship - Opposite-Sex unmarried partner (%)
Household type by relationship - Same-Sex unmarried partner (%)
Household type by relationship - In group quarters (%)
Size of family households - 2-person household (%)
Size of family households - 3-person household (%)
Size of family households - 4-person household (%)
Size of family households - 5-person household (%)
Size of family households - 6-person household (%)
Size of family households - 7-or-more-person household (%)
Size of nonfamily households - 1-person household (%)
Size of nonfamily households - 2-person household (%)
Size of nonfamily households - 3-person household (%)
Size of nonfamily households - 4-person household (%)
Size of nonfamily households - 5-person household (%)
Size of nonfamily households - 6-person household (%)
Size of nonfamily households - 7-or-moreperson household (%)
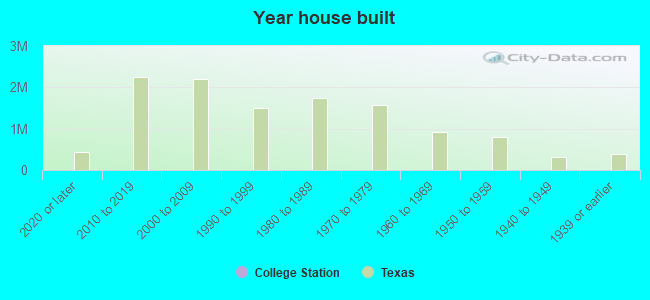
Year house built - Built 2010 or later (%)
Year house built - Built 2000 to 2009 (%)
Year house built - Built 1990 to 1999 (%)
Year house built - Built 1980 to 1989 (%)
Year house built - Built 1970 to 1979 (%)
Year house built - Built 1960 to 1969 (%)
Year house built - Built 1950 to 1959 (%)
Year house built - Built 1940 to 1949 (%)
Year house built - Built 1939 or earlier (%)
Median number of rooms in houses and condos
Median number of rooms in apartments
Median number of bedrooms in owner occupied houses
Mean number of bedrooms in owner occupied houses
Median number of bedrooms in renter occupied houses
Mean number of bedrooms in renter occupied houses
Median number of vehichles in owner occupied houses
Mean number of vehichles in owner occupied houses
Median number of vehichles in renter occupied houses
Mean number of vehichles in renter occupied houses
Rooms in owner-occupied houses - 1 room (%)
Rooms in owner-occupied houses - 2 rooms (%)
Rooms in owner-occupied houses - 3 rooms (%)
Rooms in owner-occupied houses - 4 rooms (%)
Rooms in owner-occupied houses - 5 rooms (%)
Rooms in owner-occupied houses - 6 rooms (%)
Rooms in owner-occupied houses - 7 rooms (%)
Rooms in owner-occupied houses - 8 rooms (%)
Rooms in owner-occupied houses - 9+ rooms (%)
Rooms in renter-occupied houses - 1 room (%)
Rooms in renter-occupied houses - 2 rooms (%)
Rooms in renter-occupied houses - 3 rooms (%)
Rooms in renter-occupied houses - 4 rooms (%)
Rooms in renter-occupied houses - 5 rooms (%)
Rooms in renter-occupied houses - 6 rooms (%)
Rooms in renter-occupied houses - 7 rooms (%)
Rooms in renter-occupied houses - 8 rooms (%)
Rooms in renter-occupied houses - 9+ rooms (%)
Bedrooms in owner-occupied houses - no bedrooms (%)
Bedrooms in owner-occupied houses - 1 bedroom (%)
Bedrooms in owner-occupied houses - 2 bedrooms (%)
Bedrooms in owner-occupied houses - 3 bedrooms (%)
Bedrooms in owner-occupied houses - 4 bedrooms (%)
Bedrooms in owner-occupied houses - 5+ bedrooms (%)
Bedrooms in renter-occupied houses - no bedrooms (%)
Bedrooms in renter-occupied houses - 1 bedroom (%)
Bedrooms in renter-occupied houses - 2 bedrooms (%)
Bedrooms in renter-occupied houses - 3 bedrooms (%)
Bedrooms in renter-occupied houses - 4 bedrooms (%)
Bedrooms in renter-occupied houses - 5+ bedrooms (%)
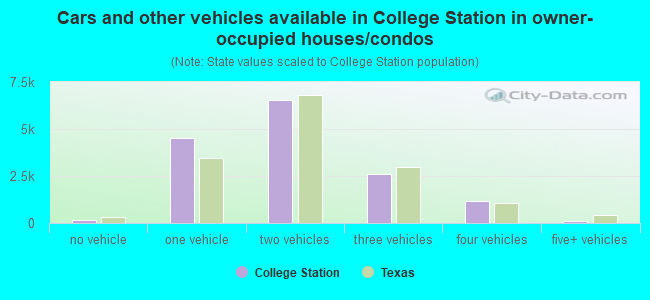
Vehicles available in owner-occupied houses - no vehicle available (%)
Vehicles available in owner-occupied houses - 1 vehicle available(%)
Vehicles available in owner-occupied houses - 2 Vehicles available (%)
Vehicles available in owner-occupied houses - 3 Vehicles available (%)
Vehicles available in owner-occupied houses - 4 Vehicles available (%)
Vehicles available in owner-occupied houses - 5+ Vehicles available (%)
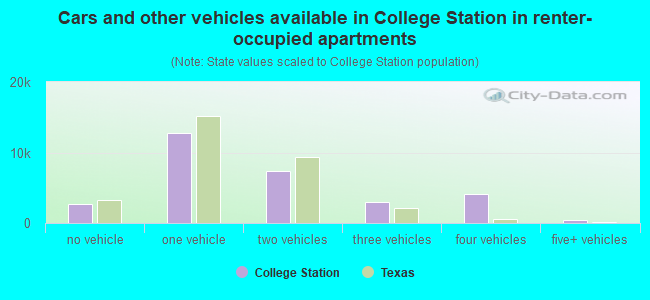
Vehicles available in renter-occupied houses - no vehicle available (%)
Vehicles available in renter-occupied houses - 1 vehicle available (%)
Vehicles available in renter-occupied houses - 2 Vehicles available (%)
Vehicles available in renter-occupied houses - 3 Vehicles available (%)
Vehicles available in renter-occupied houses - 4 Vehicles available (%)
Vehicles available in renter-occupied houses - 5+ Vehicles available (%)
Housing units in structures - 1, detached (%)
Housing units in structures - 1, attached (%)
Housing units in structures - 2 (%)
Housing units in structures - 3 or 4 (%)
Housing units in structures - 5 to 9 (%)
Housing units in structures - 10 to 19 (%)
Housing units in structures - 20 to 49 (%)
Housing units in structures - 50 or more (%)
Housing units in structures - Mobile home (%)
Housing units in structures - Boat, RV, van, etc. (%)
Housing units in structures - Owners - 1, detached (%)
Housing units in structures - Owners - 1, attached (%)
Housing units in structures - Owners - 2 (%)
Housing units in structures - Owners - 3 or 4 (%)
Housing units in structures - Owners - 5 to 9 (%)
Housing units in structures - Owners - 10 to 19 (%)
Housing units in structures - Owners - 20 to 49 (%)
Housing units in structures - Owners - 50 or more (%)
Housing units in structures - Owners - Mobile home (%)
Housing units in structures - Owners - Boat, RV, van, etc. (%)
Housing units in structures - Renters - 1, detached (%)
Housing units in structures - Renters - 1, attached (%)
Housing units in structures - Renters - 2 (%)
Housing units in structures - Renters - 3 or 4 (%)
Housing units in structures - Renters - 5 to 9 (%)
Housing units in structures - Renters - 10 to 19 (%)
Housing units in structures - Renters - 20 to 49 (%)
Housing units in structures - Renters - 50 or more (%)
Housing units in structures - Renters - Mobile home (%)
Housing units in structures - Renters - Boat, RV, van, etc. (%)
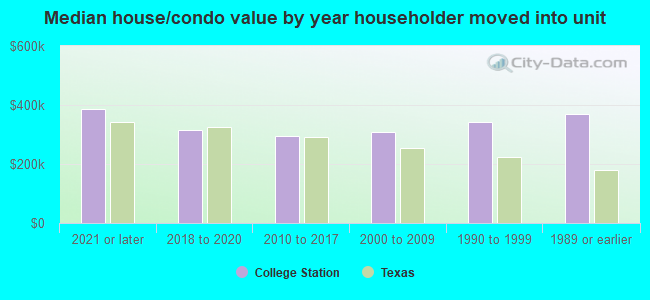
House/condo owner moved in on average (years ago)
Renter moved in on average (years ago)
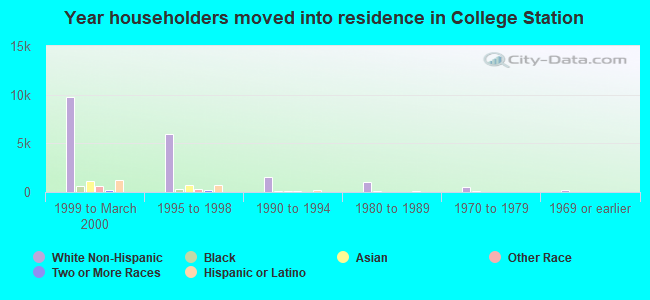
Year householder moved into unit - Moved in 1999 to March 2000 (%)
Year householder moved into unit - Moved in 1999 to March 2000 (%) - White
Year householder moved into unit - Moved in 1999 to March 2000 (%) - Black or African American
Year householder moved into unit - Moved in 1999 to March 2000 (%) - Asian
Year householder moved into unit - Moved in 1999 to March 2000 (%) - Hispanic or Latino
Year householder moved into unit - Moved in 1999 to March 2000 (%) - American Indian and Alaska Native
Year householder moved into unit - Moved in 1999 to March 2000 (%) - Multirace
Year householder moved into unit - Moved in 1999 to March 2000 (%) - Other Race
Year householder moved into unit - Moved in 1995 to 1998 (%)
Year householder moved into unit - Moved in 1995 to 1998 (%) - White
Year householder moved into unit - Moved in 1995 to 1998 (%) - Black or African American
Year householder moved into unit - Moved in 1995 to 1998 (%) - Asian
Year householder moved into unit - Moved in 1995 to 1998 (%) - Hispanic or Latino
Year householder moved into unit - Moved in 1995 to 1998 (%) - American Indian and Alaska Native
Year householder moved into unit - Moved in 1995 to 1998 (%) - Multirace
Year householder moved into unit - Moved in 1995 to 1998 (%) - Other Race
Year householder moved into unit - Moved in 1990 to 1994 (%)
Year householder moved into unit - Moved in 1990 to 1994 (%) - White
Year householder moved into unit - Moved in 1990 to 1994 (%) - Black or African American
Year householder moved into unit - Moved in 1990 to 1994 (%) - Asian
Year householder moved into unit - Moved in 1990 to 1994 (%) - Hispanic or Latino
Year householder moved into unit - Moved in 1990 to 1994 (%) - American Indian and Alaska Native
Year householder moved into unit - Moved in 1990 to 1994 (%) - Multirace
Year householder moved into unit - Moved in 1990 to 1994 (%) - Other Race
Year householder moved into unit - Moved in 1980 to 1989 (%)
Year householder moved into unit - Moved in 1980 to 1989 (%) - White
Year householder moved into unit - Moved in 1980 to 1989 (%) - Black or African American
Year householder moved into unit - Moved in 1980 to 1989 (%) - Asian
Year householder moved into unit - Moved in 1980 to 1989 (%) - Hispanic or Latino
Year householder moved into unit - Moved in 1980 to 1989 (%) - American Indian and Alaska Native
Year householder moved into unit - Moved in 1980 to 1989 (%) - Multirace
Year householder moved into unit - Moved in 1980 to 1989 (%) - Other Race
Year householder moved into unit - Moved in 1970 to 1979 (%)
Year householder moved into unit - Moved in 1970 to 1979 (%) - White
Year householder moved into unit - Moved in 1970 to 1979 (%) - Black or African American
Year householder moved into unit - Moved in 1970 to 1979 (%) - Asian
Year householder moved into unit - Moved in 1970 to 1979 (%) - Hispanic or Latino
Year householder moved into unit - Moved in 1970 to 1979 (%) - American Indian and Alaska Native
Year householder moved into unit - Moved in 1970 to 1979 (%) - Multirace
Year householder moved into unit - Moved in 1970 to 1979 (%) - Other Race
Year householder moved into unit - Moved in 1969 or earlier (%)
Year householder moved into unit - Moved in 1969 or earlier (%) - White
Year householder moved into unit - Moved in 1969 or earlier (%) - Black or African American
Year householder moved into unit - Moved in 1969 or earlier (%) - Asian
Year householder moved into unit - Moved in 1969 or earlier (%) - Hispanic or Latino
Year householder moved into unit - Moved in 1969 or earlier (%) - American Indian and Alaska Native
Year householder moved into unit - Moved in 1969 or earlier (%) - Multirace
Year householder moved into unit - Moved in 1969 or earlier (%) - Other Race
Housing units lacking complete plumbing facilities (%)
Housing units lacking complete kitchen facilities (%)
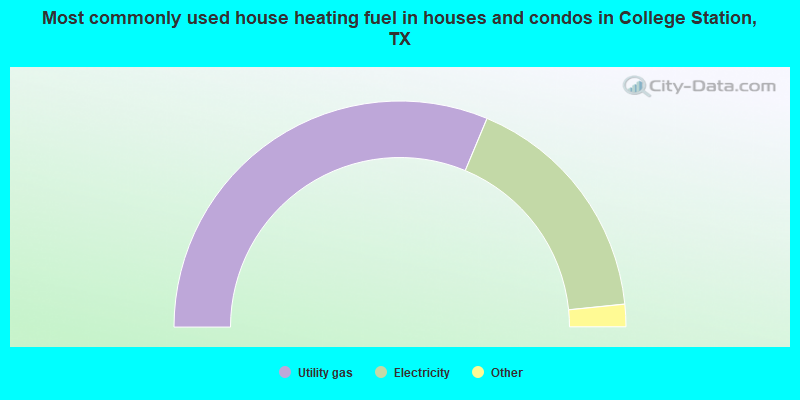
House heating fuel used in houses and condos - Utility gas (%)
House heating fuel used in houses and condos - Bottled, tank, or LP gas (%)
House heating fuel used in houses and condos - Electricity (%)
House heating fuel used in houses and condos - Fuel oil, kerosene, etc. (%)
House heating fuel used in houses and condos - Coal or coke (%)
House heating fuel used in houses and condos - Wood (%)
House heating fuel used in houses and condos - Solar energy (%)
House heating fuel used in houses and condos - Other fuel (%)
House heating fuel used in houses and condos - No fuel used (%)
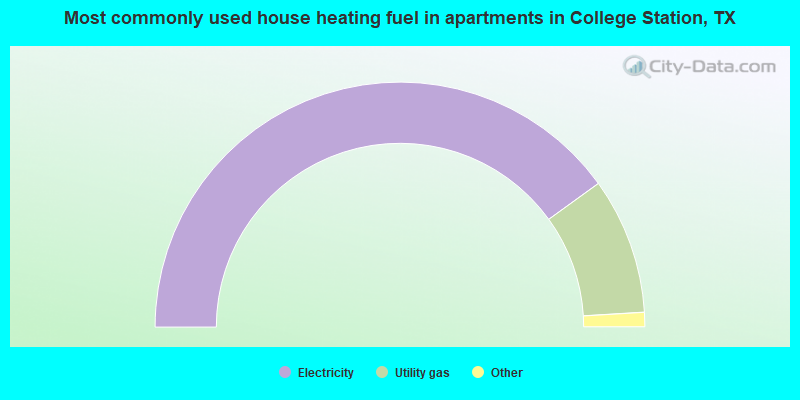
House heating fuel used in apartments - Utility gas (%)
House heating fuel used in apartments - Bottled, tank, or LP gas (%)
House heating fuel used in apartments - Electricity (%)
House heating fuel used in apartments - Fuel oil, kerosene, etc. (%)
House heating fuel used in apartments - Coal or coke (%)
House heating fuel used in apartments - Wood (%)
House heating fuel used in apartments - Solar energy (%)
House heating fuel used in apartments - Other fuel (%)
House heating fuel used in apartments - No fuel used (%)
Median year house/condo built: 2002Median year apartment built: 1996Household type by relationship:
Households: 124,326
Male householders: 23,671 (6,701 living alone ), Female householders: 21,941 (6,615 living alone )14,944 spouses (14,851 opposite-sex spouses ), 2,965 unmarried partners , (2,891 opposite-sex unmarried partners ), 24,426 children (23,074 natural , 892 adopted , 460 stepchildren ), 730 grandchildren , 1,114 brothers or sisters , 979 parents , 0 foster children , 1,390 other relatives , 14,732 non-relatives In group quarters: 17,434
Size of family households: 10,058 2-persons , 5,402 3-persons , 4,067 4-persons , 930 5-persons , 1,082 6-persons , 483 7-or-more-persons .
Size of nonfamily households: 13,316 1-person , 4,414 2-persons , 2,462 3-persons , 3,013 4-persons , 356 5-persons , 29 6-persons .
13,987 married couples with children. single-parent households (643 men , 6,794 women ).
78.3% of residents of College Station speak English at home. of residents speak Spanish at home (80% speak English very well , 12% speak English well , 4% speak English not well , 4% don't speak English at all ).of residents speak other Indo-European language at home (79% speak English very well , 16% speak English well , 3% speak English not well , 1% don't speak English at all ).of residents speak Asian or Pacific Island language at home (68% speak English very well , 22% speak English well , 9% speak English not well , 1% don't speak English at all ).of residents speak other language at home (79% speak English very well , 17% speak English well , 4% speak English not well , 1% don't speak English at all ).
Foreign born population: 16,153 (13.0%)of them are naturalized citizens )
Median number of rooms in houses and condos:
Median number of rooms in apartments
Owner-occupied Renter-occupied
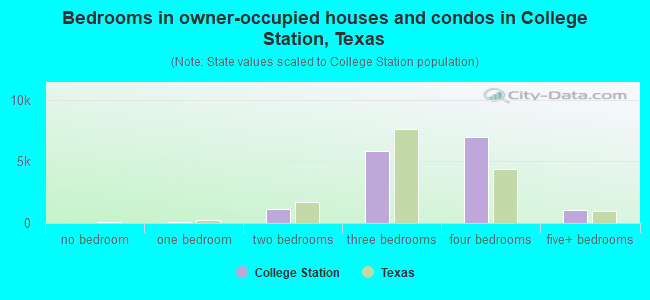
Bedrooms in owner-occupied houses and condos in College Station, Texas
0 no bedroom 51 1 bedroom 1,144 2 bedrooms 5,831 3 bedrooms 7,021 4 bedrooms 1,038 5+ bedrooms
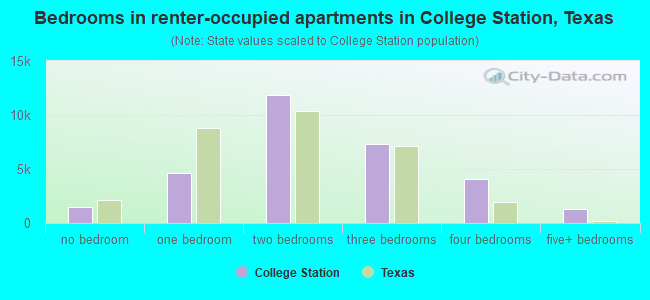
Bedrooms in renter-occupied apartments in College Station, Texas
1,440 no bedroom 4,594 1 bedroom 11,825 2 bedrooms 7,338 3 bedrooms 4,050 4 bedrooms 1,280 5+ bedrooms
Owner-occupied Renter-occupied
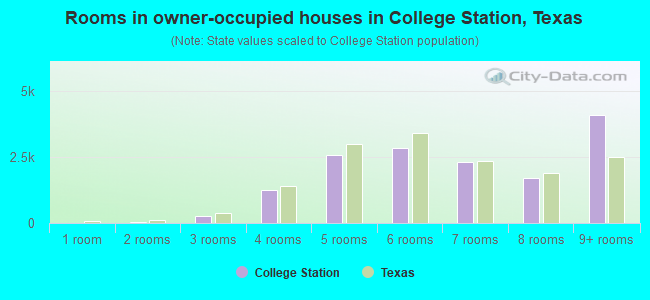
Rooms in owner-occupied houses in College Station, Texas
0 1 room 51 2 rooms 272 3 rooms 1,262 4 rooms 2,571 5 rooms 2,829 6 rooms 2,318 7 rooms 1,692 8 rooms 4,090 9+ rooms
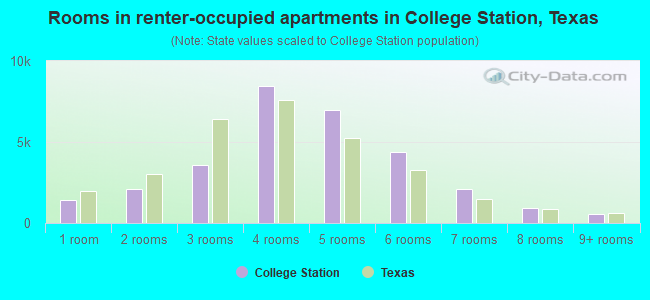
Rooms in renter-occupied apartments in College Station, Texas
1,440 1 room 2,122 2 rooms 3,590 3 rooms 8,426 4 rooms 6,953 5 rooms 4,376 6 rooms 2,115 7 rooms 920 8 rooms 585 9+ rooms
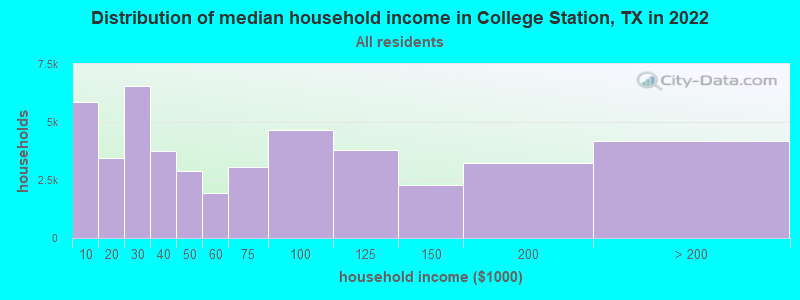
College Station, TX household income distribution 5,843 Less than $10,0003,446 $10,000 to $19,9996,546 $20,000 to $29,9993,746 $30,000 to $39,9992,884 $40,000 to $49,9991,940 $50,000 to $59,9993,063 $60,000 to $74,9994,660 $75,000 to $99,9993,781 $100,000 to $124,9992,289 $125,000 to $149,9993,254 $150,000 to $199,9994,160 $200,000 or more
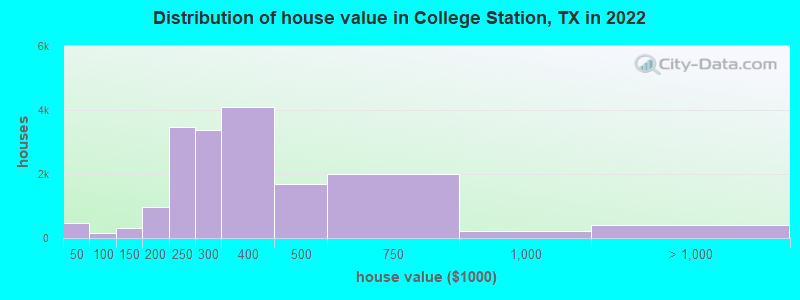
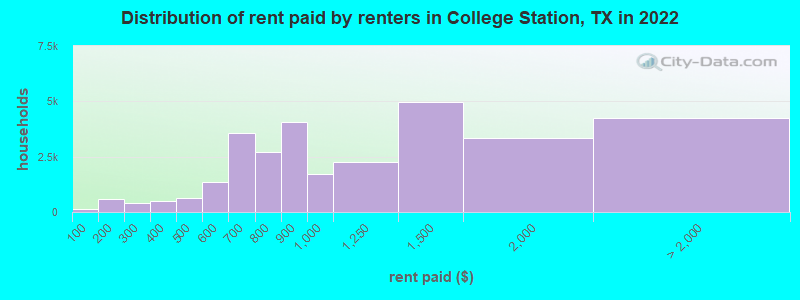
Home value of owner - occupied houses in 2022 in College Station, TX 122 Less than $10,00015 $10,000 to $14,99987 $20,000 to $24,999108 $30,000 to $34,99954 $35,000 to $39,99993 $40,000 to $49,99916 $50,000 to $59,99912 $70,000 to $79,99924 $80,000 to $89,999160 $100,000 to $124,999142 $125,000 to $149,999331 $150,000 to $174,999644 $175,000 to $199,9993,464 $200,000 to $249,9993,374 $250,000 to $299,9994,080 $300,000 to $399,9991,681 $400,000 to $499,9991,995 $500,000 to $749,999215 $750,000 to $999,999257 $1,000,000 to $1,499,999135 $2,000,000 or moreRent paid by renters in 2022 in College Station, TX 138 Less than $100572 $100 to $14916 $150 to $199183 $200 to $249242 $250 to $299249 $300 to $349229 $350 to $399283 $400 to $449344 $450 to $499512 $500 to $549854 $550 to $5992,143 $600 to $6491,437 $650 to $6991,149 $700 to $7491,572 $750 to $7994,082 $800 to $8991,710 $900 to $9992,243 $1,000 to $1,2494,962 $1,250 to $1,4993,364 $1,500 to $1,9992,725 $2,000 to $2,499483 $2,500 to $2,999133 $3,000 to $3,499344 $3,500 or more558 No cash rent
Percentage of workers working in this county: 93.4%Number of people working at home: 9,894 (16.0% of all workers )
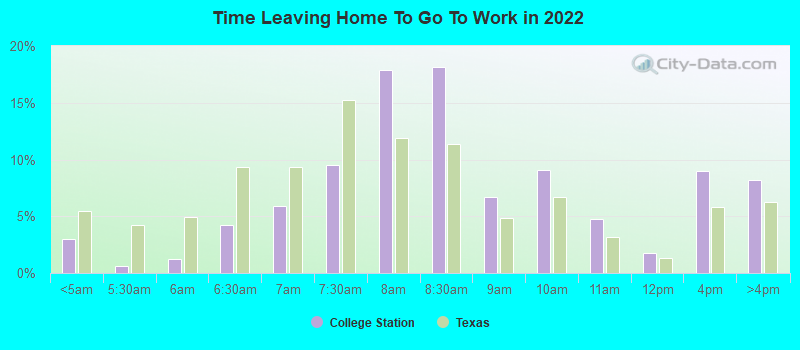
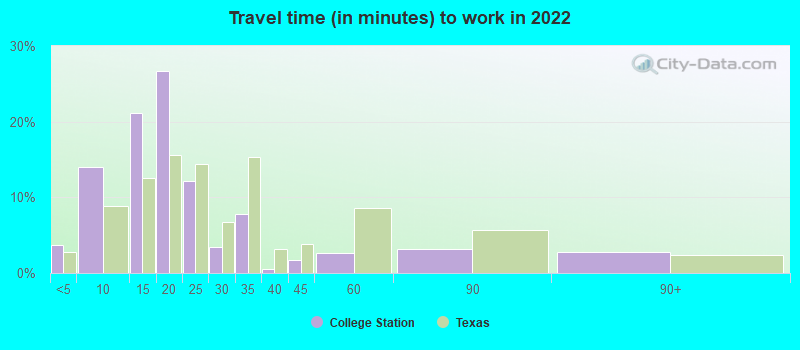
Travel time to work (commute)
Less than 5 minutes: 2,2955 to 9 minutes: 5,43910 to 14 minutes: 13,05315 to 19 minutes: 15,22820 to 24 minutes: 5,60825 to 29 minutes: 1,39830 to 34 minutes: 5,07335 to 39 minutes: 23540 to 44 minutes: 79045 to 59 minutes: 1,25160 to 89 minutes: 48190 or more minutes: 1,053
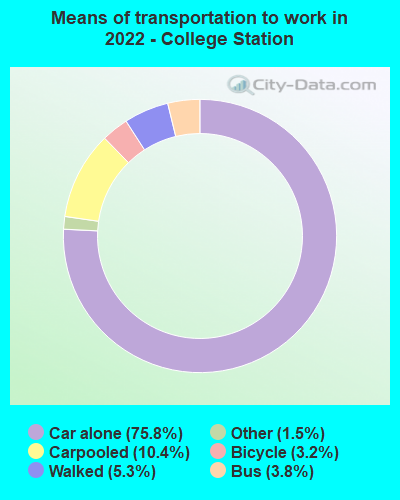
Means of transportation to work:
Drove a car alone: 43,186 (64.6%)Carpooled: 5,940 (8.9%)Bus : 2,175 (3.3%)Taxi: 869 (1.3%)Bicycle: 1,810 (2.7%)Walked: 3,025 (4.5%)Worked at home: 9,894 (14.8%)
Unemployment by race in 2022
Unemployment rate for White non-Hispanic residents 4.5% Males3.4% FemalesUnemployment rate for Black residents 6.1% Males10.4% FemalesUnemployment rate for Asian residents 2.7% Males1.6% FemalesUnemployment rate for other race residents 6.7% Males1.2% FemalesUnemployment rate for two or more race residents 2.9% Males3.6% FemalesUnemployment rate for Hispanic or Latino residents 4.5% Males4.7% Females
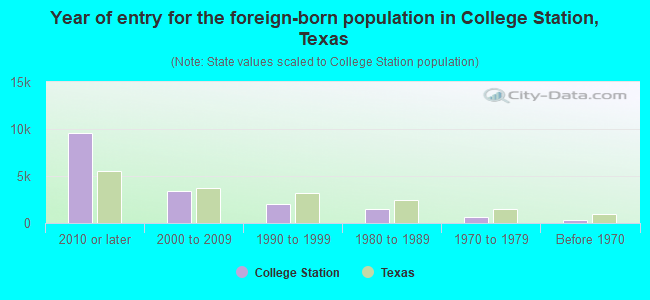
Year of entry for the foreign-born population in College Station, Texas
9,553 2010 or later 3,352 2000 to 2009 1,993 1990 to 1999 1,480 1980 to 1989 586 1970 to 1979 369 Before 1970
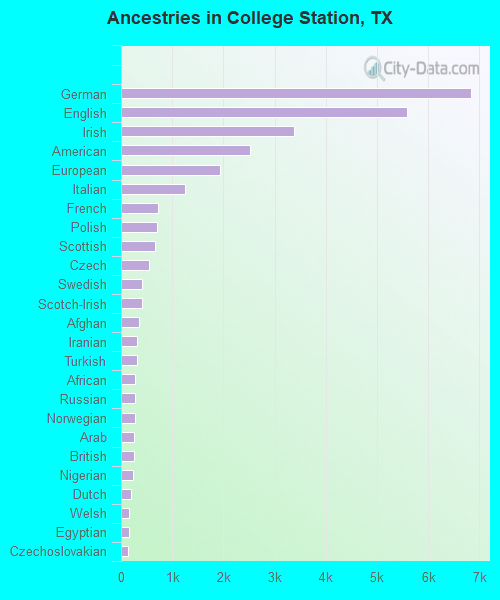
First ancestries reported:
German: 6,849 (11.3%)
English: 5,586 (9.2%)
Irish: 3,375 (5.6%)
American: 2,512 (4.2%)
European: 1,942 (3.2%)
Italian: 1,256 (2.1%)
French: 719 (1.2%)
Polish: 702 (1.2%)
Scottish: 655 (1.1%)
Czech: 541 (0.9%)
Swedish: 410 (0.7%)
Scotch-Irish: 404 (0.7%)
Afghan: 350 (0.6%)
Iranian: 319 (0.5%)
Turkish: 309 (0.5%)
African: 272 (0.5%)
Russian: 267 (0.4%)
Norwegian: 265 (0.4%)
Arab: 260 (0.4%)
British: 249 (0.4%)
Nigerian: 236 (0.4%)
Dutch: 198 (0.3%)
Welsh: 166 (0.3%)
Egyptian: 149 (0.2%)
Czechoslovakian: 138 (0.2%)
French Canadian: 134 (0.2%)
Palestinian: 130 (0.2%)
Lebanese: 118 (0.2%)
Greek: 101 (0.2%)
Portuguese: 97 (0.2%)
Ukrainian: 82 (0.1%)
Haitian: 80 (0.1%)
Scandinavian: 75 (0.1%)
Danish: 75 (0.1%)
Eastern European: 72 (0.1%)
Hungarian: 65 (0.1%)
Finnish: 64 (0.1%)
Northern European: 61 (0.1%)
German Russian: 61 (0.1%)
Canadian: 54 (0.09%)
Romanian: 51 (0.08%)
Jordanian: 45 (0.07%)
Kenyan: 44 (0.07%)
Croatian: 38 (0.06%)
Ghanaian: 37 (0.06%)
Israeli: 32 (0.05%)
Somali: 29 (0.05%)
Brazilian: 25 (0.04%)
Slovene: 23 (0.04%)
Jamaican: 23 (0.04%)
Serbian: 19 (0.03%)
Lithuanian: 18 (0.03%)
Ethiopian: 18 (0.03%)
Yugoslavian: 16 (0.03%)
Belgian: 15 (0.02%)
Austrian: 15 (0.02%)
Guyanese: 14 (0.02%)
Cajun: 11 (0.02%)
Slavic: 9 (0.01%)
Swiss: 7 (0.01%)
Iraqi: 7 (0.01%)
Most common places of birth for foreign-born residents (%): China, excluding Hong Kong and Taiwan College Station:
15.8% (2,405)Texas:
2.3% (115,558)
Mexico College Station:
12.7% (1,938)Texas:
48.4% (2,411,723)
India College Station:
12.0% (1,831)Texas:
6.1% (306,347)
Korea College Station:
7.2% (1,094)Texas:
1.2% (60,172)
Venezuela College Station:
5.4% (828)Texas:
1.5% (72,413)
Bangladesh College Station:
5.0% (758)Texas:
0.3% (16,549)
Taiwan College Station:
3.1% (471)Texas:
0.6% (27,844)
Guatemala College Station:
2.5% (377)Texas:
1.8% (87,382)
Colombia College Station:
2.3% (355)Texas:
1.2% (61,555)
Vietnam College Station:
2.3% (345)Texas:
3.7% (184,770)
Turkey College Station:
2.0% (311)Texas:
0.3% (13,298)
Indonesia College Station:
1.9% (294)Texas:
0.2% (8,808)
Pakistan College Station:
1.7% (254)Texas:
1.2% (62,159)
Place of birth for U.S.-born residents:
This state: 77,343Other state: 28,513Northeast: 3,427Midwest: 8,855South: 10,454West: 5,777 63.9% of College Station residents lived in the same house 1 years ago.
Out of people who lived in different houses, 30.4% lived in this county.
Out of people who lived in different counties, 76.0% lived in Texas.
College Station:
63.9%State average:
85.7%
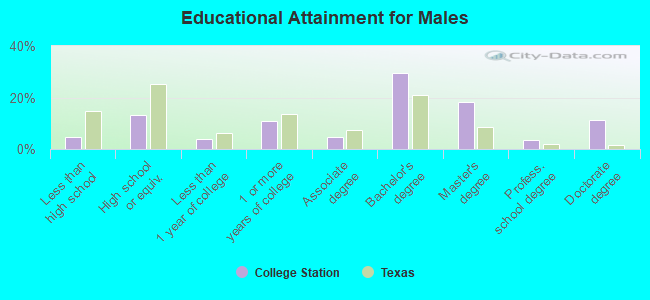
Education attainment for males 25 years and older:
No schooling: 572Nursery to 4th grade: 05th and 6th grade: 2047th and 8th grade: 1579th grade: 17610th grade: 011th grade: 012th grade, no diploma: 200High school graduate (or equivalency): 3,581Less than 1 year of college: 1,095Some college more than 1 year, no degree: 2,902Associate degree: 1,226Bachelor's degree: 7,979Master's degree: 4,910Professional school degree: 902Doctorate degree: 3,061
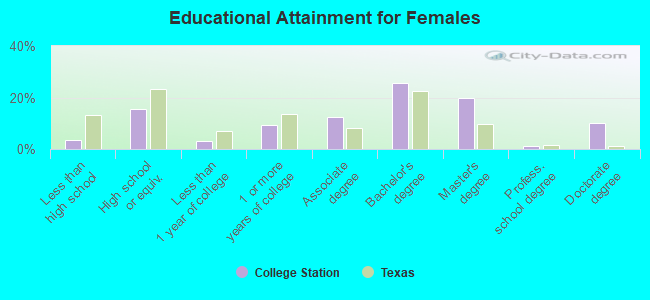
Education attainment for females 25 years and older:
No schooling: 381Nursery to 4th grade: 05th and 6th grade: 07th and 8th grade: 09th grade: 11610th grade: 5211th grade: 13212th grade, no diploma: 200High school graduate (or equivalency): 4,023Less than 1 year of college: 807Some college more than 1 year, no degree: 2,382Associate degree: 3,214Bachelor's degree: 6,661Master's degree: 5,161Professional school degree: 255Doctorate degree: 2,581
Housing units in structures:
One, detached: 21,470One, attached: 3,735Two: 2,1343 or 4: 4,2705 to 9: 4,75810 to 19: 3,48720 to 49: 1,87550 or more: 7,014Mobile homes: 715Boats, RVs, vans, etc.: 139Median worth of mobile homes: $33,400
Housing units lacking complete plumbing facilities in 2022: 0.3%Housing units lacking complete kitchen facilities in 2022: 2.0%House/condo owner moved in on average 6 years ago
Renter moved in on average 0 years ago
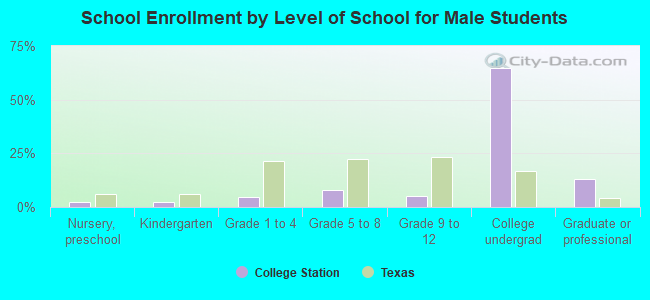
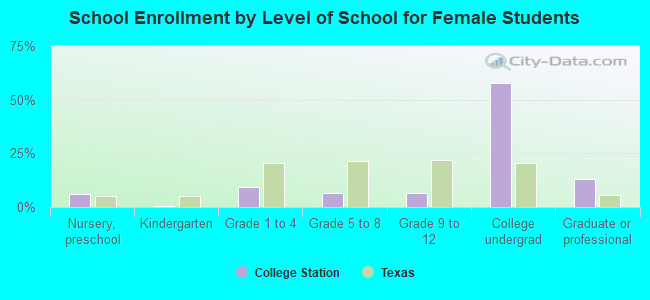
Private vs. public school enrollment:
Students in private schools in grades 1 to 8 (elementary and middle school): 373 Students in private schools in grades 9 to 12 (high school): 344 Students in private undergraduate colleges: 577