College Place, WA (Washington) Houses and Residents
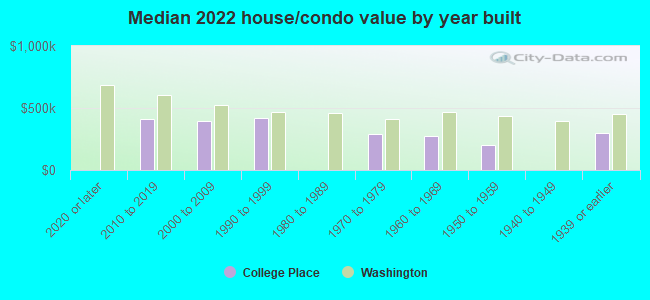
| College Place: | $354,524 |
| Washington: | $569,500 |
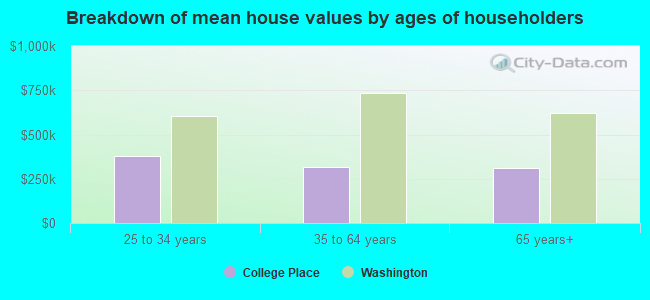
Mean price in 2022:
Detached houses: $330,609
Here: $330,609 State: $734,307 Townhouses or other attached units: $365,802
Here: $365,802 State: $657,697 In 2-unit structures: $255,425
Here: $255,425 State: $534,634 Mobile homes: $70,682
Here: $70,682 State: $218,362
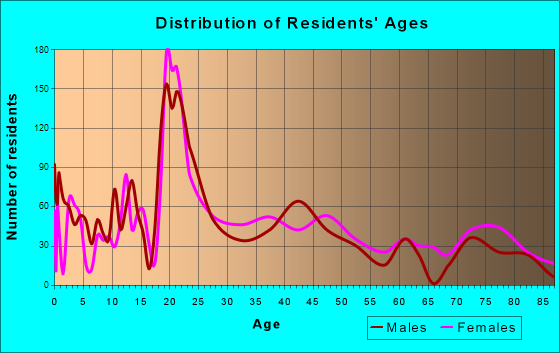
Total population: 8,997 (Urban population: 7,814 (all inside urban clusters), Rural population: 0)
Houses: 3,801 (3,448 occupied: 2,267 owner occupied, 1,192 renter occupied)
| % of renters here: | 34% |
| State: | 36% |
Housing density: 1,571 houses/condos per square mile
Median price asked for vacant for-sale houses and condos in 2022 in this county: $258,554.
Median contract rent in 2022: $958 (lower quartile is $755, upper quartile is $1,225)
Median rent asked for vacant for-rent units in 2022: $1,095
Median gross rent in College Place, WA in 2022: $1,051
Housing units in College Place with a mortgage: 1,351 (50 second mortgage, 0 home equity loan, 32 both second mortgage and home equity loan)
Houses without a mortgage: 0
Median household income for houses/condos with a mortgage: $116,477
Median household income for apartments without a mortgage: $53,619
Median monthly housing costs: $1,106
Compare current foreclosures near College Place, WA:
| Photo | Address | Area | Beds / Baths | Price | Details |
|---|---|---|---|---|---|

|
#1
NE Sprucewood Pl
College Place, WA 99324
|
1,403 sq. feet
|
2 baths 3 beds |
show details | |

|
#2
SE Falbo Dr
College Place, WA 99324
|
2,030 sq. feet
|
2 baths 3 beds |
show details | |

|
#3
SE 8th St
College Place, WA 99324
|
1,142 sq. feet
|
1 baths 3 beds |
show details | |

|
#4
NW B St
College Place, WA 99324
|
988 sq. feet
|
1 baths 2 beds |
show details | |

|
#5
NE Fernwood Pl
College Place, WA 99324
|
1,222 sq. feet
|
2 baths 3 beds |
show details | |

|
#6
SW Silverstar Ln, Apt 301
College Place, WA 99324
|
- sq. feet
|
- baths - beds |
show details | |

|
#7
NE Birch Ave # 1
College Place, WA 99324
|
- sq. feet
|
- baths - beds |
show details | |

|
#8
SW Julia St
College Place, WA 99324
|
- sq. feet
|
- baths - beds |
show details | |

|
#9
SE Independence Dr
College Place, WA 99324
|
- sq. feet
|
- baths - beds |
show details | |

|
#10
Lowell Dr
Walla Walla, WA 99362
|
1,345 sq. feet
|
2 baths 3 beds |
show details |
| Photo | Address | Area | Beds / Baths | Price | Details |
|---|---|---|---|---|---|

|
#11
Avalon St
Walla Walla, WA 99362
|
1,019 sq. feet
|
2 baths 4 beds |
show details | |

|
#12
W Chestnut St
Walla Walla, WA 99362
|
1,378 sq. feet
|
1 baths 3 beds |
show details | |

|
#13
Leonard Dr
Walla Walla, WA 99362
|
1,150 sq. feet
|
2 baths 3 beds |
show details | |

|
#14
Elk Fork Dr
Walla Walla, WA 99362
|
2,243 sq. feet
|
2 baths 4 beds |
show details | |

|
#15
Hobson St
Walla Walla, WA 99362
|
1,367 sq. feet
|
1 baths 2 beds |
show details | |

|
#16
Van Donge Ln
Walla Walla, WA 99362
|
3,650 sq. feet
|
3 baths 5 beds |
show details | |

|
#17
E Alder St
Walla Walla, WA 99362
|
2,064 sq. feet
|
2 baths 2 beds |
show details | |

|
#18
Bush St
Walla Walla, WA 99362
|
2,001 sq. feet
|
2 baths 5 beds |
show details | |

|
#19
Frankland St
Walla Walla, WA 99362
|
792 sq. feet
|
1 baths 2 beds |
show details | |

|
#20
Boyer Dr
Walla Walla, WA 99362
|
1,081 sq. feet
|
1 baths 4 beds |
show details |
| Photo | Address | Area | Beds / Baths | Price | Details |
|---|---|---|---|---|---|

|
#21
Garden Dr
Walla Walla, WA 99362
|
2,028 sq. feet
|
3 baths 3 beds |
show details | |

|
#22
Jackson St
Walla Walla, WA 99362
|
884 sq. feet
|
1 baths 2 beds |
show details | |

|
#23
Aspen St
Walla Walla, WA 99362
|
1,212 sq. feet
|
2 baths 3 beds |
show details | |

|
#24
Avalon St
Walla Walla, WA 99362
|
1,979 sq. feet
|
2 baths 4 beds |
show details | |

|
#25
Lincoln St
Walla Walla, WA 99362
|
722 sq. feet
|
1 baths 1 beds |
show details | |

|
#26
Catherine St
Walla Walla, WA 99362
|
3,242 sq. feet
|
3 baths 6 beds |
show details | |

|
#27
Highland Rd
Walla Walla, WA 99362
|
1,848 sq. feet
|
2 baths 3 beds |
show details | |

|
#28
W Broadway Ave
Milton Freewater, OR 97862
|
1,599 sq. feet
|
2 baths 3 beds |
show details | |

|
#29
Miller St
Milton Freewater, OR 97862
|
1,064 sq. feet
|
1 baths 3 beds |
show details | |

|
#30
Parallel St
Milton Freewater, OR 97862
|
1,080 sq. feet
|
1 baths 3 beds |
show details |
| Photo | Address | Area | Beds / Baths | Price | Details |
|---|---|---|---|---|---|

|
#31
Lamb St
Milton Freewater, OR 97862
|
1,512 sq. feet
|
2 baths 3 beds |
show details | |

|
#32
NE 14th Ave
Milton Freewater, OR 97862
|
1,134 sq. feet
|
2 baths 3 beds |
show details | |

|
#33
NE 14th Ave
Milton Freewater, OR 97862
|
1,134 sq. feet
|
2 baths 3 beds |
show details | |

|
#34
Martha St
Walla Walla, WA 99362
|
1,516 sq. feet
|
1 baths 3 beds |
show details | |

|
#35
Sunset Dr
Walla Walla, WA 99362
|
2,271 sq. feet
|
3 baths 3 beds |
show details | |

|
#36
Hobson St
Walla Walla, WA 99362
|
2,326 sq. feet
|
3 baths 3 beds |
show details | |

|
#37
Edith Ave
Walla Walla, WA 99362
|
1,568 sq. feet
|
2 baths 3 beds |
show details | |

|
#38
Garrison St
Walla Walla, WA 99362
|
1,260 sq. feet
|
2 baths 3 beds |
show details | |

|
#39
Wellington Ave
Walla Walla, WA 99362
|
1,211 sq. feet
|
2 baths - beds |
show details | |

|
#40
Isaacs Ave, Trlr 25
Walla Walla, WA 99362
|
450 sq. feet
|
1 baths - beds |
show details |
| Photo | Address | Area | Beds / Baths | Price | Details |
|---|---|---|---|---|---|

|
#41
Sunquist Rd
Milton Freewater, OR 97862
|
- sq. feet
|
2 baths 3 beds |
show details | |

|
#42
Mill Creek Rd
Walla Walla, WA 99362
|
1,831 sq. feet
|
1 baths - beds |
show details | |

|
#43
Defence St
Walla Walla, WA 99362
|
806 sq. feet
|
1 baths - beds |
show details | |

|
#44
Melrose St
Walla Walla, WA 99362
|
1,460 sq. feet
|
2 baths - beds |
show details | |

|
#45
Portland Ave
Walla Walla, WA 99362
|
1,454 sq. feet
|
2 baths - beds |
show details | |

|
#46
Herbert Pl
Walla Walla, WA 99362
|
- sq. feet
|
- baths - beds |
show details | |

|
#47
Lewis Cir
Milton Freewater, OR 97862
|
- sq. feet
|
- baths - beds |
show details | |

|
#48
Gloria Ln
Walla Walla, WA 99362
|
- sq. feet
|
- baths - beds |
show details | |

|
#49
Elzora Loop
Milton Freewater, OR 97862
|
- sq. feet
|
- baths - beds |
show details | |

|
Check over 1 million property listings on Foreclosure.com!
|
browse all offers | |||


 | Walla Walla (1 reply) |
| Thinking of Walla Walla as a new home (8 replies) |
| Small towns, rural feel, and crime rates? (46 replies) |
| Walla Walla? (22 replies) |
| Thinking about moving from Pennsylvania to Walla Walla Washington? (18 replies) |
| Walla Walla or Longview? (11 replies) |
Median year apartment built: 1982
Household type by relationship:
Households: 9,919- Male householders: 1,676 (406 living alone), Female householders: 1,712 (569 living alone)
1,800 spouses (1,731 opposite-sex spouses), 262 unmarried partners, (208 opposite-sex unmarried partners), 2,632 children (2,543 natural, 36 adopted, 52 stepchildren), 195 grandchildren, 27 brothers or sisters, 53 parents, 0 foster children, 62 other relatives, 325 non-relatives
- In group quarters: 1,170
Size of family households: 900 2-persons, 586 3-persons, 315 4-persons, 242 5-persons, 68 6-persons, 36 7-or-more-persons.
Size of nonfamily households: 1,029 1-person, 223 2-persons, 40 3-persons, 17 4-persons.
1,437 married couples with children.
522 single-parent households (115 men, 407 women).
83.3% of residents of College Place speak English at home.
12.7% of residents speak Spanish at home (65% speak English very well, 18% speak English well, 11% speak English not well, 6% don't speak English at all).
1.6% of residents speak other Indo-European language at home (70% speak English very well, 9% speak English well, 21% speak English not well).
2.0% of residents speak Asian or Pacific Island language at home (64% speak English very well, 11% speak English well, 25% speak English not well).
0.3% of residents speak other language at home (100% speak English very well).
Foreign born population: 893 (9.0%)
(65.3% of them are naturalized citizens)
| Here: | 5.9 |
| State: | 6.5 |
| Here: | 3.9 |
| State: | 3.9 |
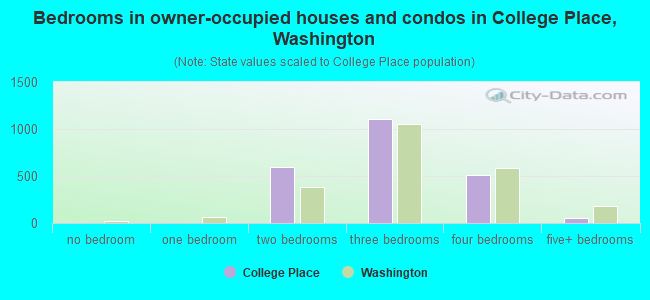
- Bedrooms in owner-occupied houses and condos in College Place, Washington
- 0no bedroom
- 01 bedroom
- 5992 bedrooms
- 1,1063 bedrooms
- 5074 bedrooms
- 565+ bedrooms
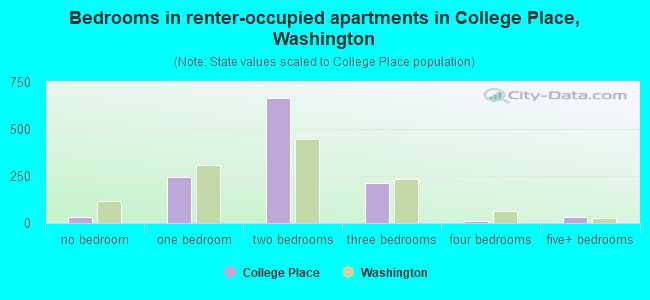
- Bedrooms in renter-occupied apartments in College Place, Washington
- 32no bedroom
- 2441 bedroom
- 6672 bedrooms
- 2113 bedrooms
- 84 bedrooms
- 315+ bedrooms
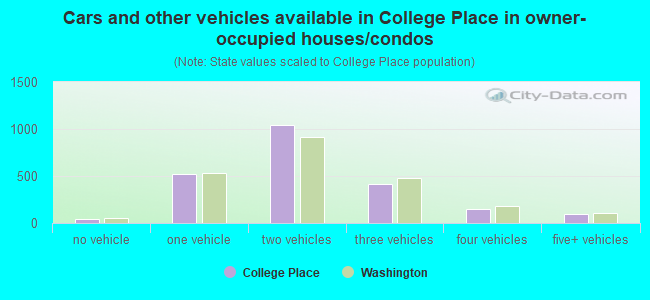
- Cars and other vehicles available in College Place in owner-occupied houses/condos
- 47no vehicle
- 5161 vehicle
- 1,0422 vehicles
- 4153 vehicles
- 1504 vehicles
- 985+ vehicles
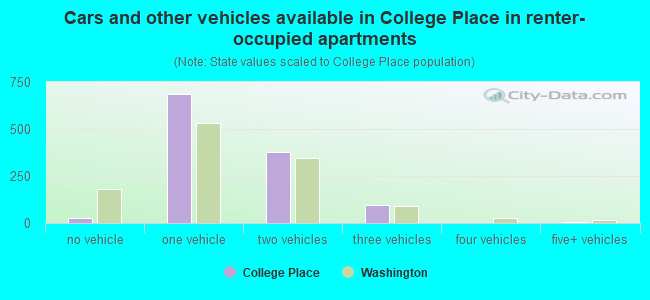
- Cars and other vehicles available in College Place in renter-occupied apartments
- 27no vehicle
- 6851 vehicle
- 3762 vehicles
- 983 vehicles
- 04 vehicles
- 65+ vehicles
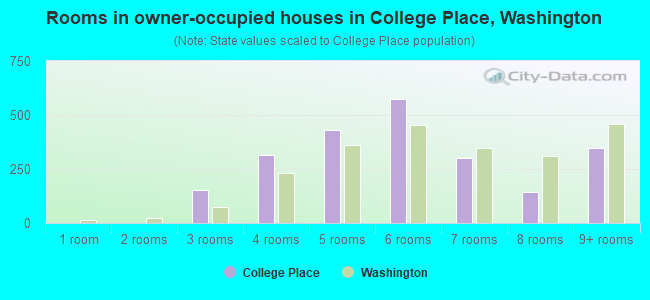
- Rooms in owner-occupied houses in College Place, Washington
- 01 room
- 02 rooms
- 1533 rooms
- 3164 rooms
- 4295 rooms
- 5766 rooms
- 3037 rooms
- 1458 rooms
- 3459+ rooms
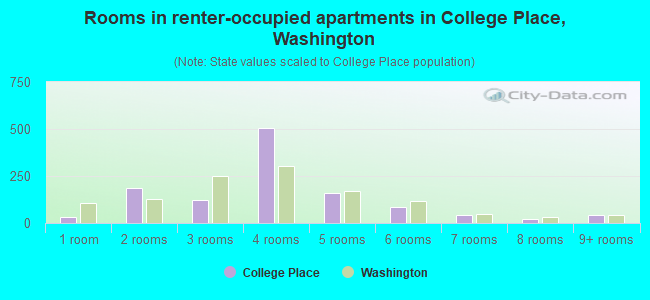
- Rooms in renter-occupied apartments in College Place, Washington
- 321 room
- 1882 rooms
- 1223 rooms
- 5034 rooms
- 1585 rooms
- 836 rooms
- 447 rooms
- 208 rooms
- 429+ rooms
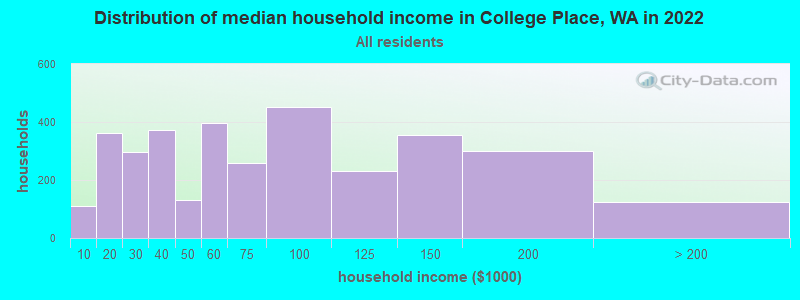
College Place, WA household income distribution

- 110Less than $10,000
- 361$10,000 to $19,999
- 297$20,000 to $29,999
- 371$30,000 to $39,999
- 131$40,000 to $49,999
- 396$50,000 to $59,999
- 258$60,000 to $74,999
- 453$75,000 to $99,999
- 232$100,000 to $124,999
- 356$125,000 to $149,999
- 299$150,000 to $199,999
- 124$200,000 or more
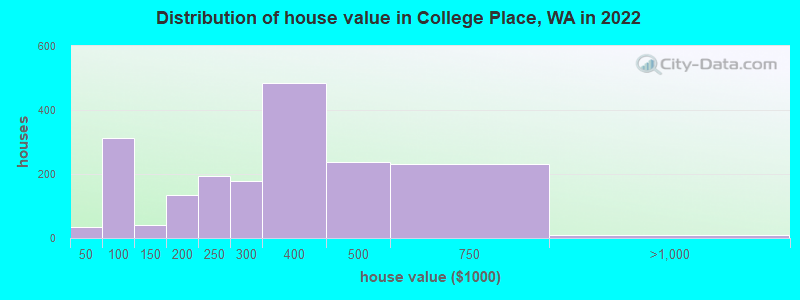
Home value of owner - occupied houses in 2022 in College Place, WA
-
- 23Less than $10,000
- 10$25,000 to $29,999
- 52$50,000 to $59,999
- 165$60,000 to $69,999
- 66$70,000 to $79,999
- 27$90,000 to $99,999
- 8$100,000 to $124,999
- 31$125,000 to $149,999
- 109$150,000 to $174,999
- 24$175,000 to $199,999
- 193$200,000 to $249,999
- 177$250,000 to $299,999
- 482$300,000 to $399,999
- 239$400,000 to $499,999
- 231$500,000 to $749,999
- 10$750,000 to $999,999
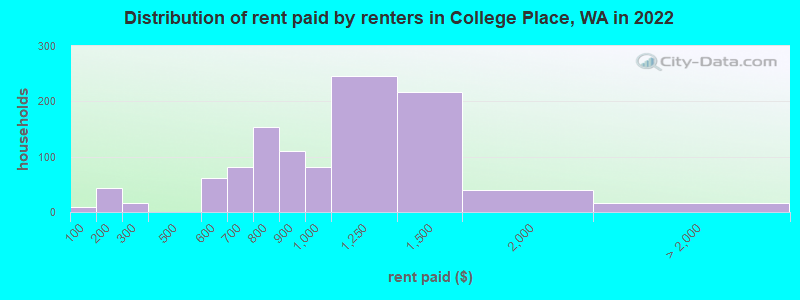
Rent paid by renters in 2022 in College Place, WA
-
- 8Less than $100
- 32$100 to $149
- 11$150 to $199
- 16$200 to $249
- 61$550 to $599
- 80$650 to $699
- 32$700 to $749
- 120$750 to $799
- 109$800 to $899
- 82$900 to $999
- 245$1,000 to $1,249
- 216$1,250 to $1,499
- 39$1,500 to $1,999
- 2$2,000 to $2,499
- 5$2,500 to $2,999
- 7No cash rent
Percentage of workers working in this county: 99.2%
Number of people working at home: 539 (12.4% of all workers)
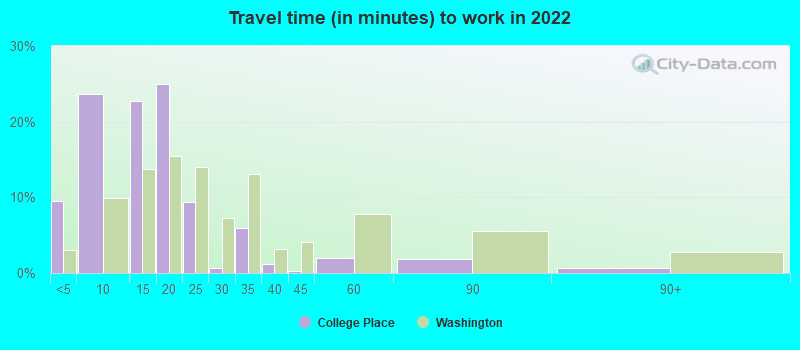
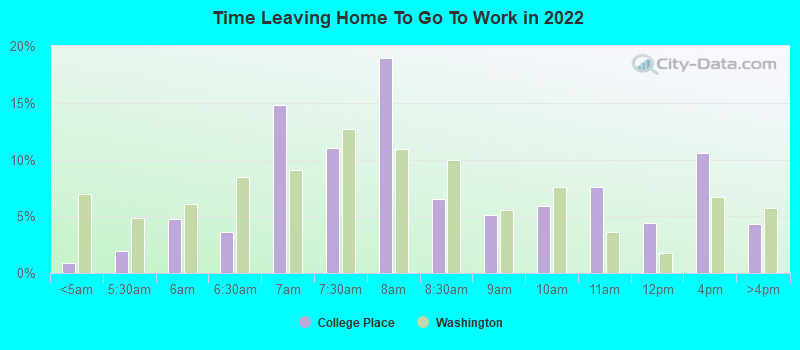
Travel time to work (commute)
- Less than 5 minutes: 251
- 5 to 9 minutes: 1,063
- 10 to 14 minutes: 1,216
- 15 to 19 minutes: 933
- 20 to 24 minutes: 117
- 25 to 29 minutes: 37
- 30 to 34 minutes: 94
- 35 to 39 minutes: 18
- 40 to 44 minutes: 0
- 45 to 59 minutes: 81
- 60 to 89 minutes: 35
- 90 or more minutes: 0
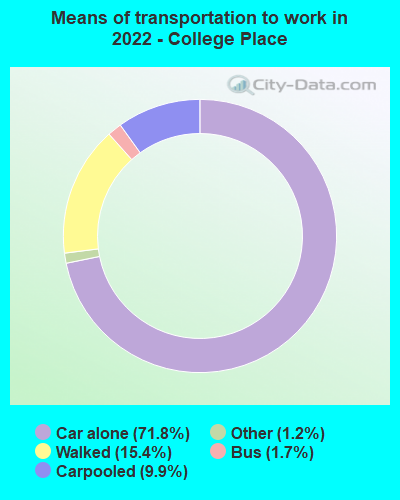
Means of transportation to work:
- Drove a car alone: 1,728 (58.8%)
- Carpooled: 247 (8.4%)
- Bus: 28 (1.0%)
- Taxi: 27 (0.9%)
- Walked: 376 (12.8%)
- Worked at home: 539 (18.4%)
- Unemployment by race in 2022
- Unemployment rate for White non-Hispanic residents
- 5.0%Males
- 4.0%Females
- Unemployment rate for Black residents
- 100.0%Males
- Unemployment rate for two or more race residents
- 1.6%Males
- 6.5%Females
- Unemployment rate for Hispanic or Latino residents
- 5.1%Males
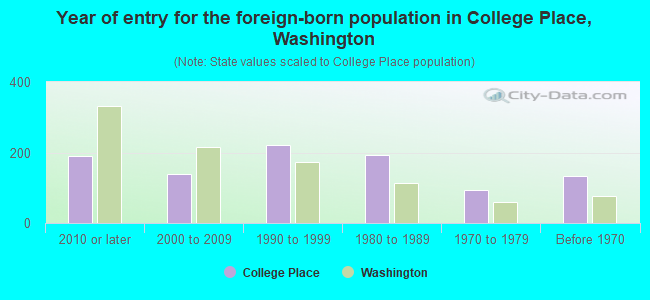
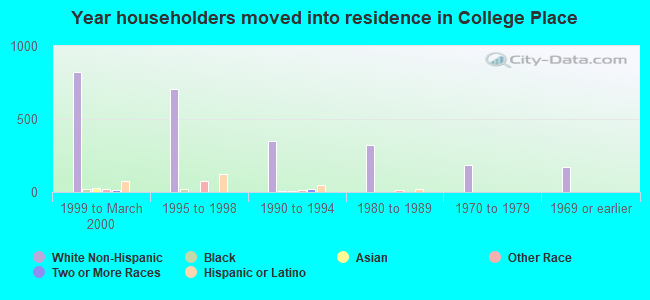
- Year of entry for the foreign-born population in College Place, Washington
- 1892010 or later
- 1392000 to 2009
- 2211990 to 1999
- 1931980 to 1989
- 941970 to 1979
- 133Before 1970
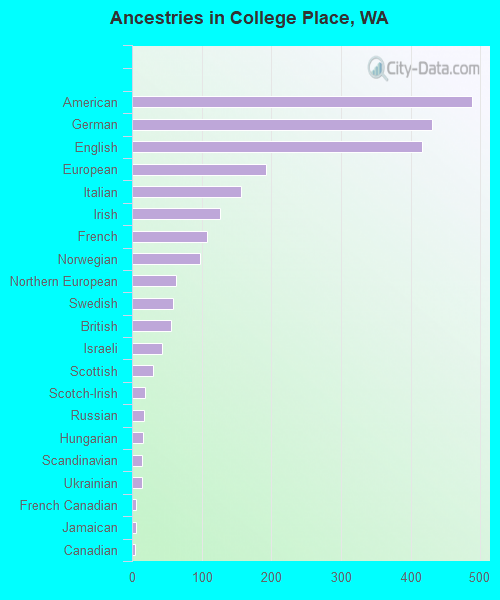
First ancestries reported:
- American: 488 (11.6%)
- German: 431 (10.2%)
- English: 416 (9.9%)
- European: 193 (4.6%)
- Italian: 156 (3.7%)
- Irish: 127 (3.0%)
- French: 108 (2.6%)
- Norwegian: 97 (2.3%)
- Northern European: 63 (1.5%)
- Swedish: 59 (1.4%)
- British: 56 (1.3%)
- Israeli: 43 (1.0%)
- Scottish: 30 (0.7%)
- Scotch-Irish: 19 (0.5%)
- Russian: 17 (0.4%)
- Hungarian: 16 (0.4%)
- Scandinavian: 15 (0.4%)
- Ukrainian: 15 (0.4%)
- French Canadian: 6 (0.1%)
- Jamaican: 6 (0.1%)
- Canadian: 5 (0.1%)
- Pennsylvania German: 4 (0.09%)
Most common places of birth for foreign-born residents (%):
| College Place: | 44.2% (395) |
| Washington: | 21.1% (241,655) |
| College Place: | 10.6% (95) |
| Washington: | 0.2% (2,551) |
| College Place: | 8.7% (78) |
| Washington: | 4.1% (47,238) |
| College Place: | 4.5% (40) |
| Washington: | 0.4% (4,951) |
| College Place: | 3.5% (31) |
| Washington: | 1.5% (17,453) |
| College Place: | 3.2% (29) |
| Washington: | 0.1% (1,357) |
| College Place: | 3.1% (28) |
| Washington: | 0.6% (6,500) |
| College Place: | 3.0% (27) |
| Washington: | 0.1% (1,313) |
| College Place: | 2.2% (20) |
| Washington: | 0.3% (3,414) |
| College Place: | 1.9% (17) |
| Washington: | 4.3% (48,886) |
| College Place: | 1.8% (16) |
| Washington: | 8.9% (101,353) |
| College Place: | 1.6% (14) |
| Washington: | 7.4% (84,470) |
| College Place: | 1.6% (14) |
| Washington: | 1.2% (13,745) |
Place of birth for U.S.-born residents:
- This state: 4,734
- Other state: 4,115
- Northeast: 157
- Midwest: 621
- South: 718
- West: 2,611
85.8% of College Place residents lived in the same house 1 years ago.
Out of people who lived in different houses, 29.5% lived in this county.
Out of people who lived in different counties, 61.2% lived in Washington.
| College Place: | 85.8% |
| State average: | 85.2% |
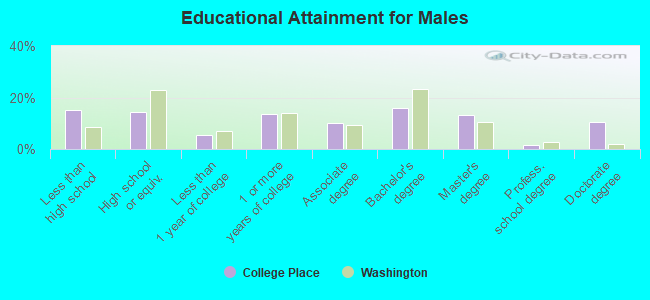
Education attainment for males 25 years and older:
- No schooling: 16
- Nursery to 4th grade: 21
- 5th and 6th grade: 57
- 7th and 8th grade: 22
- 9th grade: 20
- 10th grade: 152
- 11th grade: 22
- 12th grade, no diploma: 130
- High school graduate (or equivalency): 412
- Less than 1 year of college: 159
- Some college more than 1 year, no degree: 389
- Associate degree: 289
- Bachelor's degree: 459
- Master's degree: 384
- Professional school degree: 41
- Doctorate degree: 305
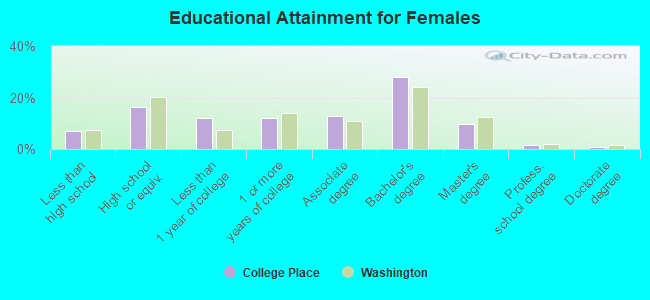
Education attainment for females 25 years and older:
- No schooling: 0
- Nursery to 4th grade: 12
- 5th and 6th grade: 1
- 7th and 8th grade: 0
- 9th grade: 45
- 10th grade: 31
- 11th grade: 9
- 12th grade, no diploma: 102
- High school graduate (or equivalency): 480
- Less than 1 year of college: 353
- Some college more than 1 year, no degree: 355
- Associate degree: 372
- Bachelor's degree: 824
- Master's degree: 282
- Professional school degree: 49
- Doctorate degree: 26
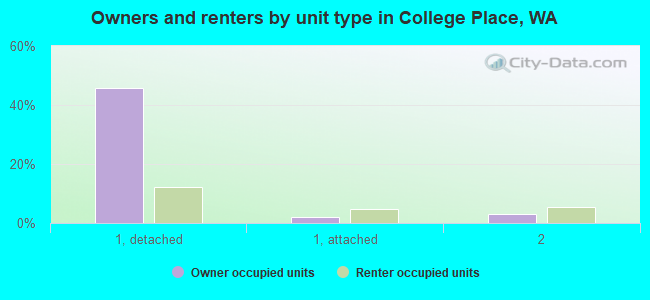
Housing units in structures:
- One, detached: 2,227
- One, attached: 259
- Two: 201
- 3 or 4: 221
- 5 to 9: 250
- 10 to 19: 264
- 20 to 49: 37
- Mobile homes: 338
Median worth of mobile homes: $76,914
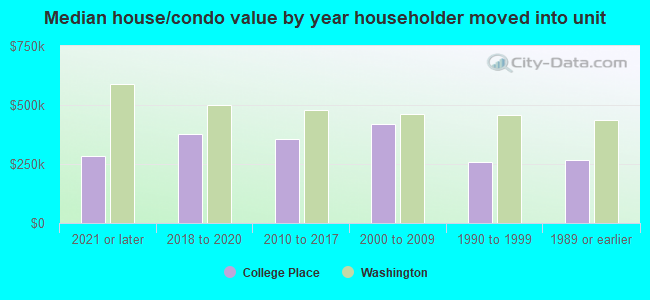
House/condo owner moved in on average 8 years ago
Renter moved in on average 3 years ago
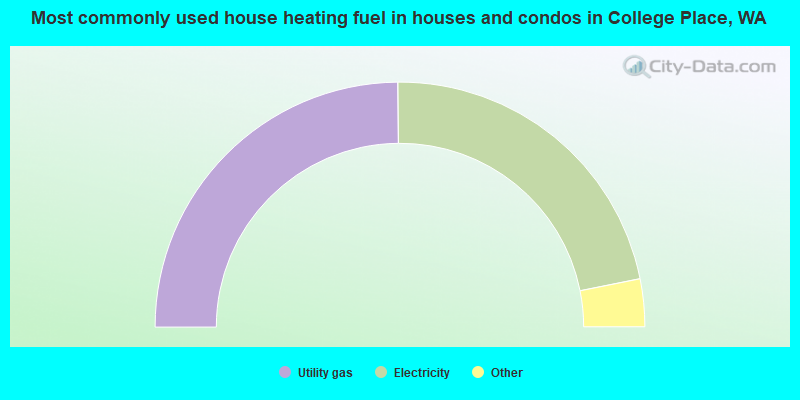
- 49.8%Utility gas
- 44.0%Electricity
- 3.4%Bottled, tank, or LP gas
- 2.8%Wood
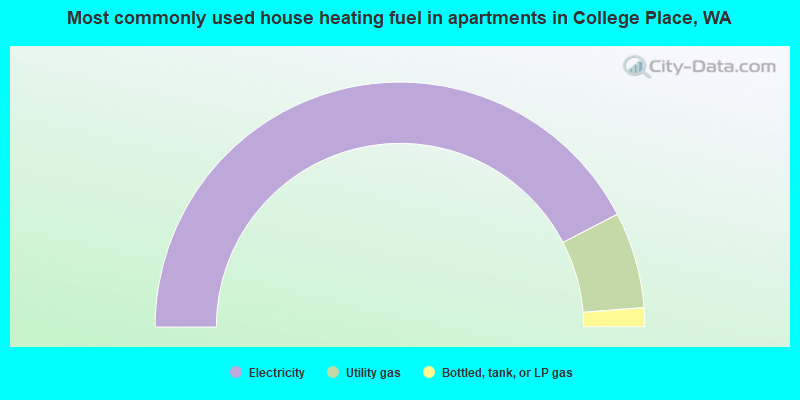
- 84.8%Electricity
- 12.7%Utility gas
- 2.5%Bottled, tank, or LP gas
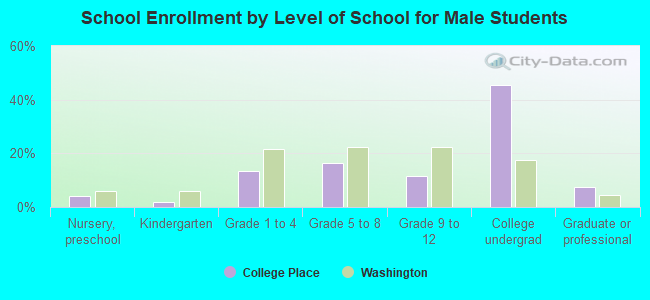
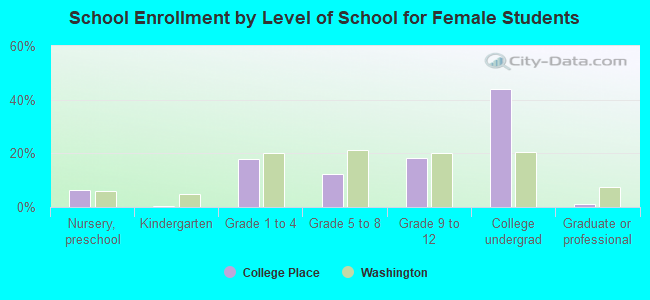
Private vs. public school enrollment:
| Here: | 29.3% |
| Washington: | 12.4% |
| Here: | 17.2% |
| Washington: | 9.2% |
| Here: | 63.6% |
| Washington: | 16.5% |