Cocoa, FL (Florida) Houses and Residents
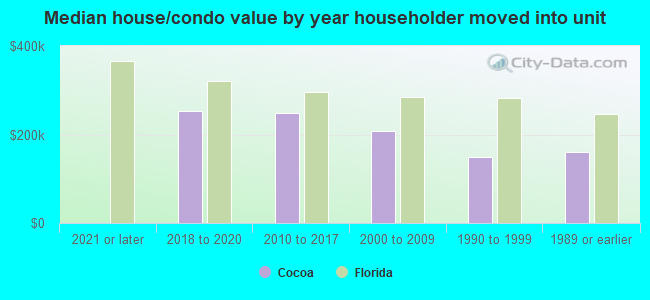
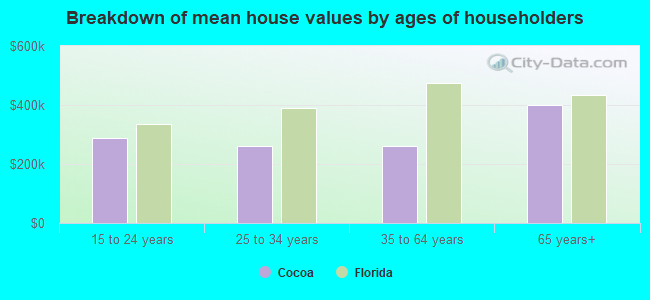
| Cocoa: | $221,343 |
| Florida: | $354,100 |
Total population: 17,419 (Urban population: 16,500, Rural population: 0)
Houses: 10,105 (8,165 occupied: 5,341 owner occupied, 2,875 renter occupied)
| % of renters here: | 35% |
| State: | 33% |
Housing density: 1,355 houses/condos per square mile
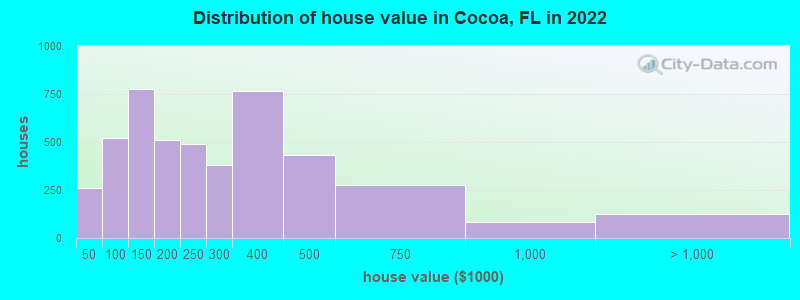
Median price asked for vacant for-sale houses and condos in 2022: $203,802.
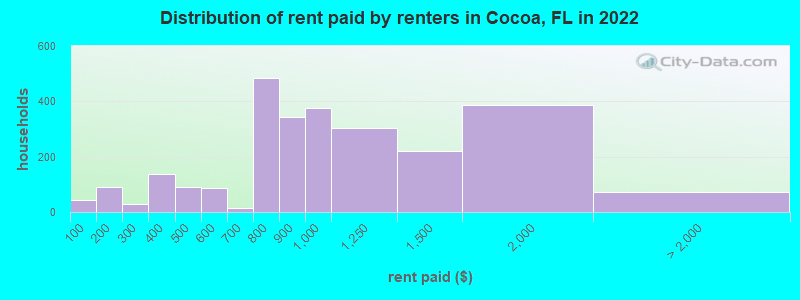
Median contract rent in 2022: $974 (lower quartile is $740, upper quartile is $1,248)
Median rent asked for vacant for-rent units in 2022: $1,082
Median gross rent in Cocoa, FL in 2022: $1,110
Housing units in Cocoa with a mortgage: 3,008 (330 second mortgage, 0 home equity loan, 296 both second mortgage and home equity loan)
Houses without a mortgage: 66
Median household income for houses/condos with a mortgage: $100,125
Median household income for apartments without a mortgage: $61,119
Median monthly housing costs: $1,044
Compare current foreclosures in Cocoa, FL:
| Photo | Address | Area | Beds / Baths | Price | Details |
|---|---|---|---|---|---|

|
#1
Kensington Dr
Cocoa, FL 32922
|
1,388 sq. feet
|
3 baths 3 beds |
$280,000
|
show details |

|
#2
Edison St
Cocoa, FL 32927
|
1,400 sq. feet
|
2 baths 4 beds |
show details | |

|
#3
Macco Rd
Cocoa, FL 32927
|
1,486 sq. feet
|
2 baths 3 beds |
show details | |

|
#4
Burke Ct
Cocoa, FL 32926
|
1,249 sq. feet
|
2 baths 3 beds |
show details | |

|
#5
Ruth St
Cocoa, FL 32926
|
991 sq. feet
|
1 baths 2 beds |
show details | |

|
#6
A Ln
Cocoa, FL 32926
|
825 sq. feet
|
1 baths 3 beds |
show details | |

|
#7
Woods Lake Dr
Cocoa, FL 32926
|
2,526 sq. feet
|
2 baths 3 beds |
show details | |

|
#8
Exeter Dr
Cocoa, FL 32922
|
1,412 sq. feet
|
2 baths 3 beds |
show details | |

|
#9
Ellis Dr
Cocoa, FL 32926
|
1,718 sq. feet
|
2 baths 3 beds |
show details | |

|
#10
Mantes Dr
Cocoa, FL 32926
|
1,297 sq. feet
|
1 baths 3 beds |
show details |
| Photo | Address | Area | Beds / Baths | Price | Details |
|---|---|---|---|---|---|

|
#11
Dolores Ct
Cocoa, FL 32926
|
1,620 sq. feet
|
2 baths 2 beds |
show details | |

|
#12
Seattle St
Cocoa, FL 32927
|
1,183 sq. feet
|
2 baths 3 beds |
show details | |

|
#13
Banos Ave
Cocoa, FL 32927
|
1,634 sq. feet
|
2 baths 3 beds |
show details | |

|
#14
Dryden Cir
Cocoa, FL 32926
|
2,297 sq. feet
|
2 baths 3 beds |
show details | |

|
#15
June Dr
Cocoa, FL 32926
|
1,292 sq. feet
|
2 baths 3 beds |
show details | |

|
#16
Ester Rd
Cocoa, FL 32927
|
1,817 sq. feet
|
2 baths 3 beds |
show details | |

|
#17
Fan Palm Ave
Cocoa, FL 32927
|
2,290 sq. feet
|
3 baths 3 beds |
show details | |

|
#18
Adobe Ave
Cocoa, FL 32927
|
1,385 sq. feet
|
2 baths 3 beds |
show details | |

|
#19
Song Dr
Cocoa, FL 32927
|
1,232 sq. feet
|
2 baths 3 beds |
show details | |

|
#20
Burnham St
Cocoa, FL 32922
|
984 sq. feet
|
1 baths 3 beds |
show details |
| Photo | Address | Area | Beds / Baths | Price | Details |
|---|---|---|---|---|---|

|
#21
Alleghany Ave
Cocoa, FL 32927
|
1,278 sq. feet
|
2 baths 3 beds |
show details | |

|
#22
Friday Rd
Cocoa, FL 32926
|
1,932 sq. feet
|
2 baths 4 beds |
show details | |

|
#23
Delespine Rd
Cocoa, FL 32927
|
960 sq. feet
|
2 baths 2 beds |
show details | |

|
#24
Fairchild Ave
Cocoa, FL 32927
|
1,500 sq. feet
|
2 baths 3 beds |
show details | |

|
#25
Greenville St
Cocoa, FL 32926
|
1,229 sq. feet
|
2 baths 3 beds |
show details | |

|
#26
Rena Ave
Cocoa, FL 32927
|
1,252 sq. feet
|
2 baths 3 beds |
show details | |

|
#27
Corto Rd
Cocoa, FL 32927
|
1,622 sq. feet
|
2 baths 3 beds |
show details | |

|
#28
Nicklaus Cir
Cocoa, FL 32927
|
1,512 sq. feet
|
2 baths 3 beds |
show details | |

|
#29
Belfast Ave
Cocoa, FL 32927
|
1,756 sq. feet
|
2 baths 3 beds |
show details | |

|
#30
Briggs Ave
Cocoa, FL 32927
|
1,438 sq. feet
|
2 baths 3 beds |
show details |
| Photo | Address | Area | Beds / Baths | Price | Details |
|---|---|---|---|---|---|

|
#31
Friday Rd
Cocoa, FL 32926
|
2,273 sq. feet
|
2 baths 3 beds |
show details | |

|
#32
La Marche Dr
Cocoa, FL 32926
|
1,392 sq. feet
|
2 baths 3 beds |
show details | |

|
#33
Friendly St
Cocoa, FL 32927
|
1,526 sq. feet
|
2 baths - beds |
show details | |

|
#34
Canaveral Groves Blvd
Cocoa, FL 32926
|
1,890 sq. feet
|
2 baths - beds |
show details | |

|
#35
N Fiske Blvd Apt 508
Cocoa, FL 32922
|
850 sq. feet
|
- baths - beds |
show details | |

|
#36
Tilkwade Ln
Cocoa, FL 32927
|
- sq. feet
|
- baths - beds |
show details | |

|
#37
Brilliance Cir
Cocoa, FL 32926
|
- sq. feet
|
- baths - beds |
show details | |

|
#38
Talbot Blvd
Cocoa, FL 32926
|
- sq. feet
|
- baths - beds |
show details | |

|
#39
Cressa Cir
Cocoa, FL 32926
|
- sq. feet
|
- baths - beds |
show details | |

|
#40
Lake Superior Dr
Cocoa, FL 32926
|
- sq. feet
|
- baths - beds |
show details |
| Photo | Address | Area | Beds / Baths | Price | Details |
|---|---|---|---|---|---|

|
#41
Olsen Rd
Cocoa, FL 32927
|
- sq. feet
|
- baths - beds |
show details | |

|
#42
Friday Rd
Cocoa, FL 32926
|
- sq. feet
|
- baths - beds |
show details | |

|
#43
Flamingo Dr
Cocoa, FL 32926
|
- sq. feet
|
- baths - beds |
show details | |

|
#44
Sorrento Dr
Cocoa, FL 32922
|
- sq. feet
|
- baths - beds |
show details | |

|
#45
Lake Tahoe Cir
Cocoa, FL 32926
|
- sq. feet
|
- baths - beds |
show details | |

|
#46
Tilkwade Ln
Cocoa, FL 32927
|
- sq. feet
|
- baths - beds |
show details | |

|
#47
Alden Ave
Cocoa, FL 32927
|
- sq. feet
|
- baths - beds |
show details | |

|
#48
Kirkland Dr
Cocoa, FL 32922
|
- sq. feet
|
- baths - beds |
show details | |

|
#49
Brozman Ln
Cocoa, FL 32927
|
1,196 sq. feet
|
- baths - beds |
show details | |

|
Check over 1 million property listings on Foreclosure.com!
|
browse all offers | |||

Latest news about housing in Cocoa, FL collected exclusively by city-data.com from local newspapers, TV, and radio stations

 | What is currently going on with the real estate market in Brevard? (333 replies) |
| Condos in Brevard (22 replies) |
| Cocoa vs Mims....opinions? (13 replies) |
| Considering moving to Cocoa Beach (11 replies) |
| Rentals in Cocoa Beach...or other nearby beaches (2 replies) |
| Why are the houses so cheap in Plantation Oaks Of Brevard? (20 replies) |
Median year apartment built: 1975
Household type by relationship:
Households: 19,696- Male householders: 3,482 (1,473 living alone), Female householders: 4,701 (1,780 living alone)
2,759 spouses (2,745 opposite-sex spouses), 766 unmarried partners, (755 opposite-sex unmarried partners), 4,838 children (4,612 natural, 95 adopted, 131 stepchildren), 1,030 grandchildren, 257 brothers or sisters, 419 parents, 0 foster children, 718 other relatives, 706 non-relatives
- In group quarters: 16
Size of family households: 2,063 2-persons, 1,031 3-persons, 750 4-persons, 323 5-persons, 38 6-persons, 173 7-or-more-persons.
Size of nonfamily households: 3,191 1-person, 594 2-persons, 65 3-persons.
1,040 married couples with children.
1,520 single-parent households (356 men, 1,164 women).
86.2% of residents of Cocoa speak English at home.
10.2% of residents speak Spanish at home (63% speak English very well, 13% speak English well, 6% speak English not well, 19% don't speak English at all).
2.6% of residents speak other Indo-European language at home (78% speak English very well, 22% speak English well).
0.8% of residents speak Asian or Pacific Island language at home (60% speak English very well, 19% speak English well, 16% speak English not well, 5% don't speak English at all).
Foreign born population: 1,713 (8.7%)
(60.0% of them are naturalized citizens)
| Here: | 5.7 |
| State: | 5.9 |
| Here: | 4.1 |
| State: | 4.2 |
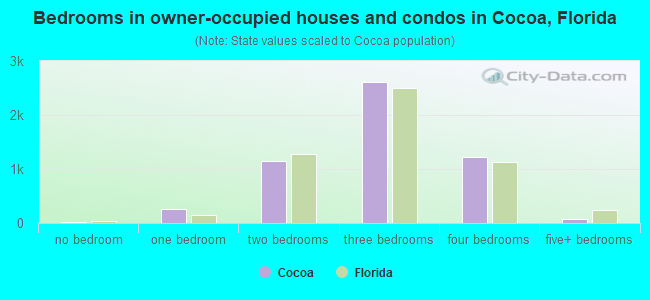
- Bedrooms in owner-occupied houses and condos in Cocoa, Florida
- 24no bedroom
- 2591 bedroom
- 1,1392 bedrooms
- 2,6183 bedrooms
- 1,2304 bedrooms
- 725+ bedrooms
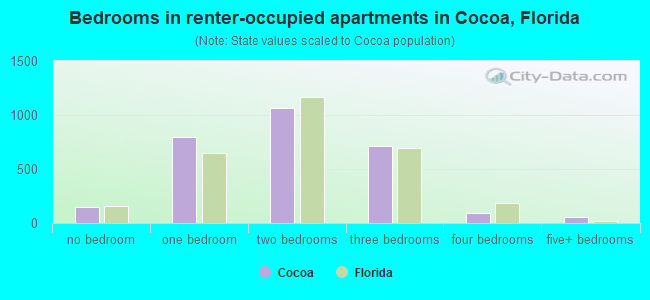
- Bedrooms in renter-occupied apartments in Cocoa, Florida
- 144no bedroom
- 7991 bedroom
- 1,0632 bedrooms
- 7153 bedrooms
- 964 bedrooms
- 575+ bedrooms
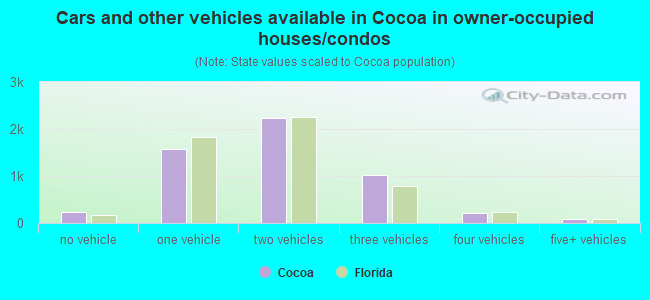
- Cars and other vehicles available in Cocoa in owner-occupied houses/condos
- 234no vehicle
- 1,5831 vehicle
- 2,2252 vehicles
- 1,0143 vehicles
- 2044 vehicles
- 815+ vehicles
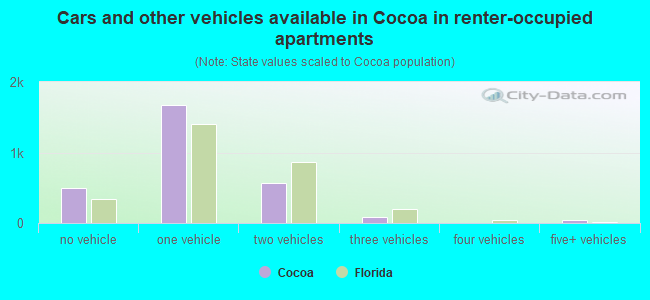
- Cars and other vehicles available in Cocoa in renter-occupied apartments
- 495no vehicle
- 1,6801 vehicle
- 5692 vehicles
- 853 vehicles
- 04 vehicles
- 475+ vehicles
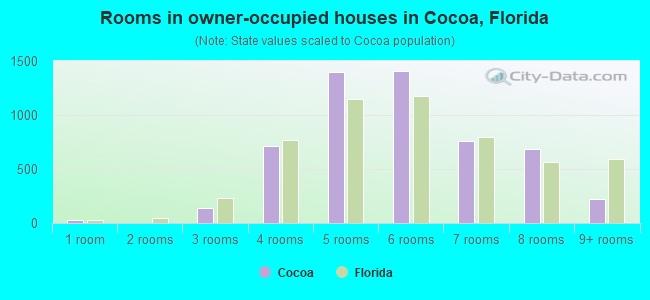
- Rooms in owner-occupied houses in Cocoa, Florida
- 241 room
- 02 rooms
- 1383 rooms
- 7104 rooms
- 1,3975 rooms
- 1,4076 rooms
- 7587 rooms
- 6868 rooms
- 2229+ rooms
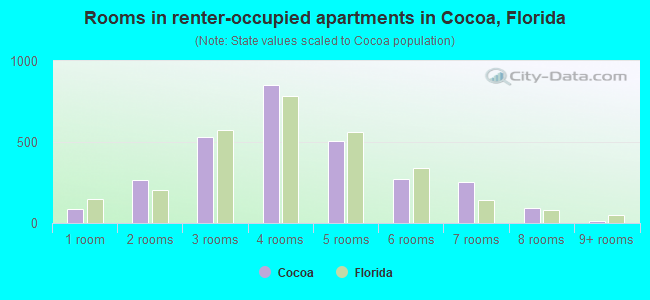
- Rooms in renter-occupied apartments in Cocoa, Florida
- 861 room
- 2662 rooms
- 5333 rooms
- 8494 rooms
- 5075 rooms
- 2746 rooms
- 2527 rooms
- 938 rooms
- 159+ rooms
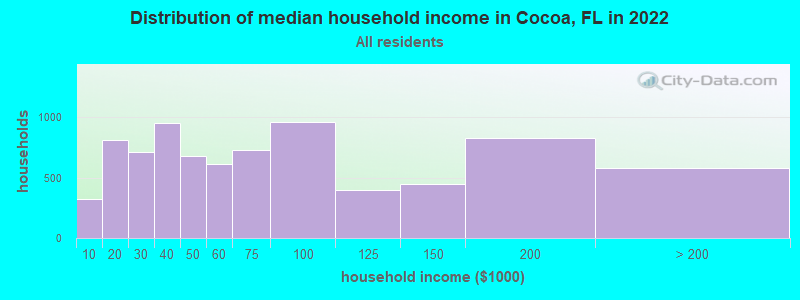
Cocoa, FL household income distribution

- 320Less than $10,000
- 815$10,000 to $19,999
- 710$20,000 to $29,999
- 955$30,000 to $39,999
- 681$40,000 to $49,999
- 613$50,000 to $59,999
- 731$60,000 to $74,999
- 962$75,000 to $99,999
- 394$100,000 to $124,999
- 448$125,000 to $149,999
- 830$150,000 to $199,999
- 583$200,000 or more
Home value of owner - occupied houses in 2022 in Cocoa, FL
-
- 58Less than $10,000
- 31$10,000 to $14,999
- 114$25,000 to $29,999
- 9$30,000 to $34,999
- 9$35,000 to $39,999
- 36$40,000 to $49,999
- 84$50,000 to $59,999
- 142$60,000 to $69,999
- 23$70,000 to $79,999
- 112$80,000 to $89,999
- 120$90,000 to $99,999
- 526$100,000 to $124,999
- 247$125,000 to $149,999
- 275$150,000 to $174,999
- 234$175,000 to $199,999
- 488$200,000 to $249,999
- 377$250,000 to $299,999
- 766$300,000 to $399,999
- 431$400,000 to $499,999
- 276$500,000 to $749,999
- 84$750,000 to $999,999
- 89$1,000,000 to $1,499,999
- 34$2,000,000 or more
Rent paid by renters in 2022 in Cocoa, FL
-
- 42Less than $100
- 25$100 to $149
- 65$150 to $199
- 13$200 to $249
- 16$250 to $299
- 17$300 to $349
- 121$350 to $399
- 78$400 to $449
- 13$450 to $499
- 69$500 to $549
- 15$550 to $599
- 4$600 to $649
- 8$650 to $699
- 181$700 to $749
- 302$750 to $799
- 341$800 to $899
- 376$900 to $999
- 303$1,000 to $1,249
- 220$1,250 to $1,499
- 385$1,500 to $1,999
- 73No cash rent
Percentage of workers working in this county: 94.3%
Number of people working at home: 1,017 (10.8% of all workers)
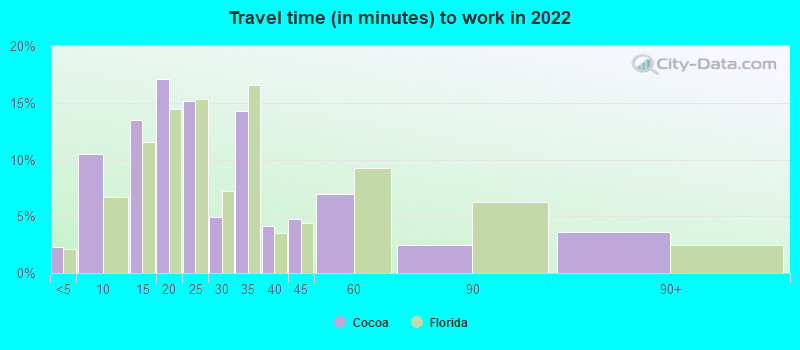
Travel time to work (commute)
- Less than 5 minutes: 160
- 5 to 9 minutes: 636
- 10 to 14 minutes: 674
- 15 to 19 minutes: 1,464
- 20 to 24 minutes: 1,237
- 25 to 29 minutes: 1,092
- 30 to 34 minutes: 1,318
- 35 to 39 minutes: 313
- 40 to 44 minutes: 183
- 45 to 59 minutes: 303
- 60 to 89 minutes: 642
- 90 or more minutes: 191
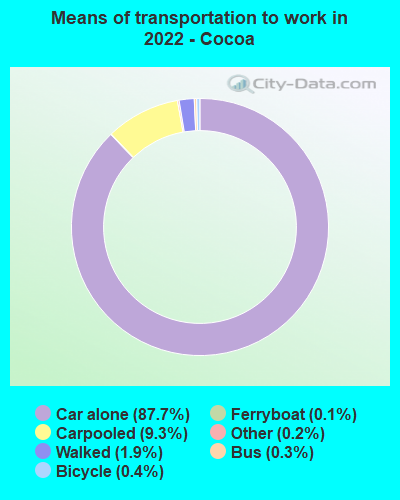
Means of transportation to work:
- Drove a car alone: 7,933 (75.9%)
- Carpooled: 871 (8.3%)
- Bus: 50 (0.5%)
- Ferryboat: 9 (0.1%)
- Taxi: 27 (0.3%)
- Bicycle: 36 (0.3%)
- Walked: 193 (1.8%)
- Worked at home: 1,017 (9.7%)
- Unemployment by race in 2022
- Unemployment rate for White non-Hispanic residents
- 3.3%Males
- 8.4%Females
- Unemployment rate for Black residents
- 5.0%Males
- 3.4%Females
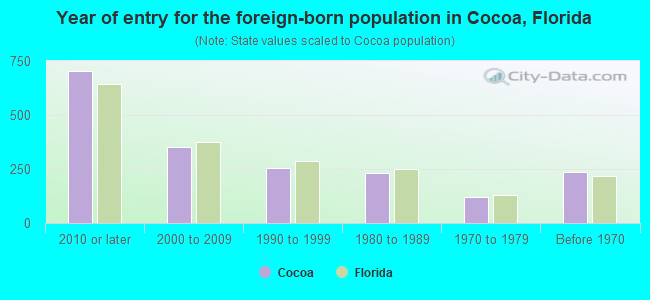
- Year of entry for the foreign-born population in Cocoa, Florida
- 7042010 or later
- 3502000 to 2009
- 2541990 to 1999
- 2331980 to 1989
- 1221970 to 1979
- 238Before 1970
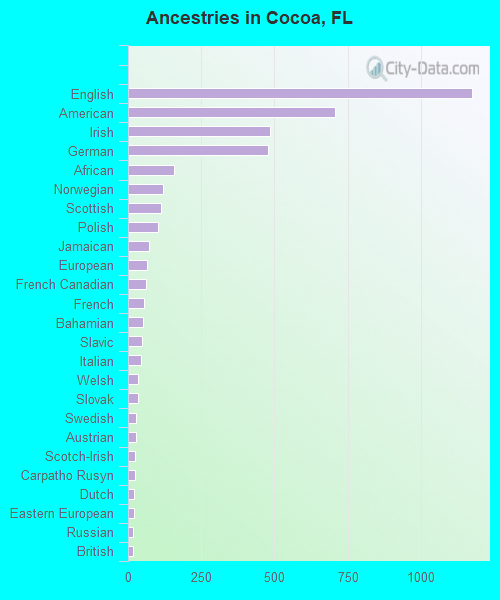
First ancestries reported:
- English: 1,174 (12.2%)
- American: 708 (7.3%)
- Irish: 486 (5.0%)
- German: 478 (5.0%)
- African: 157 (1.6%)
- Norwegian: 119 (1.2%)
- Scottish: 114 (1.2%)
- Polish: 101 (1.0%)
- Jamaican: 72 (0.7%)
- European: 64 (0.7%)
- French Canadian: 63 (0.7%)
- French: 55 (0.6%)
- Bahamian: 50 (0.5%)
- Slavic: 49 (0.5%)
- Italian: 46 (0.5%)
- Welsh: 34 (0.4%)
- Slovak: 33 (0.3%)
- Swedish: 28 (0.3%)
- Austrian: 27 (0.3%)
- Scotch-Irish: 25 (0.3%)
- Carpatho Rusyn: 23 (0.2%)
- Dutch: 22 (0.2%)
- Eastern European: 21 (0.2%)
- Russian: 17 (0.2%)
- British: 16 (0.2%)
- Portuguese: 8 (0.08%)
- Scandinavian: 7 (0.07%)
- Canadian: 6 (0.06%)
- Finnish: 4 (0.04%)
- Haitian: 4 (0.04%)
Most common places of birth for foreign-born residents (%):
| Cocoa: | 24.1% (388) |
| Florida: | 22.0% (1,006,576) |
| Cocoa: | 13.5% (218) |
| Florida: | 2.1% (97,632) |
| Cocoa: | 11.3% (182) |
| Florida: | 5.6% (257,152) |
| Cocoa: | 10.9% (175) |
| Florida: | 5.7% (262,042) |
| Cocoa: | 6.2% (100) |
| Florida: | 1.8% (84,403) |
| Cocoa: | 5.4% (87) |
| Florida: | 2.4% (109,132) |
| Cocoa: | 5.2% (84) |
| Florida: | 1.2% (54,272) |
| Cocoa: | 5.1% (82) |
| Florida: | 5.0% (227,319) |
| Cocoa: | 4.1% (66) |
| Florida: | 0.6% (25,219) |
| Cocoa: | 3.0% (49) |
| Florida: | 2.1% (94,349) |
| Cocoa: | 2.5% (41) |
| Florida: | 2.3% (107,160) |
Place of birth for U.S.-born residents:
- This state: 8,374
- Other state: 9,015
- Northeast: 2,697
- Midwest: 2,118
- South: 3,024
- West: 1,123
89.5% of Cocoa residents lived in the same house 1 years ago.
Out of people who lived in different houses, 32.8% lived in this county.
Out of people who lived in different counties, 25.6% lived in Florida.
| Cocoa: | 89.5% |
| State average: | 86.3% |
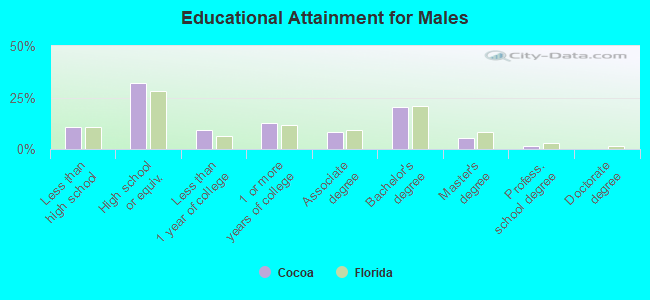
Education attainment for males 25 years and older:
- No schooling: 136
- Nursery to 4th grade: 0
- 5th and 6th grade: 0
- 7th and 8th grade: 58
- 9th grade: 134
- 10th grade: 133
- 11th grade: 121
- 12th grade, no diploma: 130
- High school graduate (or equivalency): 2,109
- Less than 1 year of college: 603
- Some college more than 1 year, no degree: 848
- Associate degree: 535
- Bachelor's degree: 1,348
- Master's degree: 359
- Professional school degree: 106
- Doctorate degree: 12
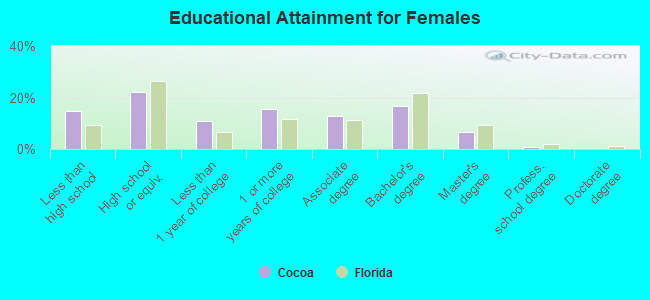
Education attainment for females 25 years and older:
- No schooling: 111
- Nursery to 4th grade: 0
- 5th and 6th grade: 300
- 7th and 8th grade: 4
- 9th grade: 20
- 10th grade: 116
- 11th grade: 140
- 12th grade, no diploma: 480
- High school graduate (or equivalency): 1,770
- Less than 1 year of college: 869
- Some college more than 1 year, no degree: 1,240
- Associate degree: 1,039
- Bachelor's degree: 1,351
- Master's degree: 523
- Professional school degree: 48
- Doctorate degree: 13
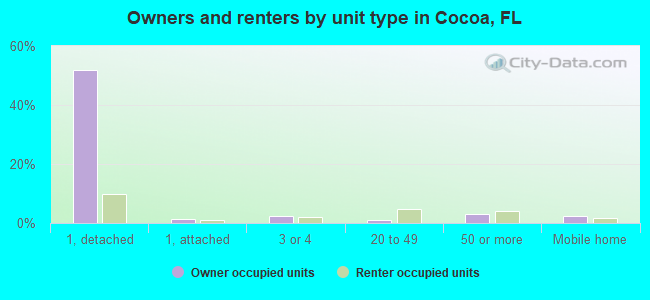
Housing units in structures:
- One, detached: 5,945
- One, attached: 364
- Two: 195
- 3 or 4: 498
- 5 to 9: 864
- 10 to 19: 481
- 20 to 49: 621
- 50 or more: 614
- Mobile homes: 519
Housing units lacking complete kitchen facilities in 2022: 1.0%
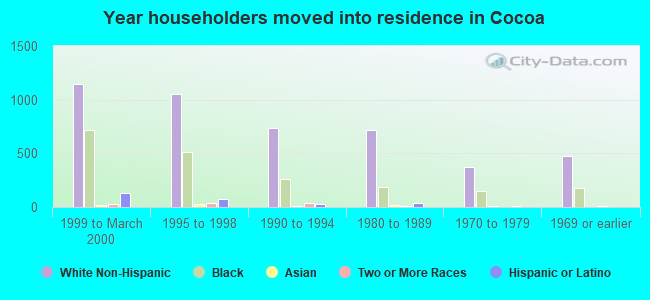
House/condo owner moved in on average 11 years ago
Renter moved in on average 4 years ago
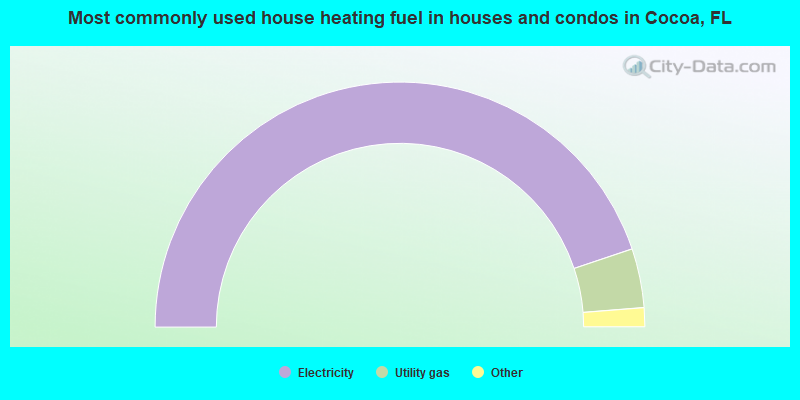
- 89.7%Electricity
- 7.8%Utility gas
- 1.1%Solar energy
- 0.6%Wood
- 0.5%Bottled, tank, or LP gas
- 0.2%Other fuel

- 94.1%Electricity
- 3.5%Utility gas
- 1.4%No fuel used
- 0.9%Bottled, tank, or LP gas
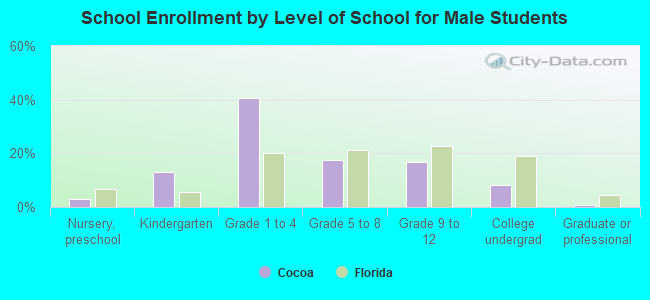
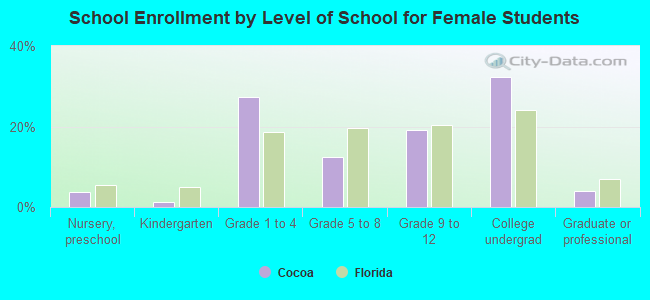
Private vs. public school enrollment:
| Here: | 14.6% |
| Florida: | 15.8% |
| Here: | 0.0% |
| Florida: | 12.9% |
| Here: | 32.4% |
| Florida: | 23.6% |