Cockeysville, MD (Maryland) Houses and Residents
| Cockeysville: | $404,683 |
| Maryland: | $398,100 |
Mean price in 2022:
Detached houses: $450,592
Here: $450,592 State: $526,819 Townhouses or other attached units: $343,332
Here: $343,332 State: $328,305 In 5-or-more-unit structures: $246,648
Here: $246,648 State: $350,378
Total population: 20,776 (Urban population: 18,850, Rural population: 721 (all nonfarm))
Houses: 10,857 (10,353 occupied: 3,749 owner occupied, 6,835 renter occupied)
| % of renters here: | 65% |
| State: | 32% |
Housing density: 962 houses/condos per square mile
Median price asked for vacant for-sale houses and condos in 2022: $837,397.
Median contract rent in 2022: $1,293 (lower quartile is $1,071, upper quartile is $1,517)
Median rent asked for vacant for-rent units in 2022: $1,198
Median gross rent in Cockeysville, MD in 2022: $1,404
Housing units in Cockeysville with a mortgage: 2,443 (393 second mortgage, 0 home equity loan, 200 both second mortgage and home equity loan)
Houses without a mortgage: 7
Median household income for houses/condos with a mortgage: $164,304
Median household income for apartments without a mortgage: $101,167
Median monthly housing costs: $1,413
Compare current foreclosures in Cockeysville, MD:
| Photo | Address | Area | Beds / Baths | Price | Details |
|---|---|---|---|---|---|

|
#1
Labrador Ln
Cockeysville, MD 21030
|
2,104 sq. feet
|
2 baths - beds |
show details | |

|
#2
Cuba Rd
Cockeysville, MD 21030
|
1,954 sq. feet
|
1 baths - beds |
show details | |

|
#3
Dulaney Hills Ct
Cockeysville, MD 21030
|
2,320 sq. feet
|
2 baths - beds |
show details | |

|
#4
Cherrywood Ct
Cockeysville, MD 21030
|
1,920 sq. feet
|
3 baths - beds |
show details | |

|
#5
Warren Rd
Cockeysville, MD 21030
|
1,242 sq. feet
|
1 baths - beds |
show details | |

|
#6
Spring Glen Ct
Cockeysville, MD 21030
|
1,880 sq. feet
|
2 baths - beds |
show details | |

|
#7
Royal Mews Rd
Cockeysville, MD 21030
|
2,208 sq. feet
|
2 baths - beds |
show details | |

|
#8
Hunters Run Dr
Cockeysville, MD 21030
|
1,800 sq. feet
|
3 baths - beds |
show details | |

|
#9
Warwick Mill Ct
Cockeysville, MD 21030
|
1,860 sq. feet
|
2 baths - beds |
show details | |

|
#10
Grand Valley Ct
Cockeysville, MD 21030
|
1,860 sq. feet
|
2 baths - beds |
show details |
| Photo | Address | Area | Beds / Baths | Price | Details |
|---|---|---|---|---|---|

|
#11
Winterberry Ct
Cockeysville, MD 21030
|
2,062 sq. feet
|
3 baths - beds |
show details | |

|
#12
Warwick Mill Ct
Cockeysville, MD 21030
|
1,860 sq. feet
|
3 baths - beds |
show details | |

|
#13
Powers Ave
Cockeysville, MD 21030
|
1,512 sq. feet
|
1 baths - beds |
show details | |

|
#14
Valley Lake Pl Apt J
Cockeysville, MD 21030
|
- sq. feet
|
- baths - beds |
show details | |

|
#15
Knollcrest Place, Apt E
Cockeysville, MD 21030
|
- sq. feet
|
- baths - beds |
show details | |

|
#16
Warren Lodge Ct Apt B
Cockeysville, MD 21030
|
- sq. feet
|
- baths - beds |
show details | |

|
#17
Gelding Dr Apt A
Cockeysville, MD 21030
|
- sq. feet
|
- baths - beds |
show details | |

|
#18
Saint David Ct
Cockeysville, MD 21030
|
- sq. feet
|
- baths - beds |
show details | |

|
#19
Barretts Delight Dr Apt C
Cockeysville, MD 21030
|
- sq. feet
|
- baths - beds |
show details | |

|
#20
Barretts Delight Dr Apt H
Cockeysville, MD 21030
|
- sq. feet
|
- baths - beds |
show details |
| Photo | Address | Area | Beds / Baths | Price | Details |
|---|---|---|---|---|---|

|
#21
Beaver Dam Rd
Cockeysville, MD 21030
|
- sq. feet
|
- baths - beds |
show details | |

|
#22
Limestone Valley Dr Apt B
Cockeysville, MD 21030
|
- sq. feet
|
- baths - beds |
show details | |

|
#23
Warren Lodge Ct Apt 1d
Cockeysville, MD 21030
|
898 sq. feet
|
- baths - beds |
show details | |

|
#24
Meadow Grass Ct Apt C
Cockeysville, MD 21030
|
- sq. feet
|
- baths - beds |
show details | |

|
#25
Hazy Dawn Ct Apt N
Cockeysville, MD 21030
|
- sq. feet
|
- baths - beds |
show details | |

|
#26
Windy Falls Way
Cockeysville, MD 21030
|
- sq. feet
|
- baths - beds |
show details | |

|
#27
Saint David Ct Apt 103
Cockeysville, MD 21030
|
- sq. feet
|
- baths - beds |
show details | |

|
#28
Snowdrift Ct Apt E
Cockeysville, MD 21030
|
- sq. feet
|
- baths - beds |
show details | |

|
#29
Crosswind Pl
Cockeysville, MD 21030
|
- sq. feet
|
- baths - beds |
show details | |

|
#30
Sugar Plum Ct Apt F
Cockeysville, MD 21030
|
- sq. feet
|
- baths - beds |
show details |
| Photo | Address | Area | Beds / Baths | Price | Details |
|---|---|---|---|---|---|

|
#31
Queensbridge Ct Apt K
Cockeysville, MD 21030
|
- sq. feet
|
- baths - beds |
show details | |

|
#32
Beaver Dam Rd # 1214
Cockeysville, MD 21030
|
- sq. feet
|
- baths - beds |
show details | |

|
#33
Limestone Valley Dr Apt B
Cockeysville, MD 21030
|
- sq. feet
|
- baths - beds |
show details | |

|
#34
Misty Lynn Cir
Cockeysville, MD 21030
|
- sq. feet
|
- baths - beds |
show details | |

|
#35
Cranbrook Hills Pl Apt I
Cockeysville, MD 21030
|
- sq. feet
|
- baths - beds |
show details | |

|
#36
Hillgreen Cir Apt H
Cockeysville, MD 21030
|
- sq. feet
|
- baths - beds |
show details | |

|
Check over 1 million property listings on Foreclosure.com!
|
browse all offers | |||

Latest news about housing in Cockeysville, MD collected exclusively by city-data.com from local newspapers, TV, and radio stations


Median year apartment built: 1978
Household type by relationship:
Households: 23,120- Male householders: 5,547 (2,121 living alone), Female householders: 4,701 (1,593 living alone)
3,551 spouses (3,520 opposite-sex spouses), 1,001 unmarried partners, (880 opposite-sex unmarried partners), 5,308 children (5,081 natural, 131 adopted, 95 stepchildren), 214 grandchildren, 406 brothers or sisters, 358 parents, 0 foster children, 136 other relatives, 1,312 non-relatives
- In group quarters: 580
Size of family households: 2,658 2-persons, 1,437 3-persons, 905 4-persons, 399 5-persons, 52 6-persons, 46 7-or-more-persons.
Size of nonfamily households: 3,869 1-person, 1,157 2-persons, 69 3-persons, 17 4-persons, 27 7-or-more-persons.
2,293 married couples with children.
1,348 single-parent households (283 men, 1,065 women).
79.7% of residents of Cockeysville speak English at home.
6.7% of residents speak Spanish at home (52% speak English very well, 6% speak English well, 30% speak English not well, 12% don't speak English at all).
6.6% of residents speak other Indo-European language at home (53% speak English very well, 27% speak English well, 19% speak English not well, 2% don't speak English at all).
5.3% of residents speak Asian or Pacific Island language at home (63% speak English very well, 17% speak English well, 19% speak English not well, 1% don't speak English at all).
1.3% of residents speak other language at home (82% speak English very well, 16% speak English well, 2% speak English not well).
Foreign born population: 4,255 (18.4%)
(47.1% of them are naturalized citizens)
| Here: | 7.8 |
| State: | 7.3 |
| Here: | 3.6 |
| State: | 4.2 |

- Bedrooms in owner-occupied houses and condos in Cockeysville, Maryland
- 4no bedroom
- 1291 bedroom
- 4132 bedrooms
- 1,6643 bedrooms
- 1,0464 bedrooms
- 4935+ bedrooms

- Bedrooms in renter-occupied apartments in Cockeysville, Maryland
- 489no bedroom
- 2,5741 bedroom
- 3,0582 bedrooms
- 5303 bedrooms
- 1554 bedrooms
- 305+ bedrooms

- Cars and other vehicles available in Cockeysville in owner-occupied houses/condos
- 46no vehicle
- 1,1271 vehicle
- 1,8112 vehicles
- 5323 vehicles
- 1474 vehicles
- 865+ vehicles

- Cars and other vehicles available in Cockeysville in renter-occupied apartments
- 713no vehicle
- 3,7571 vehicle
- 2,0362 vehicles
- 2763 vehicles
- 284 vehicles
- 265+ vehicles

- Rooms in owner-occupied houses in Cockeysville, Maryland
- 41 room
- 422 rooms
- 643 rooms
- 2784 rooms
- 3015 rooms
- 4086 rooms
- 4727 rooms
- 6898 rooms
- 1,4909+ rooms

- Rooms in renter-occupied apartments in Cockeysville, Maryland
- 4891 room
- 3102 rooms
- 2,1223 rooms
- 2,0314 rooms
- 1,0375 rooms
- 2986 rooms
- 3057 rooms
- 698 rooms
- 1759+ rooms


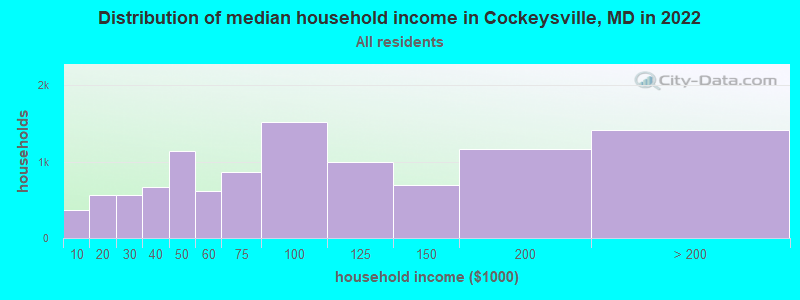
Cockeysville, MD household income distribution

- 362Less than $10,000
- 564$10,000 to $19,999
- 559$20,000 to $29,999
- 664$30,000 to $39,999
- 1,136$40,000 to $49,999
- 613$50,000 to $59,999
- 861$60,000 to $74,999
- 1,519$75,000 to $99,999
- 993$100,000 to $124,999
- 691$125,000 to $149,999
- 1,165$150,000 to $199,999
- 1,411$200,000 or more
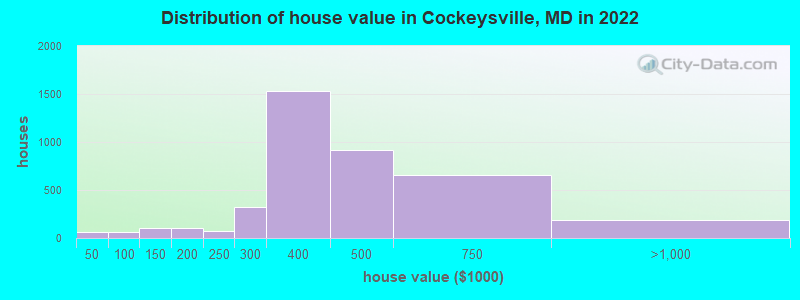
Home value of owner - occupied houses in 2022 in Cockeysville, MD
-
- 13$25,000 to $29,999
- 47$40,000 to $49,999
- 10$50,000 to $59,999
- 21$100,000 to $124,999
- 86$125,000 to $149,999
- 63$150,000 to $174,999
- 37$175,000 to $199,999
- 68$200,000 to $249,999
- 323$250,000 to $299,999
- 1,535$300,000 to $399,999
- 916$400,000 to $499,999
- 653$500,000 to $749,999
- 186$750,000 to $999,999
Rent paid by renters in 2022 in Cockeysville, MD
-
- 29$250 to $299
- 35$550 to $599
- 9$650 to $699
- 4$700 to $749
- 35$750 to $799
- 295$800 to $899
- 461$900 to $999
- 1,887$1,000 to $1,249
- 1,951$1,250 to $1,499
- 1,143$1,500 to $1,999
- 303$2,000 to $2,499
- 85$2,500 to $2,999
- 7$3,000 to $3,499
- 113$3,500 or more
- 82No cash rent


Percentage of workers working in this county: 73.2%
Number of people working at home: 2,053 (15.5% of all workers)
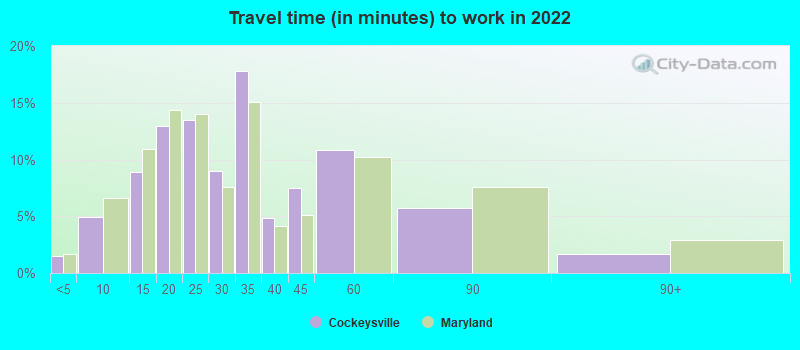
Travel time to work (commute)
- Less than 5 minutes: 383
- 5 to 9 minutes: 862
- 10 to 14 minutes: 1,789
- 15 to 19 minutes: 2,175
- 20 to 24 minutes: 1,249
- 25 to 29 minutes: 654
- 30 to 34 minutes: 1,702
- 35 to 39 minutes: 528
- 40 to 44 minutes: 537
- 45 to 59 minutes: 849
- 60 to 89 minutes: 275
- 90 or more minutes: 197

Means of transportation to work:
- Drove a car alone: 25,040 (79.7%)
- Carpooled: 2,064 (6.6%)
- Bus: 200 (0.6%)
- Subway or elevated rail: 178 (0.6%)
- Long-distance train or commuter rail: 113 (0.4%)
- Light rail, streetcar or trolley: 78 (0.2%)
- Taxi: 238 (0.8%)
- Bicycle: 31 (0.1%)
- Walked: 352 (1.1%)
- Worked at home: 2,053 (6.5%)

- Unemployment by race in 2022
- Unemployment rate for White non-Hispanic residents
- 3.0%Males
- 1.7%Females
- Unemployment rate for Black residents
- 13.9%Males
- 2.9%Females
- Unemployment rate for Asian residents
- 13.8%Males
- 12.5%Females
- Unemployment rate for two or more race residents
- 1.6%Females
- Unemployment rate for Hispanic or Latino residents
- 1.8%Males

- Year of entry for the foreign-born population in Cockeysville, Maryland
- 2,0782010 or later
- 1,0662000 to 2009
- 5761990 to 1999
- 6281980 to 1989
- 3531970 to 1979
- 228Before 1970

First ancestries reported:
- German: 1,011 (7.8%)
- Irish: 833 (6.4%)
- American: 528 (4.1%)
- Italian: 514 (4.0%)
- English: 397 (3.1%)
- African: 390 (3.0%)
- European: 361 (2.8%)
- Afghan: 321 (2.5%)
- Polish: 205 (1.6%)
- Greek: 122 (0.9%)
- Scottish: 120 (0.9%)
- Egyptian: 119 (0.9%)
- Russian: 114 (0.9%)
- Jamaican: 90 (0.7%)
- Iranian: 89 (0.7%)
- Nigerian: 80 (0.6%)
- Moroccan: 63 (0.5%)
- Haitian: 58 (0.4%)
- Ukrainian: 52 (0.4%)
- Finnish: 39 (0.3%)
- Eastern European: 37 (0.3%)
- Barbadian: 35 (0.3%)
- Scotch-Irish: 33 (0.3%)
- British: 32 (0.2%)
- French: 28 (0.2%)
- Northern European: 26 (0.2%)
- Swiss: 25 (0.2%)
- Slovak: 19 (0.1%)
- Welsh: 17 (0.1%)
- Hungarian: 15 (0.1%)
- Trinidadian and Tobagonian: 13 (0.1%)
- Romanian: 12 (0.09%)
- French Canadian: 10 (0.08%)
- Czech: 10 (0.08%)
- Dutch: 8 (0.06%)
- Syrian: 7 (0.05%)
- Slavic: 7 (0.05%)
- Arab: 7 (0.05%)
- Norwegian: 6 (0.05%)
- Swedish: 5 (0.04%)
- Czechoslovakian: 2 (0.02%)
- Portuguese: 1 (0.01%)
Most common places of birth for foreign-born residents (%):
| Cockeysville: | 16.1% (689) |
| Maryland: | 6.4% (61,725) |
| Cockeysville: | 9.8% (420) |
| Maryland: | 12.0% (115,412) |
| Cockeysville: | 8.5% (366) |
| Maryland: | 0.4% (3,905) |
| Cockeysville: | 8.3% (354) |
| Maryland: | 4.6% (44,742) |
| Cockeysville: | 5.9% (252) |
| Maryland: | 1.4% (13,947) |
| Cockeysville: | 3.9% (167) |
| Maryland: | 1.3% (12,074) |
| Cockeysville: | 3.8% (164) |
| Maryland: | 0.2% (1,672) |
| Cockeysville: | 3.4% (147) |
| Maryland: | 0.5% (4,901) |
| Cockeysville: | 3.2% (137) |
| Maryland: | 1.8% (17,037) |
| Cockeysville: | 3.1% (133) |
| Maryland: | 3.8% (36,698) |
| Cockeysville: | 3.0% (128) |
| Maryland: | 2.5% (24,026) |
| Cockeysville: | 2.5% (105) |
| Maryland: | 1.1% (10,205) |
| Cockeysville: | 2.5% (105) |
| Maryland: | 3.4% (32,635) |
| Cockeysville: | 2.3% (99) |
| Maryland: | 4.6% (44,825) |
| Cockeysville: | 2.1% (92) |
| Maryland: | 4.4% (42,350) |
| Cockeysville: | 1.9% (83) |
| Maryland: | 0.7% (6,317) |
| Cockeysville: | 1.8% (77) |
| Maryland: | 0.5% (4,414) |
| Cockeysville: | 1.6% (67) |
| Maryland: | 1.9% (18,716) |
Place of birth for U.S.-born residents:
- This state: 12,358
- Other state: 6,094
- Northeast: 2,985
- Midwest: 574
- South: 2,038
- West: 446
85.0% of Cockeysville residents lived in the same house 1 years ago.
Out of people who lived in different houses, 32.2% lived in this county.
Out of people who lived in different counties, 47.7% lived in Maryland.
| Cockeysville: | 85.0% |
| State average: | 88.5% |
Education attainment for males 25 years and older:
- No schooling: 411
- Nursery to 4th grade: 72
- 5th and 6th grade: 6
- 7th and 8th grade: 7
- 9th grade: 136
- 10th grade: 52
- 11th grade: 51
- 12th grade, no diploma: 180
- High school graduate (or equivalency): 1,525
- Less than 1 year of college: 297
- Some college more than 1 year, no degree: 1,029
- Associate degree: 358
- Bachelor's degree: 2,938
- Master's degree: 933
- Professional school degree: 355
- Doctorate degree: 242

Education attainment for females 25 years and older:
- No schooling: 48
- Nursery to 4th grade: 37
- 5th and 6th grade: 50
- 7th and 8th grade: 21
- 9th grade: 13
- 10th grade: 52
- 11th grade: 34
- 12th grade, no diploma: 38
- High school graduate (or equivalency): 1,754
- Less than 1 year of college: 587
- Some college more than 1 year, no degree: 847
- Associate degree: 517
- Bachelor's degree: 2,737
- Master's degree: 1,088
- Professional school degree: 376
- Doctorate degree: 103


Housing units in structures:
- One, detached: 2,556
- One, attached: 1,305
- Two: 50
- 3 or 4: 278
- 5 to 9: 1,292
- 10 to 19: 4,341
- 20 to 49: 206
- 50 or more: 826
Housing units lacking complete kitchen facilities in 2022: 0.9%
House/condo owner moved in on average 13 years ago
Renter moved in on average 2 years ago

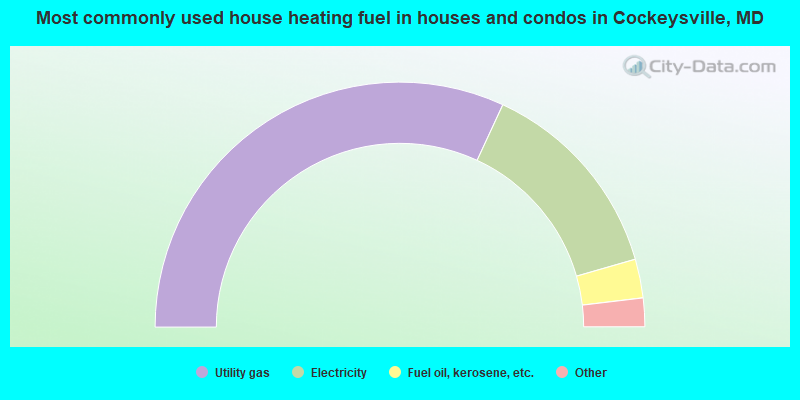
- 63.8%Utility gas
- 27.3%Electricity
- 5.1%Fuel oil, kerosene, etc.
- 3.2%Bottled, tank, or LP gas
- 0.3%Wood
- 0.1%No fuel used
- 0.1%Other fuel
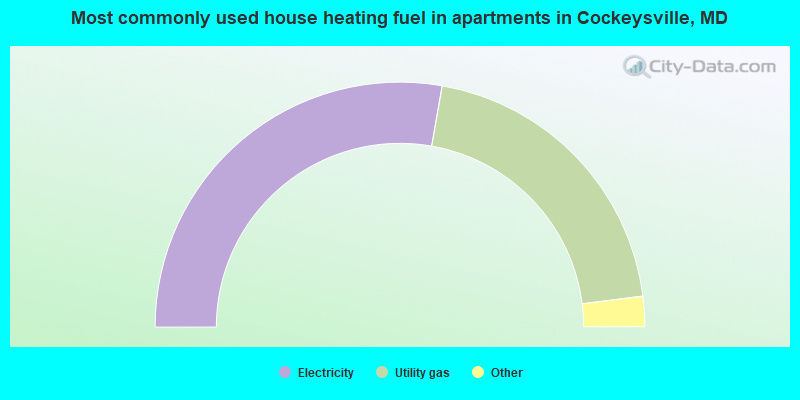
- 55.6%Electricity
- 40.5%Utility gas
- 3.3%Bottled, tank, or LP gas
- 0.7%Fuel oil, kerosene, etc.
Private vs. public school enrollment:
| Here: | 3.8% |
| Maryland: | 15.2% |
| Here: | 15.9% |
| Maryland: | 14.4% |
| Here: | 12.4% |
| Maryland: | 20.2% |


