Housing density: 2,529 houses/condos per square mile
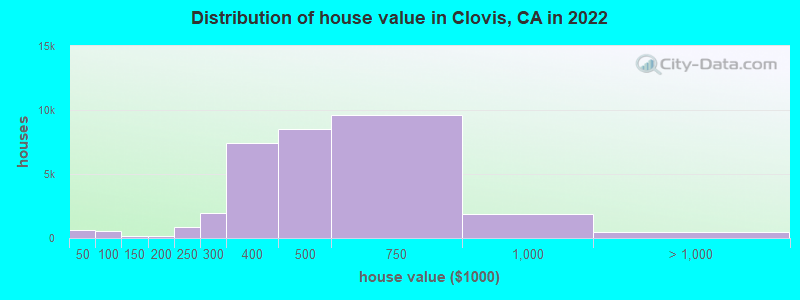
Median price asked for vacant for-sale houses and condos in 2022: $440,214.
Median contract rent in 2022: $1,328 (lower quartile is $1,086, upper quartile is $1,784)
Median rent asked for vacant for-rent units in 2022: $1,094
Median gross rent in Clovis, CA in 2022: $1,559
Housing units in Clovis with a mortgage: 20,657 (1,868 second mortgage, 52 home equity loan, 1,563 both second mortgage and home equity loan) Houses without a mortgage: 108
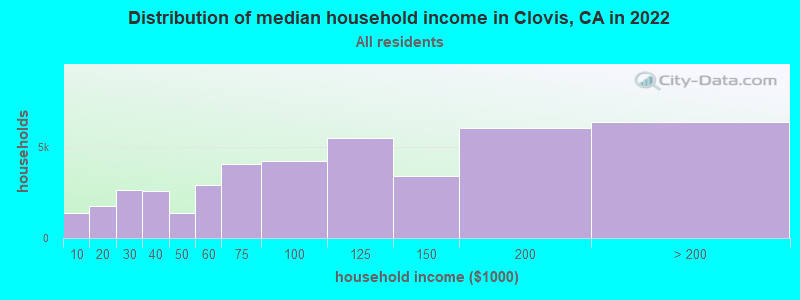
Median household income for houses/condos with a mortgage: $130,972
Median household income for apartments without a mortgage: $82,932
21,605 married couples with children.
7,506 single-parent households (905 men, 6,601 women).
75.3% of residents of Clovis speak English at home.
13.7% of residents speak Spanish at home (80% speak English very well, 11% speak English well, 7% speak English not well, 1% don't speak English at all).
3.2% of residents speak other Indo-European language at home (68% speak English very well, 18% speak English well, 7% speak English not well, 7% don't speak English at all).
6.6% of residents speak Asian or Pacific Island language at home (56% speak English very well, 26% speak English well, 13% speak English not well, 5% don't speak English at all).
0.9% of residents speak other language at home (87% speak English very well, 9% speak English well, 5% speak English not well).
Foreign born population: 15,419 (12.4%)
(64.2% of them are naturalized citizens)
Percentage of workers working in this county: 91.8% Number of people working at home: 7,233 (12.5% of all workers)
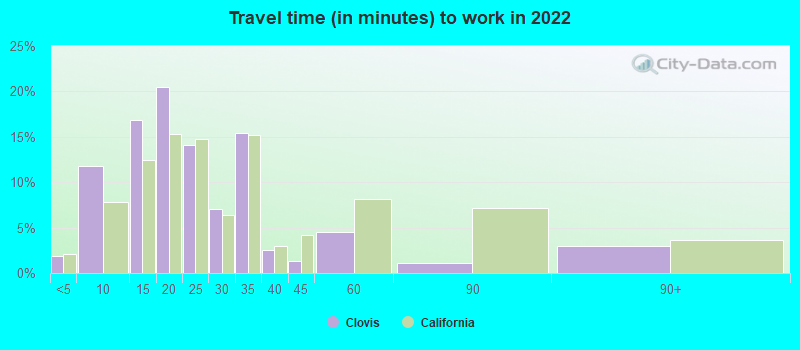
Travel time to work (commute)
Less than 5 minutes: 964
5 to 9 minutes: 5,405
10 to 14 minutes: 6,877
15 to 19 minutes: 11,564
20 to 24 minutes: 9,871
25 to 29 minutes: 4,935
30 to 34 minutes: 7,954
35 to 39 minutes: 1,063
40 to 44 minutes: 571
45 to 59 minutes: 2,114
60 to 89 minutes: 1,300
90 or more minutes: 1,279
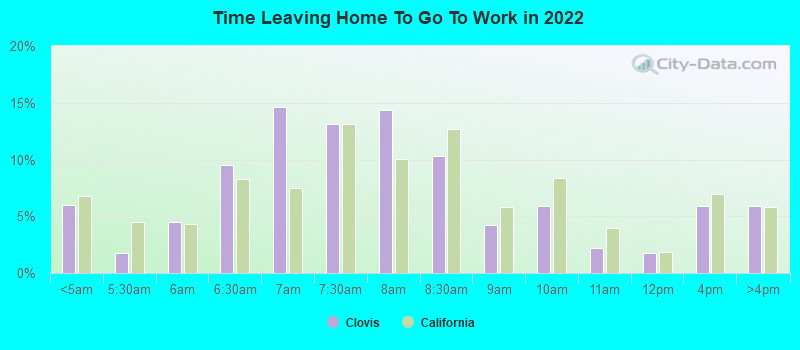
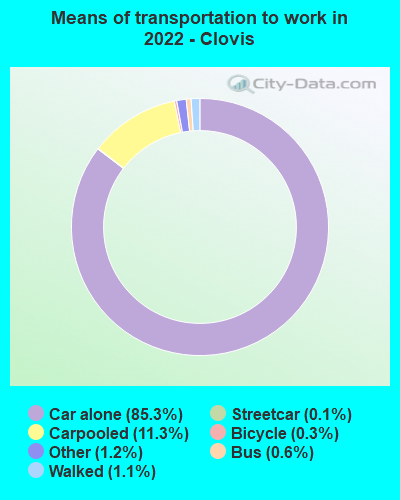
Means of transportation to work:
Drove a car alone: 28,953 (71.1%)
Carpooled: 3,909 (9.6%)
Bus: 153 (0.4%)
Subway or elevated rail: 39 (0.1%)
Ferryboat: 14 (0.0%)
Taxi: 630 (1.5%)
Bicycle: 129 (0.3%)
Walked: 392 (1.0%)
Worked at home: 7,233 (17.8%)
Unemployment by race in 2022
Unemployment rate for White non-Hispanic residents
3.0%Males
2.5%Females
Unemployment rate for Black residents
7.5%Males
6.7%Females
Unemployment rate for American Indian and Alaska Native residents
11.7%Females
Unemployment rate for Asian residents
6.7%Males
3.1%Females
Unemployment rate for other race residents
6.2%Males
9.1%Females
Unemployment rate for two or more race residents
4.1%Males
3.2%Females
Unemployment rate for Hispanic or Latino residents
5.9%Males
4.8%Females
Year of entry for the foreign-born population in Clovis, California
3,9512010 or later
3,5892000 to 2009
2,7591990 to 1999
1,7161980 to 1989
1,1431970 to 1979
974Before 1970
First ancestries reported:
English: 3,534 (5.8%)
German: 3,401 (5.6%)
Irish: 2,523 (4.2%)
Italian: 1,607 (2.7%)
American: 1,594 (2.6%)
European: 1,120 (1.9%)
Armenian: 662 (1.1%)
Scottish: 631 (1.0%)
Portuguese: 618 (1.0%)
French: 511 (0.8%)
Norwegian: 388 (0.6%)
Nigerian: 362 (0.6%)
Dutch: 280 (0.5%)
Eastern European: 234 (0.4%)
Polish: 192 (0.3%)
Scandinavian: 182 (0.3%)
Ethiopian: 150 (0.2%)
Lebanese: 146 (0.2%)
Swedish: 138 (0.2%)
Danish: 137 (0.2%)
Russian: 130 (0.2%)
Scotch-Irish: 120 (0.2%)
British: 109 (0.2%)
French Canadian: 105 (0.2%)
Iranian: 100 (0.2%)
Iraqi: 99 (0.2%)
Greek: 88 (0.1%)
Syrian: 83 (0.1%)
Hungarian: 81 (0.1%)
Czechoslovakian: 79 (0.1%)
Swiss: 79 (0.1%)
Northern European: 77 (0.1%)
Jordanian: 74 (0.1%)
Welsh: 71 (0.1%)
Ghanaian: 69 (0.1%)
Ukrainian: 68 (0.1%)
Canadian: 65 (0.1%)
Croatian: 62 (0.1%)
Basque: 47 (0.08%)
Ugandan: 44 (0.07%)
South African: 43 (0.07%)
Trinidadian and Tobagonian: 41 (0.07%)
Sierra Leonean: 38 (0.06%)
Yugoslavian: 29 (0.05%)
Finnish: 29 (0.05%)
Czech: 24 (0.04%)
Austrian: 20 (0.03%)
Jamaican: 16 (0.03%)
Brazilian: 14 (0.02%)
Israeli: 12 (0.02%)
Serbian: 12 (0.02%)
Arab: 11 (0.02%)
Slovene: 10 (0.02%)
Latvian: 9 (0.01%)
Egyptian: 5 (0.01%)
Assyrian: 4 (0.01%)
African: 4 (0.01%)
Most common places of birth for foreign-born residents (%):
Mexico
Clovis:
29.0% (4,376)
California:
37.2% (3,881,193)
India
Clovis:
12.1% (1,818)
California:
5.2% (539,184)
Philippines
Clovis:
11.0% (1,663)
California:
7.8% (818,297)
China, excluding Hong Kong and Taiwan
Clovis:
5.5% (822)
California:
6.6% (684,672)
Vietnam
Clovis:
5.0% (749)
California:
4.9% (512,335)
Laos
Clovis:
4.4% (664)
California:
0.5% (48,911)
Cambodia
Clovis:
3.4% (514)
California:
0.5% (51,974)
Thailand
Clovis:
3.0% (451)
California:
0.6% (65,335)
Korea
Clovis:
2.2% (339)
California:
3.0% (315,248)
Canada
Clovis:
1.6% (248)
California:
1.2% (127,477)
Indonesia
Clovis:
1.6% (235)
California:
0.4% (39,097)
Nigeria
Clovis:
1.5% (232)
California:
0.3% (35,557)
Place of birth for U.S.-born residents:
This state: 92,347
Other state: 15,949
Northeast: 1,765
Midwest: 5,602
South: 3,691
West: 4,891
87.1% of Clovis residents lived in the same house 1 years ago. Out of people who lived in different houses, 42.3% lived in this county. Out of people who lived in different counties, 75.2% lived in California.
Clovis:
87.1%
State average:
88.9%
Education attainment for males 25 years and older:
No schooling: 665
Nursery to 4th grade: 0
5th and 6th grade: 754
7th and 8th grade: 572
9th grade: 166
10th grade: 1,024
11th grade: 226
12th grade, no diploma: 761
High school graduate (or equivalency): 9,406
Less than 1 year of college: 3,389
Some college more than 1 year, no degree: 5,709
Associate degree: 3,150
Bachelor's degree: 7,393
Master's degree: 3,949
Professional school degree: 708
Doctorate degree: 257
Education attainment for females 25 years and older:
No schooling: 1,011
Nursery to 4th grade: 157
5th and 6th grade: 262
7th and 8th grade: 92
9th grade: 187
10th grade: 564
11th grade: 242
12th grade, no diploma: 805
High school graduate (or equivalency): 12,824
Less than 1 year of college: 3,528
Some college more than 1 year, no degree: 3,283
Associate degree: 5,157
Bachelor's degree: 9,478
Master's degree: 4,880
Professional school degree: 1,401
Doctorate degree: 685
Housing units in structures:
One, detached: 32,740
One, attached: 1,001
Two: 1,116
3 or 4: 1,696
5 to 9: 1,607
10 to 19: 974
20 to 49: 1,356
50 or more: 1,941
Mobile homes: 850
Median worth of mobile homes: $64,900
Housing units lacking complete plumbing facilities in 2022: 0.1%
Housing units lacking complete kitchen facilities in 2022: 1.3%