Clinton, MA (Massachusetts) Houses and Residents
| Clinton: | $339,804 |
| Massachusetts: | $534,700 |
Total population: 7,389 (All urban)
Houses: 3,711 (3,440 occupied: 1,771 owner occupied, 1,708 renter occupied)
| % of renters here: | 49% |
| State: | 38% |
Housing density: 2,477 houses/condos per square mile
Median price asked for vacant for-sale houses and condos in 2022 in this county: $182,682.
Median contract rent in 2022: $1,161 (lower quartile is $967, upper quartile is $1,456)
Median rent asked for vacant for-rent units in 2022: $1,104
Median gross rent in Clinton, MA in 2022: $1,341
Housing units in Clinton with a mortgage: 1,121 (119 second mortgage, 0 home equity loan, 92 both second mortgage and home equity loan)
Houses without a mortgage: 64
Median household income for houses/condos with a mortgage: $122,248
Median household income for apartments without a mortgage: $67,467
Median monthly housing costs: $1,327
Compare current foreclosures near Clinton, MA:
| Photo | Address | Area | Beds / Baths | Price | Details |
|---|---|---|---|---|---|

|
#1
Beech St
Clinton, MA 01510
|
1,900 sq. feet
|
2 baths 3 beds |
show details | |

|
#2
Auburn St
Clinton, MA 01510
|
1,856 sq. feet
|
2 baths 2 beds |
show details | |

|
#3
Oak Hill Ave
Clinton, MA 01510
|
1,248 sq. feet
|
1 baths 3 beds |
show details | |

|
#4
Nathan Dr
Clinton, MA 01510
|
2,372 sq. feet
|
2 baths 3 beds |
show details | |

|
#5
Fitch Rd
Clinton, MA 01510
|
- sq. feet
|
- baths - beds |
show details | |

|
#6
Main St
Clinton, MA 01510
|
- sq. feet
|
- baths - beds |
show details | |

|
#7
Green St Unit C202
Clinton, MA 01510
|
- sq. feet
|
- baths - beds |
show details | |

|
#8
Nome St
Worcester, MA 01605
|
960 sq. feet
|
1 baths 4 beds |
$208,000
|
show details |

|
#9
Great Rd
Shirley, MA 01464
|
1,672 sq. feet
|
1 baths 2 beds |
$464,900
|
show details |

|
#10
Sylvan Ave
Leominster, MA 01453
|
720 sq. feet
|
1 baths 2 beds |
$375,000
|
show details |
| Photo | Address | Area | Beds / Baths | Price | Details |
|---|---|---|---|---|---|

|
#11
Graham St
Leominster, MA 01453
|
1,036 sq. feet
|
1 baths 3 beds |
$485,000
|
show details |

|
#12
Pearl Hill Rd
Fitchburg, MA 01420
|
2,152 sq. feet
|
2 baths 3 beds |
$529,900
|
show details |

|
#13
Grove Ave
Leominster, MA 01453
|
3,097 sq. feet
|
1 baths 4 beds |
show details | |

|
#14
Reagan Rd
Townsend, MA 01469
|
1,591 sq. feet
|
2 baths 3 beds |
show details | |

|
#15
Hemlock Dr
Lunenburg, MA 01462
|
696 sq. feet
|
1 baths 2 beds |
show details | |

|
#16
Garnet St
Fitchburg, MA 01420
|
6,112 sq. feet
|
5 baths 8 beds |
show details | |

|
#17
Pocasset Ave
Worcester, MA 01606
|
2,090 sq. feet
|
3 baths 3 beds |
show details | |

|
#18
Riverlin St
Millbury, MA 01527
|
1,162 sq. feet
|
2 baths 2 beds |
show details | |

|
#19
Everett Cir
Hopkinton, MA 01748
|
5,180 sq. feet
|
3 baths 4 beds |
show details | |

|
#20
Redfield Rd
Cherry Valley, MA 01611
|
1,412 sq. feet
|
1 baths 3 beds |
show details |
| Photo | Address | Area | Beds / Baths | Price | Details |
|---|---|---|---|---|---|

|
#21
Marks Way
Maynard, MA 01754
|
2,596 sq. feet
|
2 baths 4 beds |
show details | |

|
#22
Old Bolton Rd
Hudson, MA 01749
|
1,244 sq. feet
|
1 baths 3 beds |
show details | |

|
#23
Deer Path Apt 5
Maynard, MA 01754
|
1,540 sq. feet
|
1 baths 2 beds |
show details | |

|
#24
Great Rd
Stow, MA 01775
|
2,026 sq. feet
|
2 baths 3 beds |
show details | |

|
#25
Goodnow Ln
Framingham, MA 01702
|
2,342 sq. feet
|
2 baths 4 beds |
show details | |

|
#26
Sugar Rd
Bolton, MA 01740
|
1,988 sq. feet
|
2 baths 3 beds |
show details | |

|
#27
Cedar St
Ashland, MA 01721
|
2,756 sq. feet
|
3 baths 4 beds |
show details | |

|
#28
Hawkins St
Worcester, MA 01604
|
864 sq. feet
|
1 baths 3 beds |
show details | |

|
#29
Oakland St
Fitchburg, MA 01420
|
1,252 sq. feet
|
1 baths 3 beds |
show details | |

|
#30
New West Townsend Rd
Lunenburg, MA 01462
|
1,270 sq. feet
|
1 baths 4 beds |
show details |
| Photo | Address | Area | Beds / Baths | Price | Details |
|---|---|---|---|---|---|

|
#31
Wabash Ave
Worcester, MA 01604
|
2,620 sq. feet
|
2 baths 6 beds |
show details | |

|
#32
Worcester St
North Grafton, MA 01536
|
1,040 sq. feet
|
2 baths 3 beds |
show details | |

|
#33
Worcester St
North Grafton, MA 01536
|
2,526 sq. feet
|
3 baths 6 beds |
show details | |

|
#34
Fairfield St
Maynard, MA 01754
|
2,384 sq. feet
|
3 baths 4 beds |
show details | |

|
#35
Pleasant St
Framingham, MA 01701
|
1,200 sq. feet
|
2 baths 3 beds |
show details | |

|
#36
Rutledge St Apt 1c
Worcester, MA 01604
|
900 sq. feet
|
1 baths 1 beds |
show details | |

|
#37
Greenbush Rd
Worcester, MA 01604
|
1,666 sq. feet
|
2 baths 3 beds |
show details | |

|
#38
Marshall St # 2
Fitchburg, MA 01420
|
2,509 sq. feet
|
3 baths 4 beds |
show details | |

|
#39
Beacon St
Worcester, MA 01610
|
2,869 sq. feet
|
3 baths 8 beds |
show details | |

|
#40
Magnolia Ln
North Grafton, MA 01536
|
3,069 sq. feet
|
2 baths 4 beds |
show details |
| Photo | Address | Area | Beds / Baths | Price | Details |
|---|---|---|---|---|---|

|
#41
North St
Grafton, MA 01519
|
2,146 sq. feet
|
2 baths 4 beds |
show details | |

|
#42
Stonebrook Rd
Sudbury, MA 01776
|
2,172 sq. feet
|
2 baths 4 beds |
show details | |

|
#43
Fairmount St
Fitchburg, MA 01420
|
1,456 sq. feet
|
1 baths 3 beds |
show details | |

|
#44
Townsend Rd
Groton, MA 01450
|
1,452 sq. feet
|
1 baths 3 beds |
show details | |

|
#45
Carter Way
Worcester, MA 01609
|
2,397 sq. feet
|
2 baths 4 beds |
show details | |

|
#46
Kenberma Rd
Worcester, MA 01604
|
1,122 sq. feet
|
1 baths 3 beds |
show details | |

|
#47
Moulton Rd
Southborough, MA 01772
|
1,248 sq. feet
|
1 baths 3 beds |
show details | |

|
#48
Beacon St
Worcester, MA 01610
|
2,432 sq. feet
|
2 baths 4 beds |
show details | |

|
#49
Ashburnham St
Fitchburg, MA 01420
|
2,095 sq. feet
|
1 baths 3 beds |
show details | |

|
Check over 1 million property listings on Foreclosure.com!
|
browse all offers | |||

Latest news about housing in Clinton, MA collected exclusively by city-data.com from local newspapers, TV, and radio stations


Median year apartment built: 1963
Household type by relationship:
Households: 7,395- Male householders: 1,611 (728 living alone), Female householders: 1,804 (667 living alone)
1,094 spouses (1,074 opposite-sex spouses), 341 unmarried partners, (341 opposite-sex unmarried partners), 1,884 children (1,826 natural, 32 adopted, 26 stepchildren), 88 grandchildren, 42 brothers or sisters, 77 parents, 0 foster children, 100 other relatives, 323 non-relatives
- In group quarters: 27
Size of family households: 630 2-persons, 375 3-persons, 434 4-persons, 85 5-persons, 20 6-persons, 16 7-or-more-persons.
Size of nonfamily households: 1,441 1-person, 444 2-persons, 53 3-persons, 17 7-or-more-persons.
557 married couples with children.
288 single-parent households (33 men, 255 women).
78.8% of residents of Clinton speak English at home.
16.1% of residents speak Spanish at home (45% speak English very well, 20% speak English well, 28% speak English not well, 6% don't speak English at all).
4.9% of residents speak other Indo-European language at home (77% speak English very well, 8% speak English well, 10% speak English not well, 4% don't speak English at all).
0.4% of residents speak Asian or Pacific Island language at home (36% speak English very well, 64% speak English well).
0.1% of residents speak other language at home (100% speak English very well).
Foreign born population: 831 (11.2%)
(48.7% of them are naturalized citizens)
| Here: | 6.3 |
| State: | 6.5 |
| Here: | 3.9 |
| State: | 4.0 |

- Bedrooms in owner-occupied houses and condos in Clinton, Massachusetts
- 11no bedroom
- 531 bedroom
- 3742 bedrooms
- 8313 bedrooms
- 2604 bedrooms
- 2435+ bedrooms

- Bedrooms in renter-occupied apartments in Clinton, Massachusetts
- 82no bedroom
- 7431 bedroom
- 4792 bedrooms
- 2943 bedrooms
- 1034 bedrooms
- 75+ bedrooms

- Cars and other vehicles available in Clinton in owner-occupied houses/condos
- 12no vehicle
- 5341 vehicle
- 6292 vehicles
- 3663 vehicles
- 1584 vehicles
- 725+ vehicles

- Cars and other vehicles available in Clinton in renter-occupied apartments
- 231no vehicle
- 8671 vehicle
- 4582 vehicles
- 1483 vehicles
- 04 vehicles
- 45+ vehicles

- Rooms in owner-occupied houses in Clinton, Massachusetts
- 01 room
- 02 rooms
- 333 rooms
- 574 rooms
- 3835 rooms
- 4616 rooms
- 1937 rooms
- 2778 rooms
- 3679+ rooms

- Rooms in renter-occupied apartments in Clinton, Massachusetts
- 821 room
- 1782 rooms
- 4903 rooms
- 3904 rooms
- 2235 rooms
- 2846 rooms
- 287 rooms
- 278 rooms
- 79+ rooms


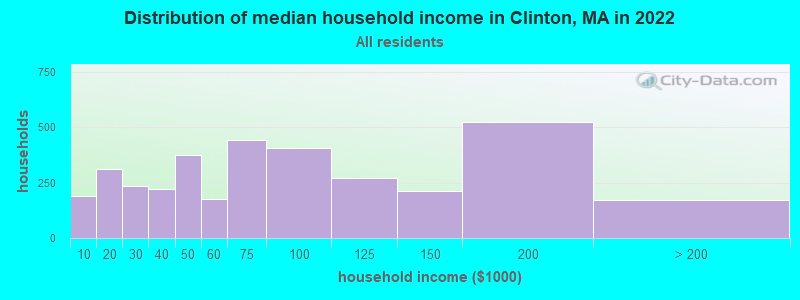
Clinton, MA household income distribution

- 190Less than $10,000
- 313$10,000 to $19,999
- 233$20,000 to $29,999
- 220$30,000 to $39,999
- 373$40,000 to $49,999
- 175$50,000 to $59,999
- 440$60,000 to $74,999
- 408$75,000 to $99,999
- 270$100,000 to $124,999
- 211$125,000 to $149,999
- 523$150,000 to $199,999
- 171$200,000 or more
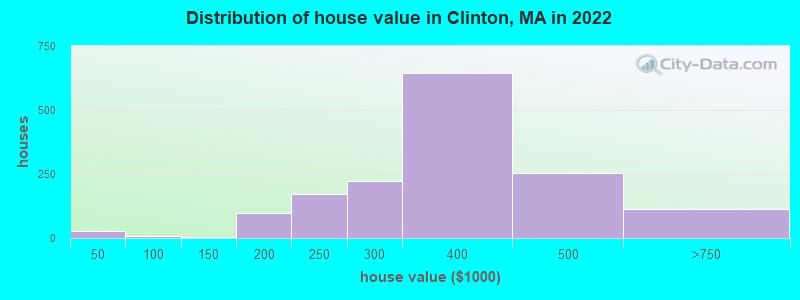
Home value of owner - occupied houses in 2022 in Clinton, MA
-
- 19Less than $10,000
- 8$40,000 to $49,999
- 5$100,000 to $124,999
- 63$150,000 to $174,999
- 33$175,000 to $199,999
- 173$200,000 to $249,999
- 220$250,000 to $299,999
- 643$300,000 to $399,999
- 253$400,000 to $499,999
- 101$500,000 to $749,999
- 11$1,000,000 to $1,499,999
Rent paid by renters in 2022 in Clinton, MA
-
- 71$100 to $149
- 7$200 to $249
- 46$250 to $299
- 16$300 to $349
- 9$350 to $399
- 54$400 to $449
- 3$450 to $499
- 3$550 to $599
- 4$600 to $649
- 7$650 to $699
- 30$700 to $749
- 45$750 to $799
- 131$800 to $899
- 207$900 to $999
- 557$1,000 to $1,249
- 305$1,250 to $1,499
- 131$1,500 to $1,999
- 147$2,000 to $2,499
- 58$3,500 or more
- 12No cash rent


Percentage of workers working in this county: 64.1%
Number of people working at home: 412 (9.2% of all workers)
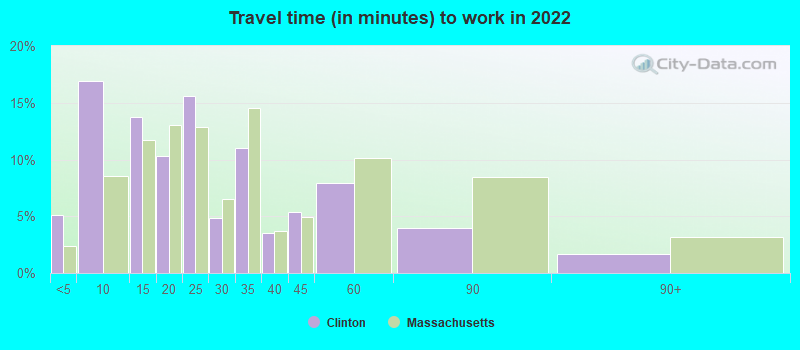
Travel time to work (commute)
- Less than 5 minutes: 214
- 5 to 9 minutes: 534
- 10 to 14 minutes: 233
- 15 to 19 minutes: 548
- 20 to 24 minutes: 635
- 25 to 29 minutes: 389
- 30 to 34 minutes: 540
- 35 to 39 minutes: 231
- 40 to 44 minutes: 73
- 45 to 59 minutes: 139
- 60 to 89 minutes: 221
- 90 or more minutes: 200
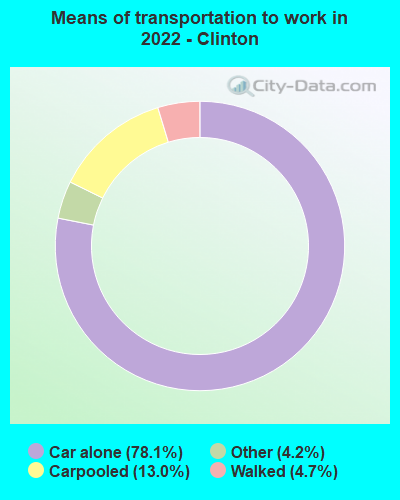
Means of transportation to work:
- Drove a car alone: 2,133 (67.0%)
- Carpooled: 377 (11.8%)
- Taxi: 143 (4.5%)
- Walked: 95 (3.0%)
- Worked at home: 412 (12.9%)

- Unemployment by race in 2022
- Unemployment rate for White non-Hispanic residents
- 2.6%Males
- 2.3%Females
- Unemployment rate for other race residents
- 10.0%Males
- 15.8%Females
- Unemployment rate for two or more race residents
- 11.1%Males
- Unemployment rate for Hispanic or Latino residents
- 8.4%Males
- 4.2%Females

- Year of entry for the foreign-born population in Clinton, Massachusetts
- 4052010 or later
- 1062000 to 2009
- 1701990 to 1999
- 2231980 to 1989
- 301970 to 1979
- 154Before 1970

First ancestries reported:
- Irish: 625 (19.9%)
- Italian: 456 (14.5%)
- American: 195 (6.2%)
- Brazilian: 157 (5.0%)
- English: 137 (4.4%)
- British: 75 (2.4%)
- French: 75 (2.4%)
- German: 71 (2.3%)
- French Canadian: 58 (1.8%)
- Polish: 49 (1.6%)
- Greek: 40 (1.3%)
- Dutch: 25 (0.8%)
- Scottish: 16 (0.5%)
- Jamaican: 15 (0.5%)
- European: 14 (0.4%)
- Russian: 13 (0.4%)
- Armenian: 11 (0.3%)
- Slavic: 11 (0.3%)
- Swedish: 11 (0.3%)
- Canadian: 10 (0.3%)
- Romanian: 9 (0.3%)
- Ukrainian: 9 (0.3%)
- Northern European: 7 (0.2%)
- African: 7 (0.2%)
- Ethiopian: 5 (0.2%)
- Scotch-Irish: 3 (0.10%)
Most common places of birth for foreign-born residents (%):
| Clinton: | 28.3% (231) |
| Massachusetts: | 8.3% (101,767) |
| Clinton: | 25.7% (210) |
| Massachusetts: | 2.7% (32,733) |
| Clinton: | 17.4% (142) |
| Massachusetts: | 7.6% (92,959) |
| Clinton: | 3.9% (32) |
| Massachusetts: | 0.4% (5,265) |
| Clinton: | 3.3% (27) |
| Massachusetts: | 3.7% (45,667) |
| Clinton: | 3.1% (25) |
| Massachusetts: | 0.6% (7,349) |
| Clinton: | 2.9% (24) |
| Massachusetts: | 1.0% (11,727) |
| Clinton: | 2.8% (23) |
| Massachusetts: | 0.1% (886) |
| Clinton: | 2.6% (21) |
| Massachusetts: | 1.0% (12,529) |
| Clinton: | 2.6% (21) |
| Massachusetts: | 8.4% (103,233) |
| Clinton: | 2.0% (16) |
| Massachusetts: | 1.0% (12,709) |
| Clinton: | 1.6% (13) |
| Massachusetts: | 2.3% (28,158) |
Place of birth for U.S.-born residents:
- This state: 4,983
- Other state: 1,130
- Northeast: 611
- Midwest: 186
- South: 152
- West: 179
88.1% of Clinton residents lived in the same house 1 years ago.
Out of people who lived in different houses, 36.8% lived in this county.
Out of people who lived in different counties, 75.9% lived in Massachusetts.
| Clinton: | 88.1% |
| State average: | 87.7% |
Education attainment for males 25 years and older:
- No schooling: 39
- Nursery to 4th grade: 0
- 5th and 6th grade: 41
- 7th and 8th grade: 0
- 9th grade: 104
- 10th grade: 66
- 11th grade: 6
- 12th grade, no diploma: 65
- High school graduate (or equivalency): 1,015
- Less than 1 year of college: 277
- Some college more than 1 year, no degree: 378
- Associate degree: 216
- Bachelor's degree: 362
- Master's degree: 219
- Professional school degree: 28
- Doctorate degree: 0

Education attainment for females 25 years and older:
- No schooling: 27
- Nursery to 4th grade: 0
- 5th and 6th grade: 81
- 7th and 8th grade: 5
- 9th grade: 84
- 10th grade: 27
- 11th grade: 8
- 12th grade, no diploma: 12
- High school graduate (or equivalency): 635
- Less than 1 year of college: 226
- Some college more than 1 year, no degree: 339
- Associate degree: 411
- Bachelor's degree: 584
- Master's degree: 185
- Professional school degree: 14
- Doctorate degree: 0


Housing units in structures:
- One, detached: 1,406
- One, attached: 201
- Two: 536
- 3 or 4: 708
- 5 to 9: 191
- 10 to 19: 288
- 20 to 49: 176
- 50 or more: 136
- Mobile homes: 66
Housing units lacking complete kitchen facilities in 2022: 1.8%
House/condo owner moved in on average 12 years ago
Renter moved in on average 3 years ago

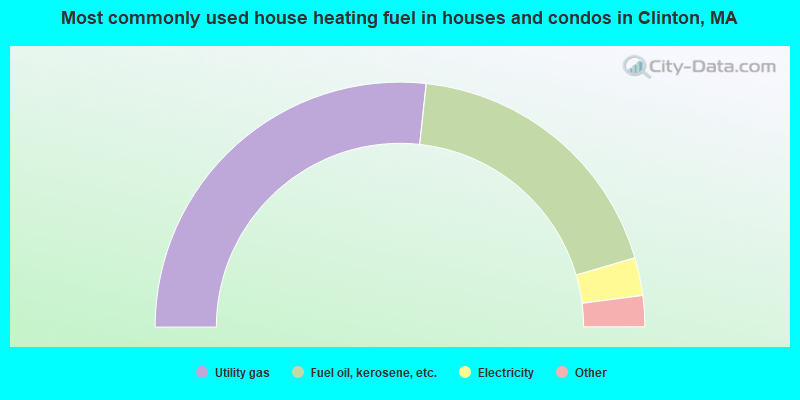
- 53.5%Utility gas
- 37.5%Fuel oil, kerosene, etc.
- 5.0%Electricity
- 1.7%Bottled, tank, or LP gas
- 1.2%Other fuel
- 0.8%Solar energy
- 0.3%Wood
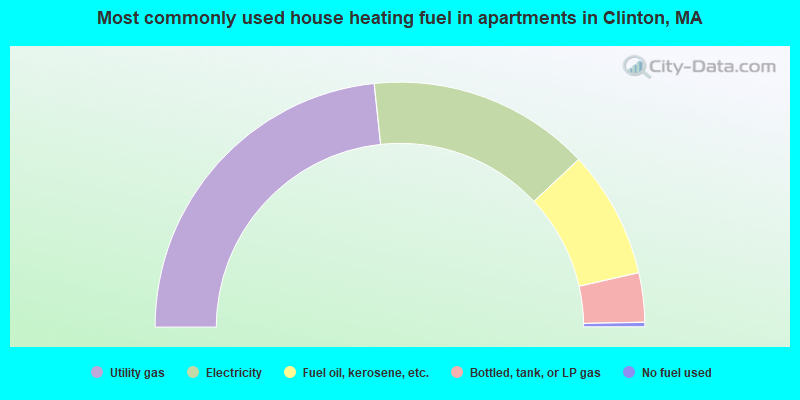
- 46.7%Utility gas
- 29.4%Electricity
- 16.9%Fuel oil, kerosene, etc.
- 6.5%Bottled, tank, or LP gas
- 0.6%No fuel used
Private vs. public school enrollment:
| Here: | 6.0% |
| Massachusetts: | 10.3% |
| Here: | 2.7% |
| Massachusetts: | 12.3% |
| Here: | 34.0% |
| Massachusetts: | 51.2% |


