Clifton Park, NY (New York) Houses and Residents
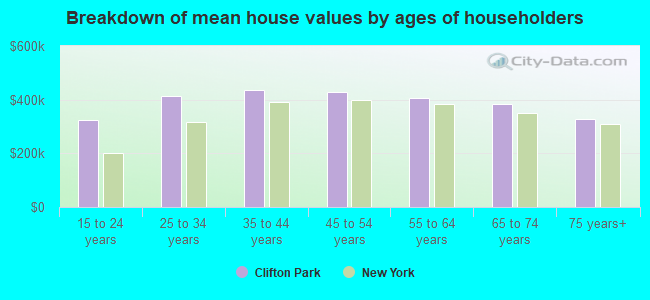
| Clifton Park: | $435,056 |
| New York: | $400,400 |
Total population: 36,705 (Urban population: 28,473, Rural population: 4,522 (118 farm, 4,404 nonfarm))
Houses: 13,069 (12,581 occupied: 9,842 owner occupied, 2,739 renter occupied)
| % of renters here: | 22% |
| State: | 46% |
Housing density: 269 houses/condos per square mile
Median price asked for vacant for-sale houses and condos in 2022 in this county: $318,652.
Median contract rent in 2022: $1,327 (lower quartile is $1,165, upper quartile is $1,662)
Median rent asked for vacant for-rent units in 2022: $1,456
Median gross rent in Clifton Park, NY in 2022: $1,448
Housing units in Clifton Park with a mortgage: 7,280 (522 second mortgage, 1,110 home equity loan, 31 both second mortgage and home equity loan)
Houses without a mortgage: 1,981
Compare current foreclosures in Clifton Park, NY:
| Photo | Address | Area | Beds / Baths | Price | Details |
|---|---|---|---|---|---|

|
#1
Redfield Park
Clifton Park, NY 12065
|
2,573 sq. feet
|
2 baths 4 beds |
show details | |

|
#2
Generals Way
Clifton Park, NY 12065
|
1,059 sq. feet
|
1 baths 2 beds |
show details | |

|
#3
Generals Way
Clifton Park, NY 12065
|
1,080 sq. feet
|
1 baths 2 beds |
show details | |

|
#4
Cambridge Ct
Clifton Park, NY 12065
|
1,924 sq. feet
|
1 baths 3 beds |
show details | |

|
#5
Woodridge Cir
Clifton Park, NY 12065
|
2,738 sq. feet
|
3 baths 6 beds |
show details | |

|
#6
Acorn Ave
Clifton Park, NY 12065
|
2,294 sq. feet
|
1 baths 4 beds |
show details | |

|
#7
Grooms Rd
Clifton Park, NY 12065
|
3,106 sq. feet
|
3 baths 4 beds |
show details | |

|
#8
Minuteman Ct
Clifton Park, NY 12065
|
1,281 sq. feet
|
2 baths 2 beds |
show details | |

|
#9
Grooms Rd
Clifton Park, NY 12065
|
1,227 sq. feet
|
1 baths 3 beds |
show details | |

|
#10
Pine Tree Pl
Clifton Park, NY 12065
|
2,244 sq. feet
|
1 baths 3 beds |
show details |
| Photo | Address | Area | Beds / Baths | Price | Details |
|---|---|---|---|---|---|

|
#11
Tallow Wood Dr
Clifton Park, NY 12065
|
1,480 sq. feet
|
1 baths 3 beds |
show details | |

|
#12
Vanvranken Rd
Clifton Park, NY 12065
|
2,330 sq. feet
|
2 baths 4 beds |
show details | |

|
#13
Southcrest Dr
Clifton Park, NY 12065
|
2,072 sq. feet
|
2 baths 3 beds |
show details | |

|
#14
Turnberry Ln
Clifton Park, NY 12065
|
2,263 sq. feet
|
2 baths 3 beds |
show details | |

|
#15
Gramecy Ct
Clifton Park, NY 12065
|
1,876 sq. feet
|
2 baths 3 beds |
show details | |

|
#16
Canterbury Rd
Clifton Park, NY 12065
|
2,426 sq. feet
|
3 baths 4 beds |
show details | |

|
#17
Brookline Dr
Clifton Park, NY 12065
|
2,310 sq. feet
|
2 baths 4 beds |
show details | |

|
#18
Woodridge Cir # B
Clifton Park, NY 12065
|
3,024 sq. feet
|
2 baths 6 beds |
show details | |

|
#19
Brookwood Dr
Clifton Park, NY 12065
|
2,694 sq. feet
|
2 baths 4 beds |
show details | |

|
#20
Fellows Rd
Clifton Park, NY 12065
|
2,816 sq. feet
|
4 baths 6 beds |
show details |
| Photo | Address | Area | Beds / Baths | Price | Details |
|---|---|---|---|---|---|

|
#21
Werner Rd
Clifton Park, NY 12065
|
860 sq. feet
|
1 baths 2 beds |
show details | |

|
#22
Grooms Rd
Clifton Park, NY 12065
|
1,324 sq. feet
|
1 baths 3 beds |
show details | |

|
#23
Juniper Dr
Clifton Park, NY 12065
|
2,646 sq. feet
|
2 baths 4 beds |
show details | |

|
#24
Plaid Pl
Clifton Park, NY 12065
|
1,803 sq. feet
|
1 baths 4 beds |
show details | |

|
#25
Sleepy Hollow Dr
Clifton Park, NY 12065
|
2,461 sq. feet
|
2 baths 4 beds |
show details | |

|
#26
Clamsteam Rd
Clifton Park, NY 12065
|
- sq. feet
|
1 baths 3 beds |
show details | |

|
#27
Dawson Ln
Clifton Park, NY 12065
|
2,951 sq. feet
|
2 baths 4 beds |
show details | |

|
#28
Hendrik Hudson Way
Clifton Park, NY 12065
|
1,844 sq. feet
|
2 baths 4 beds |
show details | |

|
#29
Anthony Rd
Clifton Park, NY 12065
|
1,588 sq. feet
|
2 baths 3 beds |
show details | |

|
#30
Eastwood Dr
Clifton Park, NY 12065
|
- sq. feet
|
- baths - beds |
show details |
| Photo | Address | Area | Beds / Baths | Price | Details |
|---|---|---|---|---|---|

|
#31
Sparrow Hawk Cir Apt 224
Clifton Park, NY 12065
|
- sq. feet
|
- baths - beds |
show details | |

|
#32
Terrace Ct
Clifton Park, NY 12065
|
- sq. feet
|
- baths - beds |
show details | |

|
#33
Clifton Park Ctr Rd
Clifton Park, NY 12065
|
- sq. feet
|
- baths - beds |
show details | |

|
#34
Forest Grv
Clifton Park, NY 12065
|
- sq. feet
|
- baths - beds |
show details | |

|
#35
Tallow Wood Dr
Clifton Park, NY 12065
|
- sq. feet
|
- baths - beds |
show details | |

|
#36
Cambridge Dr
Clifton Park, NY 12065
|
- sq. feet
|
- baths - beds |
show details | |

|
#37
Century Ct
Clifton Park, NY 12065
|
- sq. feet
|
- baths - beds |
show details | |

|
#38
Solomon Ave
Clifton Park, NY 12065
|
- sq. feet
|
- baths - beds |
show details | |

|
#39
Paddock Turn
Clifton Park, NY 12065
|
- sq. feet
|
- baths - beds |
show details | |

|
#40
Gramecy Ct
Clifton Park, NY 12065
|
- sq. feet
|
- baths - beds |
show details |
| Photo | Address | Area | Beds / Baths | Price | Details |
|---|---|---|---|---|---|

|
#41
Meyer Rd # B
Clifton Park, NY 12065
|
- sq. feet
|
- baths - beds |
show details | |

|
#42
Terrace Ct
Clifton Park, NY 12065
|
- sq. feet
|
- baths - beds |
show details | |

|
#43
Woodin Rd
Clifton Park, NY 12065
|
- sq. feet
|
- baths - beds |
show details | |

|
#44
Huntridge Dr
Clifton Park, NY 12065
|
- sq. feet
|
- baths - beds |
show details | |

|
#45
Horseshoe Cir
Clifton Park, NY 12065
|
- sq. feet
|
- baths - beds |
show details | |

|
#46
Foxworth Dr
Clifton Park, NY 12065
|
- sq. feet
|
- baths - beds |
show details | |

|
#47
Foxwood Dr
Clifton Park, NY 12065
|
- sq. feet
|
- baths - beds |
show details | |

|
#48
Beach Rd
Clifton Park, NY 12065
|
- sq. feet
|
- baths - beds |
show details | |

|
#49
Grooms Rd # A
Clifton Park, NY 12065
|
- sq. feet
|
- baths - beds |
show details | |

|
Check over 1 million property listings on Foreclosure.com!
|
browse all offers | |||


Household type by relationship:
Households: 215,657- In family households: 178,426 (42,743 male householders, 16,071 female householders)
47,054 spouses, 61,098 children (57,248 natural, 1,431 adopted, 2,419 stepchildren), 2,569 grandchildren, 1,096 brothers or sisters, 1,340 parents, foster children, 1,112 other relatives, 4,333 non-relatives
- In nonfamily households: 37,231 (13,720 male householders (10,074 living alone)), 15,762 female householders (12,976 living alone)), 7,749 nonrelatives
- In group quarters: 3,950 (1,524 institutionalized population)
37,723 married couples with children.
9,524 single-parent households (2,512 men, 7,012 women).
92.7% of residents of Clifton Park speak English at home.
1.1% of residents speak Spanish at home (74% speak English very well, 19% speak English well, 7% speak English not well).
4.7% of residents speak other Indo-European language at home (83% speak English very well, 13% speak English well, 3% speak English not well).
1.3% of residents speak Asian or Pacific Island language at home (81% speak English very well, 13% speak English well, 3% speak English not well, 3% don't speak English at all).
0.3% of residents speak other language at home (92% speak English very well, 8% speak English well).
Foreign born population: 3,562 (9.1%)
(53.8% of them are naturalized citizens)
| Here: | 8.3 |
| State: | 6.3 |
| Here: | 4.1 |
| State: | 3.8 |
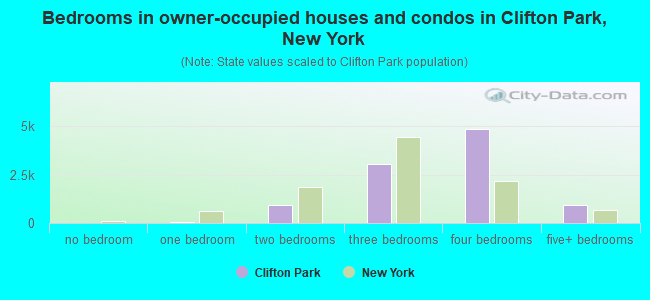
- Bedrooms in owner-occupied houses and condos in Clifton Park, New York
- 0no bedroom
- 451 bedroom
- 9332 bedrooms
- 3,0513 bedrooms
- 4,8584 bedrooms
- 9555+ bedrooms
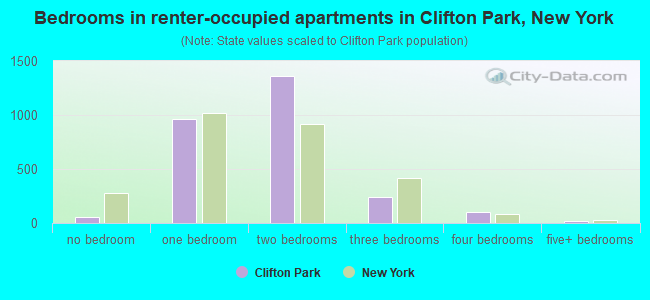
- Bedrooms in renter-occupied apartments in Clifton Park, New York
- 58no bedroom
- 9621 bedroom
- 1,3602 bedrooms
- 2403 bedrooms
- 1024 bedrooms
- 175+ bedrooms
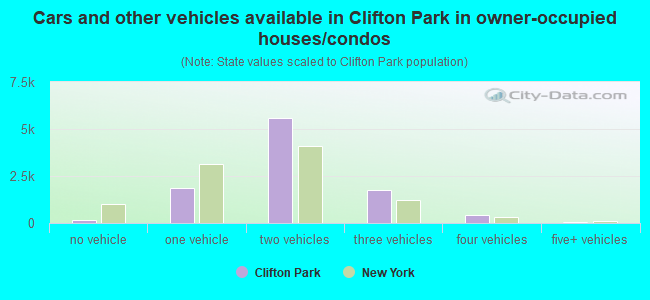
- Cars and other vehicles available in Clifton Park in owner-occupied houses/condos
- 175no vehicle
- 1,8401 vehicle
- 5,5872 vehicles
- 1,7583 vehicles
- 4064 vehicles
- 765+ vehicles
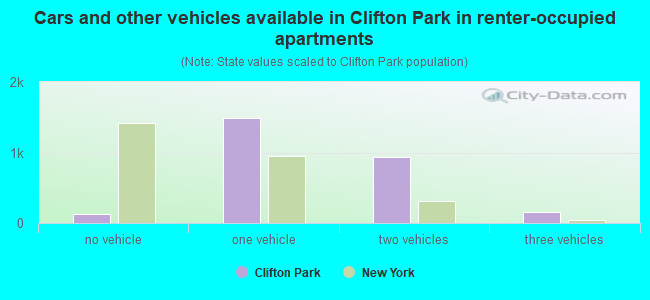
- Cars and other vehicles available in Clifton Park in renter-occupied apartments
- 134no vehicle
- 1,4891 vehicle
- 9432 vehicles
- 1563 vehicles
- 104 vehicles
- 75+ vehicles
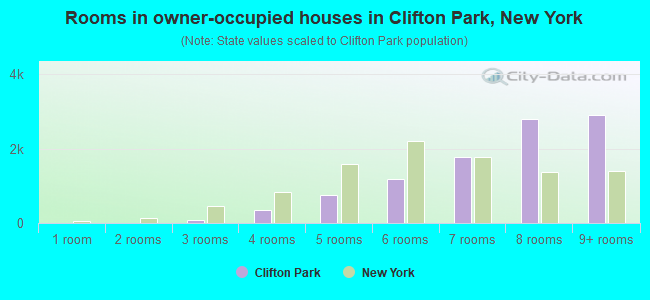
- Rooms in owner-occupied houses in Clifton Park, New York
- 01 room
- 02 rooms
- 853 rooms
- 3544 rooms
- 7555 rooms
- 1,1856 rooms
- 1,7697 rooms
- 2,7908 rooms
- 2,9049+ rooms
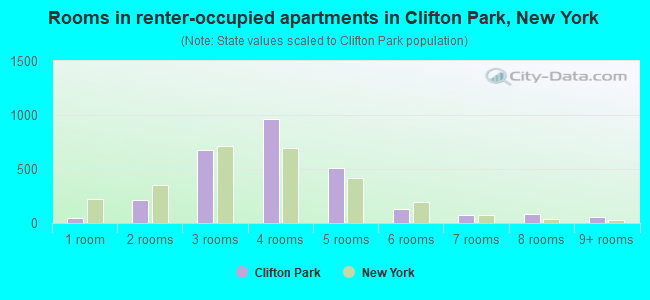
- Rooms in renter-occupied apartments in Clifton Park, New York
- 431 room
- 2132 rooms
- 6773 rooms
- 9654 rooms
- 5085 rooms
- 1296 rooms
- 717 rooms
- 798 rooms
- 549+ rooms
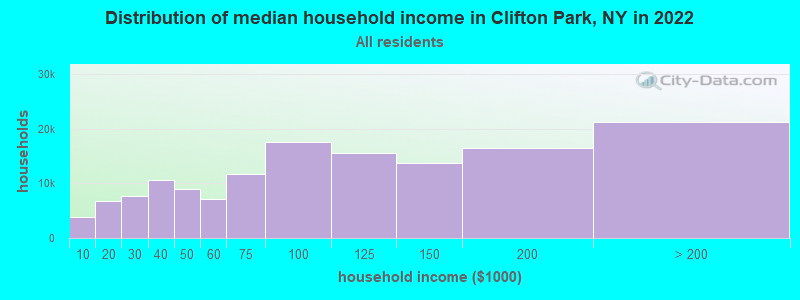
Clifton Park, NY household income distribution

- 3,860Less than $10,000
- 6,762$10,000 to $19,999
- 7,751$20,000 to $29,999
- 10,575$30,000 to $39,999
- 8,955$40,000 to $49,999
- 7,111$50,000 to $59,999
- 11,776$60,000 to $74,999
- 17,621$75,000 to $99,999
- 15,551$100,000 to $124,999
- 13,783$125,000 to $149,999
- 16,382$150,000 to $199,999
- 21,213$200,000 or more
Percentage of workers working in this county: 39.7%
Number of people working at home: 3,687 (16.9% of all workers)
Travel time to work (commute)
- Less than 5 minutes: 275
- 5 to 9 minutes: 1,124
- 10 to 14 minutes: 1,945
- 15 to 19 minutes: 2,114
- 20 to 24 minutes: 3,852
- 25 to 29 minutes: 2,209
- 30 to 34 minutes: 3,179
- 35 to 39 minutes: 547
- 40 to 44 minutes: 619
- 45 to 59 minutes: 632
- 60 to 89 minutes: 199
- 90 or more minutes: 185
Means of transportation to work:
- Drove a car alone: 15,303 (86.9%)
- Carpooled: 1,225 (7.0%)
- Bus or trolley bus: 122 (0.7%)
- Subway or elevated: 11 (0.1%)
- Taxi: 4 (0.0%)
- Bicycle: 13 (0.1%)
- Walked: 115 (0.7%)
- Other means: 87 (0.5%)
- Worked at home: 731 (4.2%)
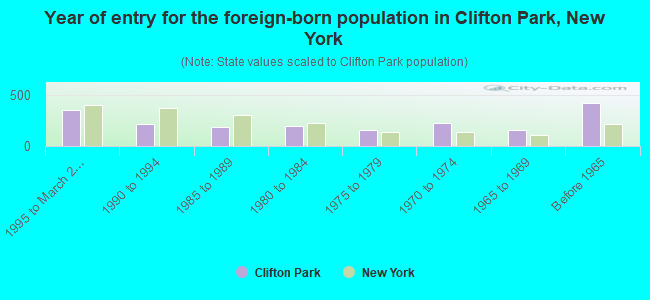
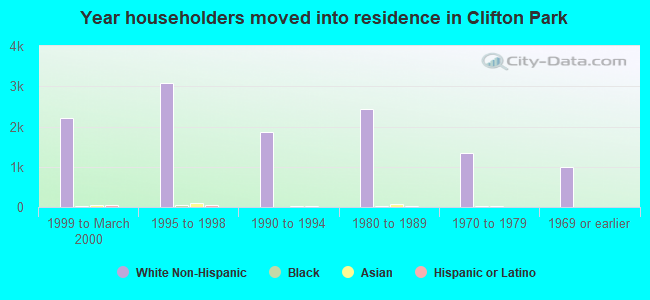
- Year of entry for the foreign-born population in Clifton Park, New York
- 3501995 to March 2000
- 2121990 to 1994
- 1891985 to 1989
- 2001980 to 1984
- 1551975 to 1979
- 2281970 to 1974
- 1591965 to 1969
- 420Before 1965
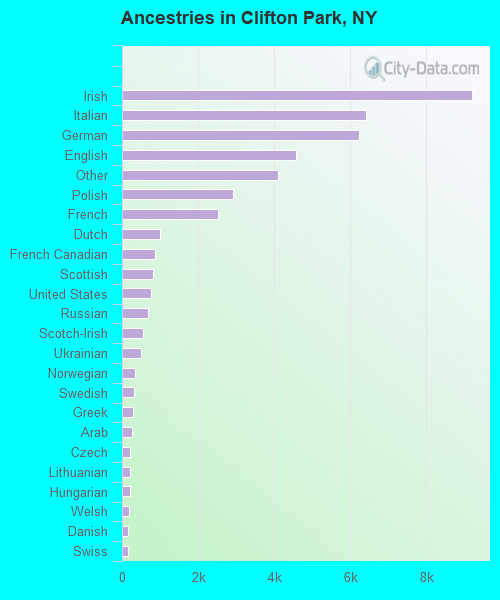
First ancestries reported:
- Irish: 9,197 (21.1%)
- Italian: 6,419 (14.7%)
- German: 6,247 (14.3%)
- English: 4,567 (10.5%)
- Other: 4,099 (9.4%)
- Polish: 2,908 (6.7%)
- French: 2,526 (5.8%)
- Dutch: 1,007 (2.3%)
- French Canadian: 881 (2.0%)
- Scottish: 807 (1.9%)
- United States: 757 (1.7%)
- Russian: 679 (1.6%)
- Scotch-Irish: 559 (1.3%)
- Ukrainian: 492 (1.1%)
- Norwegian: 337 (0.8%)
- Swedish: 308 (0.7%)
- Greek: 284 (0.7%)
- Arab: 263 (0.6%)
- Czech: 202 (0.5%)
- Lithuanian: 200 (0.5%)
- Hungarian: 198 (0.5%)
- Welsh: 190 (0.4%)
- Danish: 164 (0.4%)
- Swiss: 153 (0.4%)
- Slovak: 74 (0.2%)
- West Indian: 39 (0.09%)
- Portuguese: 30 (0.07%)
- Subsaharan African: 20 (0.05%)
Most common places of birth for foreign-born residents (%):
| Clifton Park: | 16.2% (310) |
| New York: | 3.0% (117,238) |
| Clifton Park: | 9.5% (181) |
| New York: | 1.4% (54,876) |
| Clifton Park: | 7.7% (148) |
| New York: | 2.5% (97,933) |
| Clifton Park: | 7.0% (133) |
| New York: | 3.8% (147,729) |
| Clifton Park: | 6.7% (129) |
| New York: | 1.8% (69,327) |
| Clifton Park: | 4.8% (92) |
| New York: | 6.0% (233,766) |
| Clifton Park: | 4.3% (82) |
| New York: | 1.6% (62,237) |
| Clifton Park: | 4.1% (78) |
| New York: | 1.3% (51,055) |
| Clifton Park: | 3.0% (57) |
| New York: | 0.7% (25,688) |
| Clifton Park: | 2.8% (54) |
| New York: | 0.5% (20,310) |
| Clifton Park: | 2.6% (50) |
| New York: | 0.6% (23,797) |
| Clifton Park: | 2.2% (42) |
| New York: | 1.1% (41,934) |
| Clifton Park: | 2.1% (41) |
| New York: | 2.4% (94,595) |
| Clifton Park: | 2.1% (41) |
| New York: | 0.4% (17,323) |
| Clifton Park: | 1.9% (36) |
| New York: | 2.4% (93,187) |
| Clifton Park: | 1.8% (35) |
| New York: | 1.4% (53,825) |
| Clifton Park: | 1.7% (32) |
| New York: | 0.5% (19,907) |
| Clifton Park: | 1.6% (30) |
| New York: | 0.8% (30,473) |
| Clifton Park: | 1.5% (29) |
| New York: | 0.9% (36,642) |
Place of birth for U.S.-born residents:
- This state: 23,375
- Other state: 7,368
- Northeast: 3,969
- Midwest: 1,555
- South: 1,336
- West: 508
60% of Clifton Park residents lived in the same house 5 years ago.
Out of people who lived in different houses, 38% lived in this county.
Out of people who lived in different counties, 65% lived in New York.
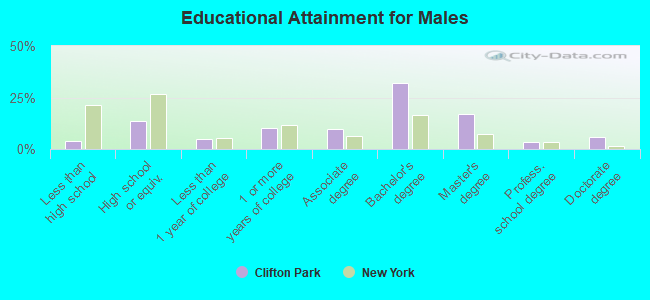
Education attainment for males 25 years and older:
- No schooling: 43
- Nursery to 4th grade: 8
- 5th and 6th grade: 5
- 7th and 8th grade: 102
- 9th grade: 56
- 10th grade: 52
- 11th grade: 47
- 12th grade, no diploma: 111
- High school graduate (or equivalency): 1,463
- Less than 1 year of college: 533
- Some college more than 1 year, no degree: 1,081
- Associate degree: 1,046
- Bachelor's degree: 3,481
- Master's degree: 1,815
- Professional school degree: 349
- Doctorate degree: 632
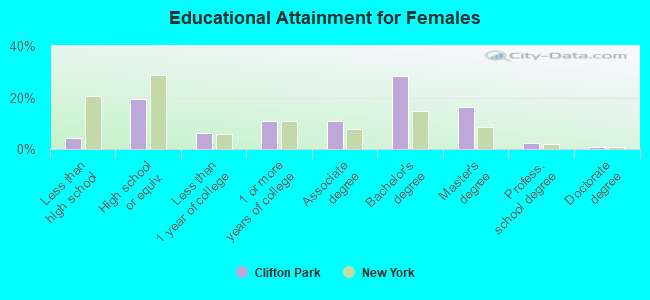
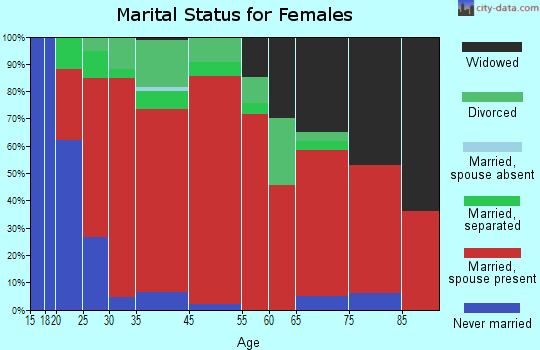
Education attainment for females 25 years and older:
- No schooling: 39
- Nursery to 4th grade: 5
- 5th and 6th grade: 14
- 7th and 8th grade: 50
- 9th grade: 46
- 10th grade: 119
- 11th grade: 48
- 12th grade, no diploma: 181
- High school graduate (or equivalency): 2,288
- Less than 1 year of college: 714
- Some college more than 1 year, no degree: 1,288
- Associate degree: 1,283
- Bachelor's degree: 3,332
- Master's degree: 1,919
- Professional school degree: 286
- Doctorate degree: 87
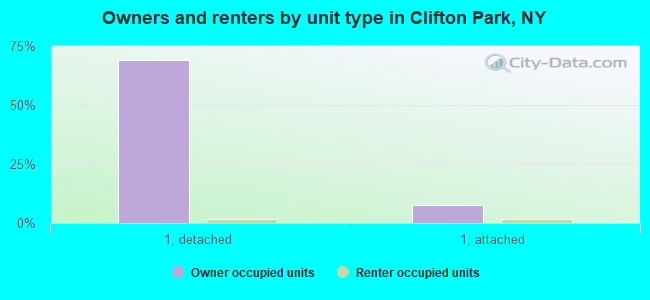
Housing units in structures:
- One, detached: 9,096
- One, attached: 1,294
- Two: 180
- 3 or 4: 330
- 5 to 9: 754
- 10 to 19: 1,095
- 20 to 49: 116
- 50 or more: 173
- Mobile homes: 31
Median worth of mobile homes: $176,111
Housing units lacking complete kitchen facilities: 0.1%
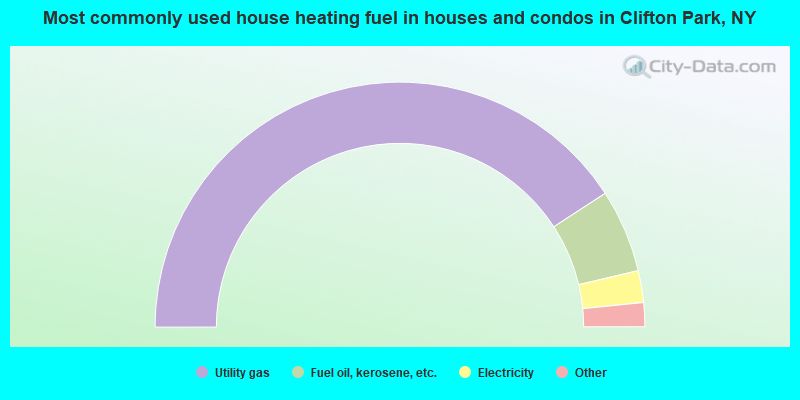
- 81.7%Utility gas
- 11.0%Fuel oil, kerosene, etc.
- 4.2%Electricity
- 1.6%Bottled, tank, or LP gas
- 1.3%Wood
- 0.2%Other fuel
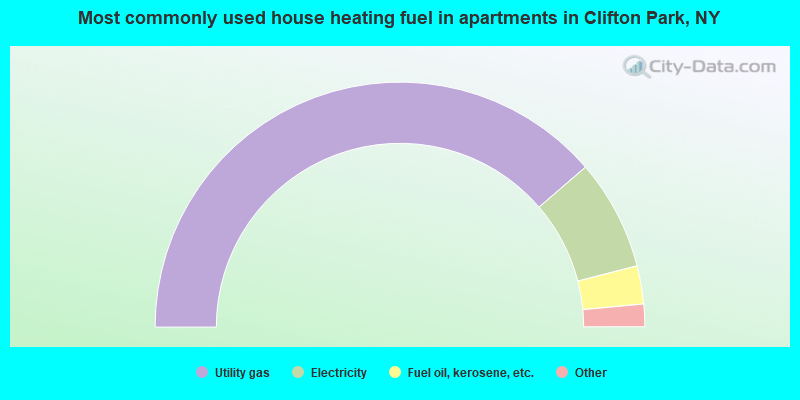
- 77.3%Utility gas
- 14.6%Electricity
- 5.0%Fuel oil, kerosene, etc.
- 1.5%Bottled, tank, or LP gas
- 0.9%Other fuel
- 0.3%Coal or coke
- 0.3%No fuel used
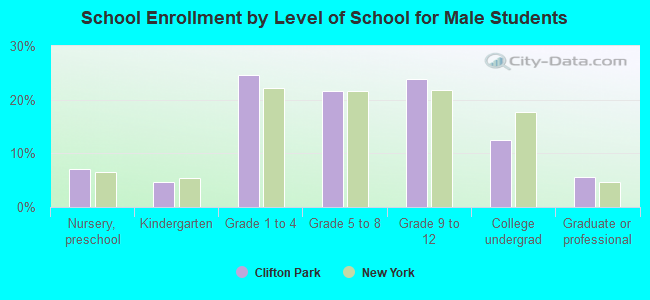
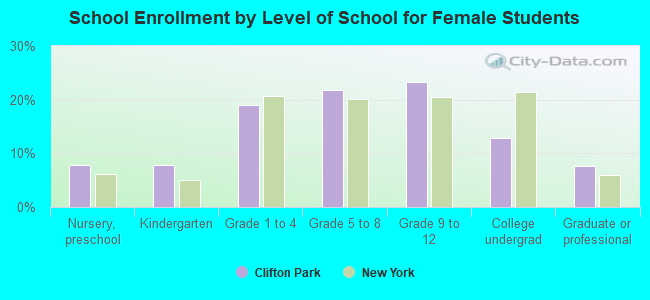
Private vs. public school enrollment:
| Here: | 8.4% |
| New York: | 14.0% |
| Here: | 10.7% |
| New York: | 13.2% |
| Here: | 30.6% |
| New York: | 38.2% |