Clifton, IL (Illinois) Houses and Residents
| Clifton: | $178,361 |
| Illinois: | $251,600 |
Mean price in 2022:
Detached houses: $183,500
Here: $183,500 State: $310,164 Mobile homes: $71,176
Here: $71,176 State: $78,855
Total population: 1,420 (Urban population: 0, Rural population: 1,326 (10 farm, 1,316 nonfarm))
Houses: 583 (557 occupied: 406 owner occupied, 158 renter occupied)
| % of renters here: | 28% |
| State: | 33% |
Housing density: 657 houses/condos per square mile
Median price asked for vacant for-sale houses and condos in 2022 in this county: $83,765.
Median contract rent in 2022: $712 (lower quartile is $599, upper quartile is $877)
Median rent asked for vacant for-rent units in 2022: $868
Median gross rent in Clifton, IL in 2022: $853
Housing units in Clifton with a mortgage: 242 (31 second mortgage, 0 home equity loan, 24 both second mortgage and home equity loan)
Houses without a mortgage: 3
Median household income for houses/condos with a mortgage: $113,626
Median household income for apartments without a mortgage: $74,134
Median monthly housing costs: $918
Compare current foreclosures near Clifton, IL:
| Photo | Address | Area | Beds / Baths | Price | Details |
|---|---|---|---|---|---|

|
#1
N La Rocque River Dr
Clifton, IL 60927
|
- sq. feet
|
- baths - beds |
show details | |

|
#2
S Cleveland Ave
Bradley, IL 60915
|
1,200 sq. feet
|
1 baths 2 beds |
$103,900
|
show details |

|
#3
Jordan Dr
Bourbonnais, IL 60914
|
936 sq. feet
|
1 baths 3 beds |
$187,000
|
show details |

|
#4
Heather Rd E
Bourbonnais, IL 60914
|
- sq. feet
|
2 baths 3 beds |
$297,400
|
show details |

|
#5
N Raub Ave
Donovan, IL 60931
|
2,012 sq. feet
|
2 baths 3 beds |
show details | |

|
#6
S Curtis Ave
Kankakee, IL 60901
|
1,210 sq. feet
|
2 baths 4 beds |
show details | |

|
#7
N 2nd St
Watseka, IL 60970
|
- sq. feet
|
2 baths 3 beds |
show details | |

|
#8
S 4th Ave
Kankakee, IL 60901
|
- sq. feet
|
1 baths 2 beds |
show details | |

|
#9
W Vanmeter St
Kankakee, IL 60901
|
1,771 sq. feet
|
2 baths 3 beds |
show details | |

|
#10
N Chicago St
Watseka, IL 60970
|
- sq. feet
|
- baths - beds |
$27,900
|
show details |
| Photo | Address | Area | Beds / Baths | Price | Details |
|---|---|---|---|---|---|

|
#11
S Douglas Ave
Bradley, IL 60915
|
852 sq. feet
|
1 baths 3 beds |
show details | |

|
#12
E Fine St
Ashkum, IL 60911
|
1,551 sq. feet
|
1 baths 2 beds |
show details | |

|
#13
N Oak St
Herscher, IL 60941
|
1,260 sq. feet
|
2 baths 3 beds |
show details | |

|
#14
West Second South Street
Chebanse, IL 60922
|
1,288 sq. feet
|
2 baths 3 beds |
show details | |

|
#15
W River St
Bourbonnais, IL 60914
|
2,136 sq. feet
|
2 baths 4 beds |
show details | |

|
#16
S Small Ave
Kankakee, IL 60901
|
1,020 sq. feet
|
1 baths 2 beds |
show details | |

|
#17
S Mckinley Ave
Kankakee, IL 60901
|
- sq. feet
|
1 baths 2 beds |
show details | |

|
#18
Strasma W Dr
Kankakee, IL 60901
|
- sq. feet
|
2 baths 4 beds |
show details | |

|
#19
Heritage Dr
Bourbonnais, IL 60914
|
- sq. feet
|
- baths - beds |
show details | |

|
#20
Donovan St
Beaverville, IL 60912
|
- sq. feet
|
- baths - beds |
show details |
| Photo | Address | Area | Beds / Baths | Price | Details |
|---|---|---|---|---|---|

|
#21
W Hickory St
Kankakee, IL 60901
|
- sq. feet
|
- baths - beds |
show details | |

|
#22
Plum Creek Ct Apt B
Bourbonnais, IL 60914
|
- sq. feet
|
- baths - beds |
show details | |

|
#23
S Western Ave
Watseka, IL 60970
|
- sq. feet
|
- baths - beds |
show details | |

|
#24
E Mulberry St
Watseka, IL 60970
|
- sq. feet
|
- baths - beds |
show details | |

|
#25
Apache Path
Kankakee, IL 60901
|
- sq. feet
|
- baths - beds |
show details | |

|
#26
William R Latham Sr Dr # 3
Bourbonnais, IL 60914
|
- sq. feet
|
- baths - beds |
show details | |

|
#27
N Fairmont Ave
Kankakee, IL 60901
|
- sq. feet
|
- baths - beds |
show details | |

|
#28
N Schuyler Ave Apt 1
Kankakee, IL 60901
|
- sq. feet
|
- baths - beds |
show details | |

|
#29
W Mertens St
Kankakee, IL 60901
|
- sq. feet
|
- baths - beds |
show details | |

|
#30
N 9th Ave
Kankakee, IL 60901
|
- sq. feet
|
- baths - beds |
show details |
| Photo | Address | Area | Beds / Baths | Price | Details |
|---|---|---|---|---|---|

|
#31
S 4th Ave
Kankakee, IL 60901
|
- sq. feet
|
- baths - beds |
show details | |

|
#32
Fox Trail Ct
Bourbonnais, IL 60914
|
- sq. feet
|
- baths - beds |
show details | |

|
#33
E River St Apt 406
Kankakee, IL 60901
|
- sq. feet
|
- baths - beds |
show details | |

|
#34
S Prairie Ave
Bradley, IL 60915
|
- sq. feet
|
- baths - beds |
show details | |

|
#35
Girard Way Apt 1
Bourbonnais, IL 60914
|
- sq. feet
|
- baths - beds |
show details | |

|
#36
Yount Ave
Watseka, IL 60970
|
- sq. feet
|
- baths - beds |
show details | |

|
#37
Emery Dr
Bourbonnais, IL 60914
|
- sq. feet
|
- baths - beds |
show details | |

|
#38
E Dent St
Gilman, IL 60938
|
- sq. feet
|
- baths - beds |
show details | |

|
#39
S 6th Ave
Kankakee, IL 60901
|
- sq. feet
|
- baths - beds |
show details | |

|
#40
S Schuyler Ave
Bradley, IL 60915
|
- sq. feet
|
- baths - beds |
show details |
| Photo | Address | Area | Beds / Baths | Price | Details |
|---|---|---|---|---|---|

|
#41
E Bethel Dr
Bourbonnais, IL 60914
|
- sq. feet
|
- baths - beds |
show details | |

|
#42
S 4th Ave
Kankakee, IL 60901
|
- sq. feet
|
- baths - beds |
show details | |

|
#43
S 6th Ave
Kankakee, IL 60901
|
- sq. feet
|
- baths - beds |
show details | |

|
#44
Lemna Ave Apt 1
Bourbonnais, IL 60914
|
- sq. feet
|
- baths - beds |
show details | |

|
#45
Potomac Pl Apt 2
Bourbonnais, IL 60914
|
- sq. feet
|
- baths - beds |
show details | |

|
#46
N Boughton St
Watseka, IL 60970
|
- sq. feet
|
- baths - beds |
show details | |

|
#47
Durham St
Bradley, IL 60915
|
- sq. feet
|
- baths - beds |
show details | |

|
#48
Sunset View Ln
Kankakee, IL 60901
|
- sq. feet
|
- baths - beds |
show details | |

|
#49
Ash Dr
Saint Anne, IL 60964
|
- sq. feet
|
- baths - beds |
show details | |

|
Check over 1 million property listings on Foreclosure.com!
|
browse all offers | |||

Latest news about housing in Clifton, IL collected exclusively by city-data.com from local newspapers, TV, and radio stations

 | What city is most similar to Chicago? (75 replies) |
| Need recommendation- Park Ridge, Downers Grove, LGP, Western Springs (6 replies) |
| Violence reaching the North side? (126 replies) |
| LAKEVIEW CRIME WAVE CONTINUES: 7 robbed overnight by gun (291 replies) |
| What made Lincoln Park go from a "bad" area to a "yuppie" area? (91 replies) |
| Why is UpTown considered bad? (180 replies) |

Median year apartment built: 1959
Household type by relationship:
Households: 1,275- Male householders: 269 (113 living alone), Female householders: 278 (87 living alone)
297 spouses (297 opposite-sex spouses), 23 unmarried partners, (23 opposite-sex unmarried partners), 358 children (353 natural, 0 adopted, 5 stepchildren), 16 grandchildren, 7 brothers or sisters, 9 parents, 0 foster children, 5 other relatives, 5 non-relatives
Size of family households: 151 2-persons, 49 3-persons, 92 4-persons, 21 5-persons, 16 6-persons, 2 7-or-more-persons.
Size of nonfamily households: 211 1-person, 18 2-persons, 2 3-persons.
258 married couples with children.
24 single-parent households (5 men, 19 women).
98.6% of residents of Clifton speak English at home.
0.4% of residents speak Spanish at home (100% speak English very well).
0.2% of residents speak other Indo-European language at home (50% speak English very well, 50% speak English well).
Foreign born population: 1 (0.1%)
(0.0% of them are naturalized citizens)
| Here: | 6.4 |
| State: | 6.4 |
| Here: | 4.0 |
| State: | 4.1 |

- Bedrooms in owner-occupied houses and condos in Clifton, Illinois
- 0no bedroom
- 71 bedroom
- 632 bedrooms
- 2443 bedrooms
- 714 bedrooms
- 205+ bedrooms

- Bedrooms in renter-occupied apartments in Clifton, Illinois
- 3no bedroom
- 121 bedroom
- 972 bedrooms
- 433 bedrooms
- 44 bedrooms
- 05+ bedrooms

- Cars and other vehicles available in Clifton in owner-occupied houses/condos
- 5no vehicle
- 881 vehicle
- 1512 vehicles
- 883 vehicles
- 714 vehicles
- 45+ vehicles

- Cars and other vehicles available in Clifton in renter-occupied apartments
- 28no vehicle
- 931 vehicle
- 382 vehicles
- 03 vehicles
- 04 vehicles
- 05+ vehicles

- Rooms in owner-occupied houses in Clifton, Illinois
- 01 room
- 02 rooms
- 43 rooms
- 234 rooms
- 745 rooms
- 1116 rooms
- 737 rooms
- 428 rooms
- 789+ rooms

- Rooms in renter-occupied apartments in Clifton, Illinois
- 01 room
- 32 rooms
- 473 rooms
- 534 rooms
- 155 rooms
- 106 rooms
- 187 rooms
- 88 rooms
- 49+ rooms


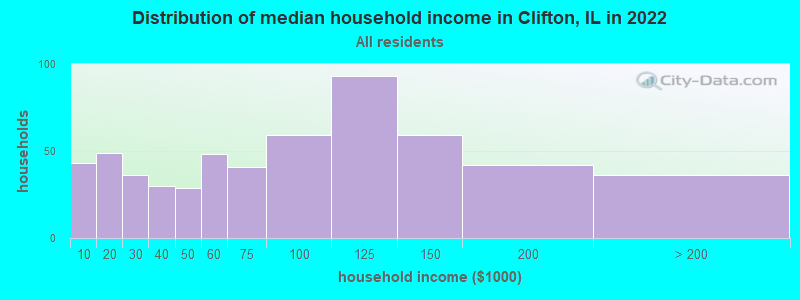
Clifton, IL household income distribution

- 43Less than $10,000
- 49$10,000 to $19,999
- 36$20,000 to $29,999
- 30$30,000 to $39,999
- 29$40,000 to $49,999
- 48$50,000 to $59,999
- 41$60,000 to $74,999
- 59$75,000 to $99,999
- 93$100,000 to $124,999
- 59$125,000 to $149,999
- 42$150,000 to $199,999
- 36$200,000 or more
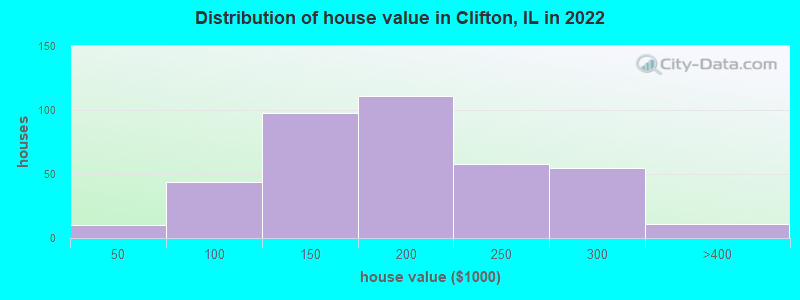
Home value of owner - occupied houses in 2022 in Clifton, IL
-
- 6Less than $10,000
- 3$10,000 to $14,999
- 0$40,000 to $49,999
- 13$60,000 to $69,999
- 2$70,000 to $79,999
- 9$80,000 to $89,999
- 18$90,000 to $99,999
- 43$100,000 to $124,999
- 54$125,000 to $149,999
- 50$150,000 to $174,999
- 60$175,000 to $199,999
- 57$200,000 to $249,999
- 54$250,000 to $299,999
- 9$300,000 to $399,999
- 2$400,000 to $499,999
Rent paid by renters in 2022 in Clifton, IL
-
- 3$400 to $449
- 7$450 to $499
- 16$550 to $599
- 34$600 to $649
- 3$650 to $699
- 20$700 to $749
- 3$750 to $799
- 30$800 to $899
- 21$900 to $999
- 6$1,000 to $1,249
- 3$1,250 to $1,499
- 5No cash rent


Percentage of workers working in this county: 24.5%
Number of people working at home: 47 (6.8% of all workers)
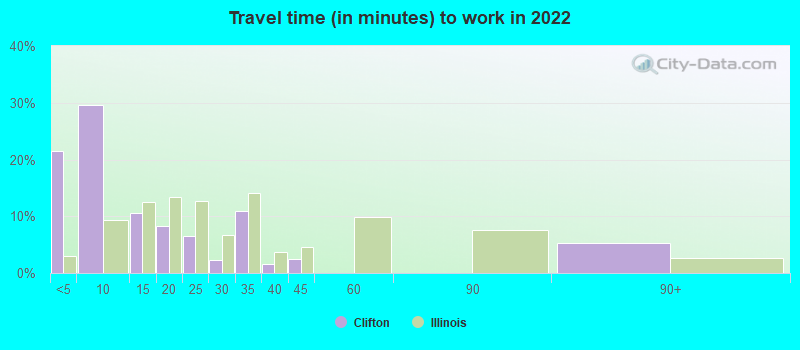
Travel time to work (commute)
- Less than 5 minutes: 20
- 5 to 9 minutes: 69
- 10 to 14 minutes: 40
- 15 to 19 minutes: 59
- 20 to 24 minutes: 109
- 25 to 29 minutes: 143
- 30 to 34 minutes: 64
- 35 to 39 minutes: 14
- 40 to 44 minutes: 47
- 45 to 59 minutes: 27
- 60 to 89 minutes: 27
- 90 or more minutes: 6
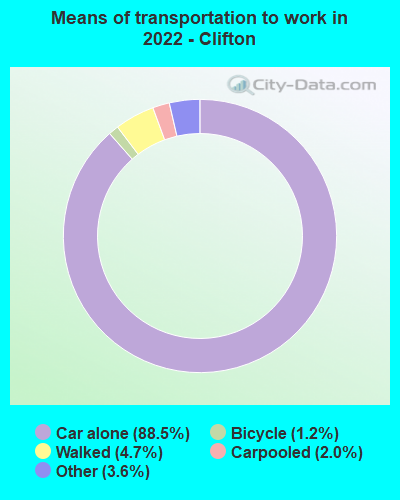
Means of transportation to work:
- Drove a car alone: 213 (72.2%)
- Carpooled: 4 (1.4%)
- Taxi: 11 (3.7%)
- Bicycle: 2 (0.7%)
- Walked: 10 (3.4%)
- Worked at home: 105 (35.6%)

- Unemployment by race in 2022
- Unemployment rate for White non-Hispanic residents
- 2.5%Males
- 1.3%Females

- Year of entry for the foreign-born population in Clifton, Illinois
- 12010 or later
- 02000 to 2009
- 01990 to 1999
- 01980 to 1989
- 41970 to 1979
- 6Before 1970

First ancestries reported:
- American: 125 (25.2%)
- German: 104 (20.9%)
- French: 81 (16.3%)
- Irish: 43 (8.7%)
- English: 41 (8.3%)
- French Canadian: 19 (3.8%)
- Italian: 12 (2.4%)
- Ukrainian: 11 (2.2%)
- British: 10 (2.0%)
- Polish: 8 (1.6%)
- Danish: 7 (1.4%)
- Norwegian: 2 (0.4%)
- Scotch-Irish: 2 (0.4%)
- Croatian: 1 (0.2%)
- Welsh: 1 (0.2%)
Most common places of birth for foreign-born residents (%):
| Clifton: | 100.0% (1) |
| Illinois: | 0.2% (3,977) |
Place of birth for U.S.-born residents:
- This state: 1,148
- Other state: 114
- Northeast: 0
- Midwest: 33
- South: 59
- West: 20
89.9% of Clifton residents lived in the same house 1 years ago.
Out of people who lived in different houses, 25.9% lived in this county.
Out of people who lived in different counties, 97.7% lived in Illinois.
| Clifton: | 89.9% |
| State average: | 88.3% |
Education attainment for males 25 years and older:
- No schooling: 0
- Nursery to 4th grade: 0
- 5th and 6th grade: 2
- 7th and 8th grade: 0
- 9th grade: 0
- 10th grade: 7
- 11th grade: 2
- 12th grade, no diploma: 6
- High school graduate (or equivalency): 232
- Less than 1 year of college: 33
- Some college more than 1 year, no degree: 26
- Associate degree: 71
- Bachelor's degree: 81
- Master's degree: 14
- Professional school degree: 1
- Doctorate degree: 0

Education attainment for females 25 years and older:
- No schooling: 0
- Nursery to 4th grade: 0
- 5th and 6th grade: 0
- 7th and 8th grade: 0
- 9th grade: 2
- 10th grade: 0
- 11th grade: 3
- 12th grade, no diploma: 6
- High school graduate (or equivalency): 134
- Less than 1 year of college: 45
- Some college more than 1 year, no degree: 67
- Associate degree: 59
- Bachelor's degree: 47
- Master's degree: 62
- Professional school degree: 0
- Doctorate degree: 0


Housing units in structures:
- One, detached: 490
- Two: 2
- 3 or 4: 22
- 5 to 9: 57
- Mobile homes: 12
House/condo owner moved in on average 11 years ago
Renter moved in on average 5 years ago

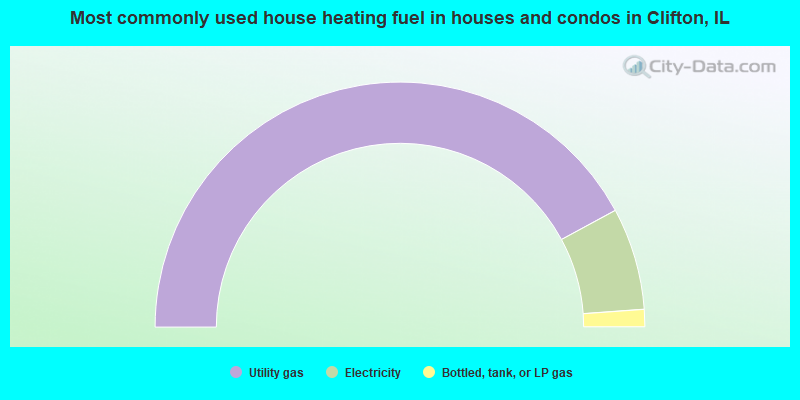
- 84.2%Utility gas
- 13.5%Electricity
- 2.3%Bottled, tank, or LP gas
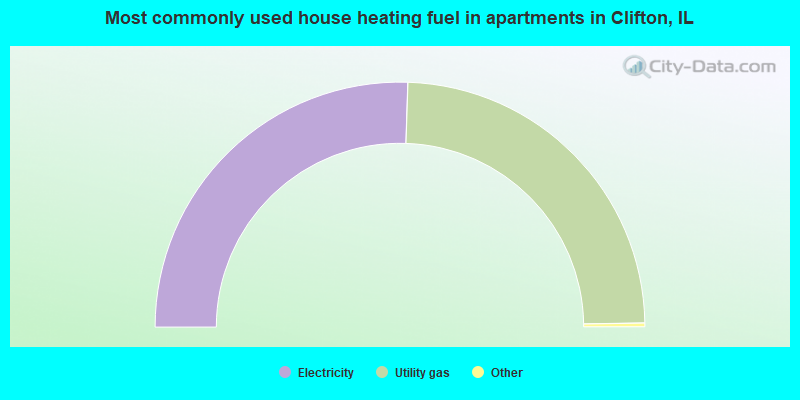
- 51.3%Electricity
- 48.7%Utility gas
Private vs. public school enrollment:
| Here: | 4.0% |
| Illinois: | 13.3% |
| Here: | 0.0% |
| Illinois: | 9.9% |
| Here: | 0.0% |
| Illinois: | 27.4% |


