Cleveland Heights, OH (Ohio) Houses and Residents
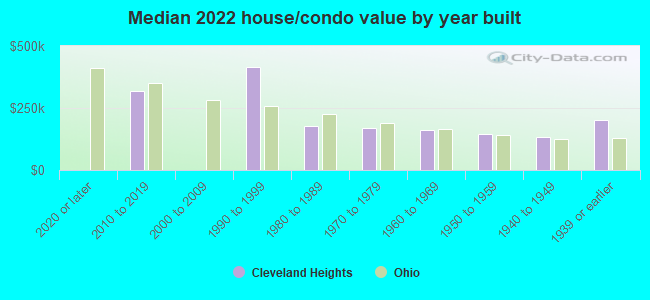
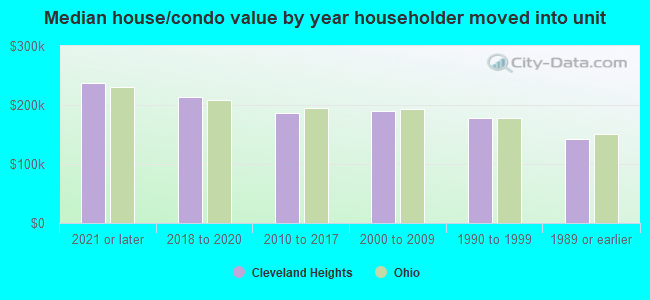
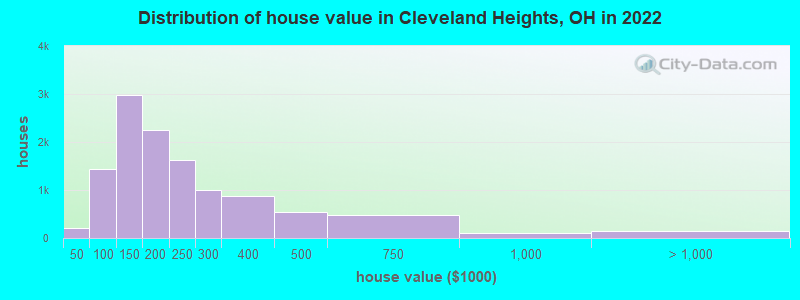
Estimated median house or condo value in 2022: $181,649 (it was $110,100 in 2000 )
Cleveland Heights:
$181,649Ohio:
$204,100
Lower value quartile - upper value quartile: $127,080 - $262,293Mean price in 2022: Detached houses: $237,043 Here:
$237,043State:
$254,366
Townhouses or other attached units: $305,508 Here:
$305,508State:
$225,733
In 2-unit structures: $164,587 Here:
$164,587State:
$144,384
In 3-to-4-unit structures: $156,232 Here:
$156,232State:
$203,002
In 5-or-more-unit structures: $353,064 Here:
$353,064State:
$211,593
Mobile homes: $52,468 Here:
$52,468State:
$62,719
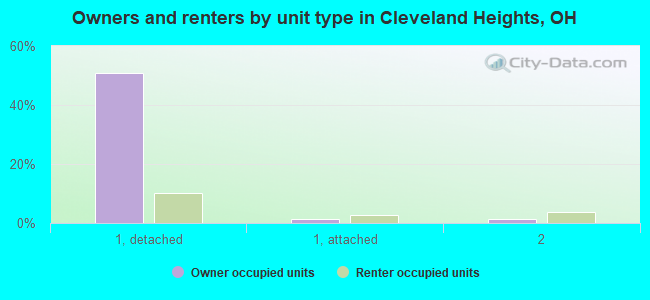
Total population: 45,181 (All urban)
Houses: 21,666 (19,437 occupied: 11,451 owner occupied, 8,100 renter occupied )
% of renters here:
41%State:
33%
Housing density: 2,672 houses/condos per square mile
Median price asked for vacant for-sale houses and condos in 2022: $254,891.
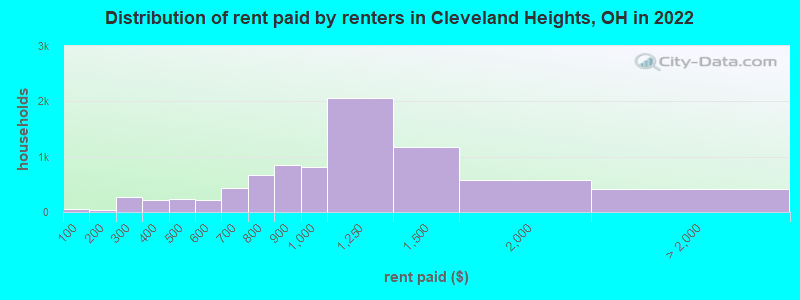
Median contract rent in 2022: $979 (lower quartile is $782, upper quartile is $1,290)
Median rent asked for vacant for-rent units in 2022: $1,008
Median gross rent in Cleveland Heights, OH in 2022: $1,118
Housing units in Cleveland Heights with a mortgage: 7,176 (986 second mortgage, 132 home equity loan, 786 both second mortgage and home equity loan )Houses without a mortgage: 571
Median household income for houses/condos with a mortgage: $103,375
Median household income for apartments without a mortgage: $72,515
Median monthly housing costs: $1,209
Data:
Median house or condo value ($)
Median house or condo value ($ change since 2000)
Median house or condo value ($) - White
Median house or condo value ($) - Black or African American
Median house or condo value ($) - Asian
Median house or condo value ($) - Hispanic or Latino
Median house or condo value ($) - American Indian and Alaska Native
Median house or condo value ($) - Multirace
Median house or condo value ($) - Other Race
Median price asked for mobile homes ($)
Household density (households per square mile)
Mean house or condo value by units in structure - 1, detached ($)
Mean house or condo value by units in structure - 1, attached ($)
Mean house or condo value by units in structure - 2 ($)
Mean house or condo value by units in structure by units in structure - 3 or 4 ($)
Mean house or condo value by units in structure - 5 or more ($)
Mean house or condo value by units in structure - Boat, RV, van, etc. ($)
Mean house or condo value by units in structure - Mobile home ($)
Median contract rent ($)
Median contract rent - Lower quartile ($)
Median contract rent - Upper quartile ($)
Median gross rent ($)
Urban houses (%)
Rural houses (%)
Houses occupied (%)
Houses occupied (% change since 2000)
Houses owner occupied (%)
Houses owner occupied (% change since 2000)
Houses renter occupied (%)
Houses renter occupied (% change since 2000)
Vacant housing units - For rent (%)
Vacant housing units - For rent (% change since 2000)
Vacant housing units - For sale only (%)
Vacant housing units - For sale only (% change since 2000)
Vacant housing units - Rented or sold, not occupied (%)
Vacant housing units - Rented or sold, not occupied (% change since 2000)
Vacant housing units - For seasonal, recreational, or occasional use (%)
Vacant housing units - For seasonal, recreational, or occasional use (% change since 2000)
Vacant housing units - For migrant workers (%)
Vacant housing units - For migrant workers (% change since 2000)
Vacant housing units - Other vacant (%)
Vacant housing units - Other vacant (% change since 2000)
Median monthly housing costs ($)
Median household income for houses/condos with a mortgage ($)
Median household income for houses/condos without a mortgage ($)
Median household income ($)
Median household income ($) - White
Median household income ($) - Black or African American
Median household income ($) - Asian
Median household income ($) - Hispanic or Latino
Median household income ($) - American Indian and Alaska Native
Median household income ($) - Multirace
Median household income ($) - Other Race
Mortgage status - with mortgage (%)
Mortgage status - with second mortgage (%)
Mortgage status - with home equity loan (%)
Mortgage status - with both second mortgage and home equity loan (%)
Mortgage status - without a mortgage (%)
Median year house/condo built
Median year apartment built
Household type by relationship - Male householder living alone (%)
Household type by relationship - Male householder not living alone (%)
Household type by relationship - Female householder living alone (%)
Household type by relationship - Female householder not living alone (%)
Household type by relationship - Opposite-Sex spouse (%)
Household type by relationship - Same-Sex spouse (%)
Household type by relationship - Opposite-Sex unmarried partner (%)
Household type by relationship - Same-Sex unmarried partner (%)
Household type by relationship - In group quarters (%)
Size of family households - 2-person household (%)
Size of family households - 3-person household (%)
Size of family households - 4-person household (%)
Size of family households - 5-person household (%)
Size of family households - 6-person household (%)
Size of family households - 7-or-more-person household (%)
Size of nonfamily households - 1-person household (%)
Size of nonfamily households - 2-person household (%)
Size of nonfamily households - 3-person household (%)
Size of nonfamily households - 4-person household (%)
Size of nonfamily households - 5-person household (%)
Size of nonfamily households - 6-person household (%)
Size of nonfamily households - 7-or-moreperson household (%)
Year house built - Built 2010 or later (%)
Year house built - Built 2000 to 2009 (%)
Year house built - Built 1990 to 1999 (%)
Year house built - Built 1980 to 1989 (%)
Year house built - Built 1970 to 1979 (%)
Year house built - Built 1960 to 1969 (%)
Year house built - Built 1950 to 1959 (%)
Year house built - Built 1940 to 1949 (%)
Year house built - Built 1939 or earlier (%)
Median number of rooms in houses and condos
Median number of rooms in apartments
Median number of bedrooms in owner occupied houses
Mean number of bedrooms in owner occupied houses
Median number of bedrooms in renter occupied houses
Mean number of bedrooms in renter occupied houses
Median number of vehichles in owner occupied houses
Mean number of vehichles in owner occupied houses
Median number of vehichles in renter occupied houses
Mean number of vehichles in renter occupied houses
Rooms in owner-occupied houses - 1 room (%)
Rooms in owner-occupied houses - 2 rooms (%)
Rooms in owner-occupied houses - 3 rooms (%)
Rooms in owner-occupied houses - 4 rooms (%)
Rooms in owner-occupied houses - 5 rooms (%)
Rooms in owner-occupied houses - 6 rooms (%)
Rooms in owner-occupied houses - 7 rooms (%)
Rooms in owner-occupied houses - 8 rooms (%)
Rooms in owner-occupied houses - 9+ rooms (%)
Rooms in renter-occupied houses - 1 room (%)
Rooms in renter-occupied houses - 2 rooms (%)
Rooms in renter-occupied houses - 3 rooms (%)
Rooms in renter-occupied houses - 4 rooms (%)
Rooms in renter-occupied houses - 5 rooms (%)
Rooms in renter-occupied houses - 6 rooms (%)
Rooms in renter-occupied houses - 7 rooms (%)
Rooms in renter-occupied houses - 8 rooms (%)
Rooms in renter-occupied houses - 9+ rooms (%)
Bedrooms in owner-occupied houses - no bedrooms (%)
Bedrooms in owner-occupied houses - 1 bedroom (%)
Bedrooms in owner-occupied houses - 2 bedrooms (%)
Bedrooms in owner-occupied houses - 3 bedrooms (%)
Bedrooms in owner-occupied houses - 4 bedrooms (%)
Bedrooms in owner-occupied houses - 5+ bedrooms (%)
Bedrooms in renter-occupied houses - no bedrooms (%)
Bedrooms in renter-occupied houses - 1 bedroom (%)
Bedrooms in renter-occupied houses - 2 bedrooms (%)
Bedrooms in renter-occupied houses - 3 bedrooms (%)
Bedrooms in renter-occupied houses - 4 bedrooms (%)
Bedrooms in renter-occupied houses - 5+ bedrooms (%)
Vehicles available in owner-occupied houses - no vehicle available (%)
Vehicles available in owner-occupied houses - 1 vehicle available(%)
Vehicles available in owner-occupied houses - 2 Vehicles available (%)
Vehicles available in owner-occupied houses - 3 Vehicles available (%)
Vehicles available in owner-occupied houses - 4 Vehicles available (%)
Vehicles available in owner-occupied houses - 5+ Vehicles available (%)
Vehicles available in renter-occupied houses - no vehicle available (%)
Vehicles available in renter-occupied houses - 1 vehicle available (%)
Vehicles available in renter-occupied houses - 2 Vehicles available (%)
Vehicles available in renter-occupied houses - 3 Vehicles available (%)
Vehicles available in renter-occupied houses - 4 Vehicles available (%)
Vehicles available in renter-occupied houses - 5+ Vehicles available (%)
Housing units in structures - 1, detached (%)
Housing units in structures - 1, attached (%)
Housing units in structures - 2 (%)
Housing units in structures - 3 or 4 (%)
Housing units in structures - 5 to 9 (%)
Housing units in structures - 10 to 19 (%)
Housing units in structures - 20 to 49 (%)
Housing units in structures - 50 or more (%)
Housing units in structures - Mobile home (%)
Housing units in structures - Boat, RV, van, etc. (%)
Housing units in structures - Owners - 1, detached (%)
Housing units in structures - Owners - 1, attached (%)
Housing units in structures - Owners - 2 (%)
Housing units in structures - Owners - 3 or 4 (%)
Housing units in structures - Owners - 5 to 9 (%)
Housing units in structures - Owners - 10 to 19 (%)
Housing units in structures - Owners - 20 to 49 (%)
Housing units in structures - Owners - 50 or more (%)
Housing units in structures - Owners - Mobile home (%)
Housing units in structures - Owners - Boat, RV, van, etc. (%)
Housing units in structures - Renters - 1, detached (%)
Housing units in structures - Renters - 1, attached (%)
Housing units in structures - Renters - 2 (%)
Housing units in structures - Renters - 3 or 4 (%)
Housing units in structures - Renters - 5 to 9 (%)
Housing units in structures - Renters - 10 to 19 (%)
Housing units in structures - Renters - 20 to 49 (%)
Housing units in structures - Renters - 50 or more (%)
Housing units in structures - Renters - Mobile home (%)
Housing units in structures - Renters - Boat, RV, van, etc. (%)
House/condo owner moved in on average (years ago)
Renter moved in on average (years ago)
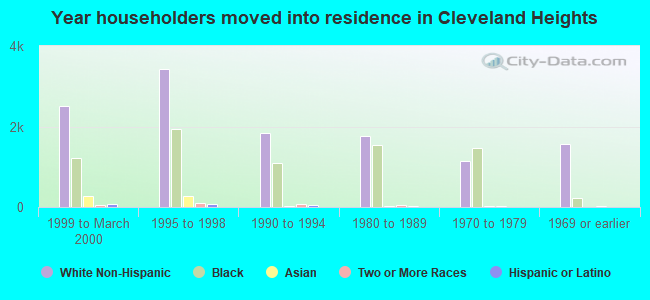
Year householder moved into unit - Moved in 1999 to March 2000 (%)
Year householder moved into unit - Moved in 1999 to March 2000 (%) - White
Year householder moved into unit - Moved in 1999 to March 2000 (%) - Black or African American
Year householder moved into unit - Moved in 1999 to March 2000 (%) - Asian
Year householder moved into unit - Moved in 1999 to March 2000 (%) - Hispanic or Latino
Year householder moved into unit - Moved in 1999 to March 2000 (%) - American Indian and Alaska Native
Year householder moved into unit - Moved in 1999 to March 2000 (%) - Multirace
Year householder moved into unit - Moved in 1999 to March 2000 (%) - Other Race
Year householder moved into unit - Moved in 1995 to 1998 (%)
Year householder moved into unit - Moved in 1995 to 1998 (%) - White
Year householder moved into unit - Moved in 1995 to 1998 (%) - Black or African American
Year householder moved into unit - Moved in 1995 to 1998 (%) - Asian
Year householder moved into unit - Moved in 1995 to 1998 (%) - Hispanic or Latino
Year householder moved into unit - Moved in 1995 to 1998 (%) - American Indian and Alaska Native
Year householder moved into unit - Moved in 1995 to 1998 (%) - Multirace
Year householder moved into unit - Moved in 1995 to 1998 (%) - Other Race
Year householder moved into unit - Moved in 1990 to 1994 (%)
Year householder moved into unit - Moved in 1990 to 1994 (%) - White
Year householder moved into unit - Moved in 1990 to 1994 (%) - Black or African American
Year householder moved into unit - Moved in 1990 to 1994 (%) - Asian
Year householder moved into unit - Moved in 1990 to 1994 (%) - Hispanic or Latino
Year householder moved into unit - Moved in 1990 to 1994 (%) - American Indian and Alaska Native
Year householder moved into unit - Moved in 1990 to 1994 (%) - Multirace
Year householder moved into unit - Moved in 1990 to 1994 (%) - Other Race
Year householder moved into unit - Moved in 1980 to 1989 (%)
Year householder moved into unit - Moved in 1980 to 1989 (%) - White
Year householder moved into unit - Moved in 1980 to 1989 (%) - Black or African American
Year householder moved into unit - Moved in 1980 to 1989 (%) - Asian
Year householder moved into unit - Moved in 1980 to 1989 (%) - Hispanic or Latino
Year householder moved into unit - Moved in 1980 to 1989 (%) - American Indian and Alaska Native
Year householder moved into unit - Moved in 1980 to 1989 (%) - Multirace
Year householder moved into unit - Moved in 1980 to 1989 (%) - Other Race
Year householder moved into unit - Moved in 1970 to 1979 (%)
Year householder moved into unit - Moved in 1970 to 1979 (%) - White
Year householder moved into unit - Moved in 1970 to 1979 (%) - Black or African American
Year householder moved into unit - Moved in 1970 to 1979 (%) - Asian
Year householder moved into unit - Moved in 1970 to 1979 (%) - Hispanic or Latino
Year householder moved into unit - Moved in 1970 to 1979 (%) - American Indian and Alaska Native
Year householder moved into unit - Moved in 1970 to 1979 (%) - Multirace
Year householder moved into unit - Moved in 1970 to 1979 (%) - Other Race
Year householder moved into unit - Moved in 1969 or earlier (%)
Year householder moved into unit - Moved in 1969 or earlier (%) - White
Year householder moved into unit - Moved in 1969 or earlier (%) - Black or African American
Year householder moved into unit - Moved in 1969 or earlier (%) - Asian
Year householder moved into unit - Moved in 1969 or earlier (%) - Hispanic or Latino
Year householder moved into unit - Moved in 1969 or earlier (%) - American Indian and Alaska Native
Year householder moved into unit - Moved in 1969 or earlier (%) - Multirace
Year householder moved into unit - Moved in 1969 or earlier (%) - Other Race
Housing units lacking complete plumbing facilities (%)
Housing units lacking complete kitchen facilities (%)
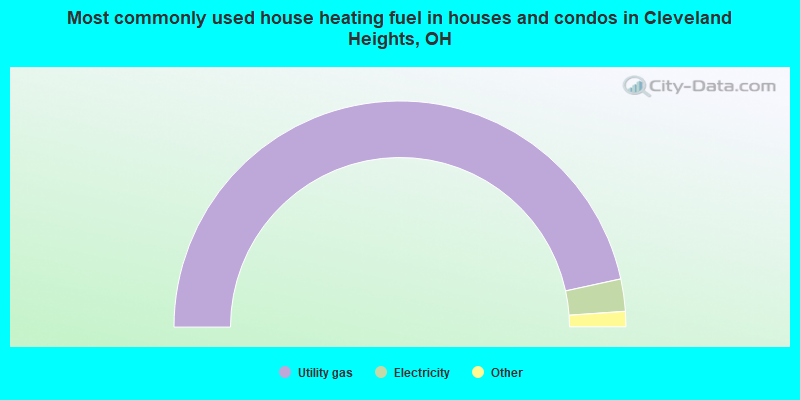
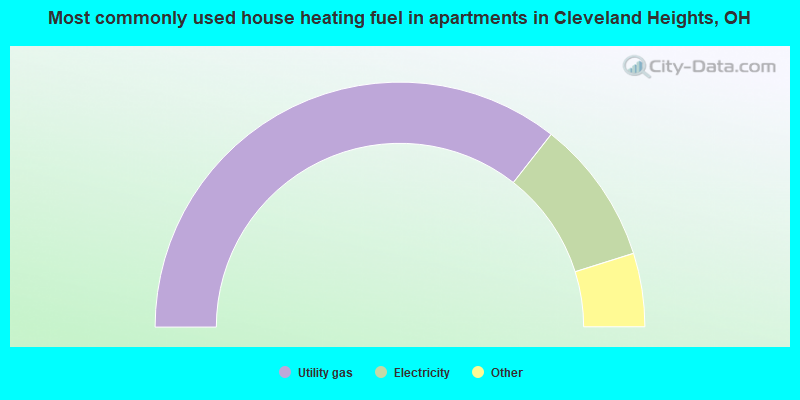
House heating fuel used in houses and condos - Utility gas (%)
House heating fuel used in houses and condos - Bottled, tank, or LP gas (%)
House heating fuel used in houses and condos - Electricity (%)
House heating fuel used in houses and condos - Fuel oil, kerosene, etc. (%)
House heating fuel used in houses and condos - Coal or coke (%)
House heating fuel used in houses and condos - Wood (%)
House heating fuel used in houses and condos - Solar energy (%)
House heating fuel used in houses and condos - Other fuel (%)
House heating fuel used in houses and condos - No fuel used (%)
House heating fuel used in apartments - Utility gas (%)
House heating fuel used in apartments - Bottled, tank, or LP gas (%)
House heating fuel used in apartments - Electricity (%)
House heating fuel used in apartments - Fuel oil, kerosene, etc. (%)
House heating fuel used in apartments - Coal or coke (%)
House heating fuel used in apartments - Wood (%)
House heating fuel used in apartments - Solar energy (%)
House heating fuel used in apartments - Other fuel (%)
House heating fuel used in apartments - No fuel used (%)
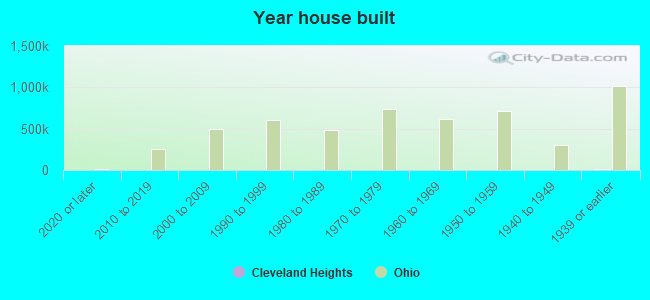
Median year house/condo built: 1938Median year apartment built: 1945Household type by relationship:
Households: 44,265
Male householders: 7,894 (2,776 living alone ), Female householders: 11,248 (4,246 living alone )6,828 spouses (6,708 opposite-sex spouses ), 1,390 unmarried partners , (1,258 opposite-sex unmarried partners ), 12,013 children (11,478 natural , 232 adopted , 302 stepchildren ), 1,159 grandchildren , 262 brothers or sisters , 357 parents , 0 foster children , 543 other relatives , 1,764 non-relatives In group quarters: 800
Size of family households: 5,385 2-persons , 2,396 3-persons , 1,527 4-persons , 665 5-persons , 209 6-persons , 220 7-or-more-persons .
Size of nonfamily households: 7,073 1-person , 1,843 2-persons , 212 3-persons , 18 4-persons , 25 5-persons .
4,624 married couples with children. single-parent households (362 men , 2,972 women ).
89.3% of residents of Cleveland Heights speak English at home. of residents speak Spanish at home (74% speak English very well , 6% speak English well , 17% speak English not well , 2% don't speak English at all ).of residents speak other Indo-European language at home (84% speak English very well , 11% speak English well , 5% speak English not well ).of residents speak Asian or Pacific Island language at home (65% speak English very well , 32% speak English well , 1% speak English not well , 2% don't speak English at all ).of residents speak other language at home (86% speak English very well , 12% speak English well , 2% speak English not well ).
Foreign born population: 3,576 (8.1%)of them are naturalized citizens )
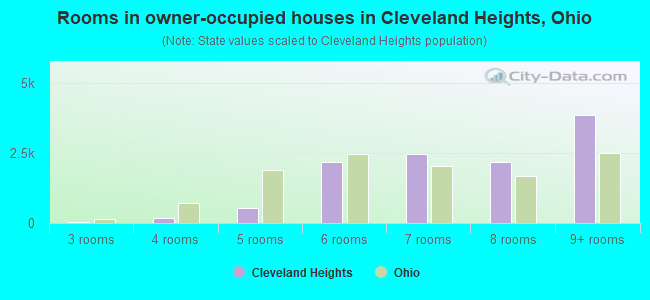
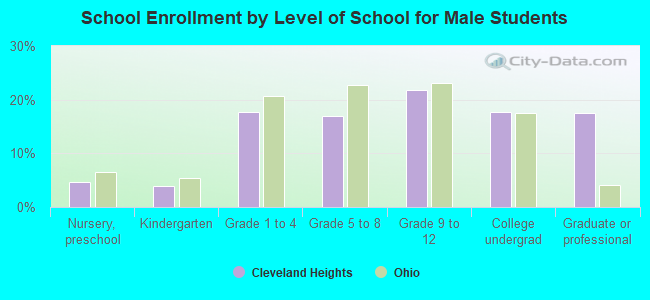
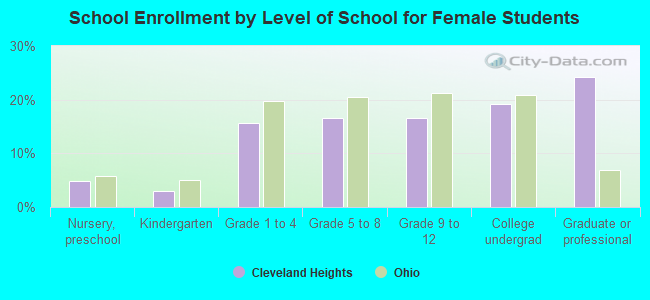
Median number of rooms in houses and condos:
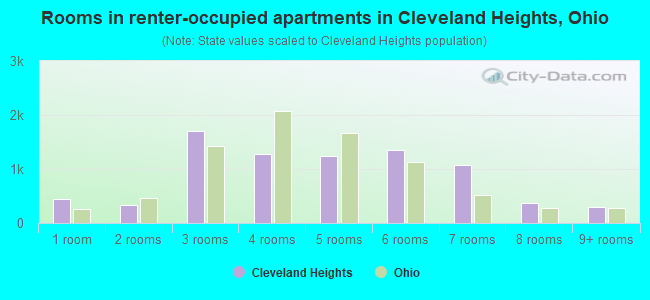
Median number of rooms in apartments
Owner-occupied Renter-occupied
Rooms in owner-occupied houses in Cleveland Heights, Ohio
0 1 room 10 2 rooms 48 3 rooms 189 4 rooms 536 5 rooms 2,164 6 rooms 2,470 7 rooms 2,180 8 rooms 3,854 9+ rooms
Rooms in renter-occupied apartments in Cleveland Heights, Ohio
442 1 room 340 2 rooms 1,702 3 rooms 1,287 4 rooms 1,237 5 rooms 1,351 6 rooms 1,074 7 rooms 368 8 rooms 300 9+ rooms
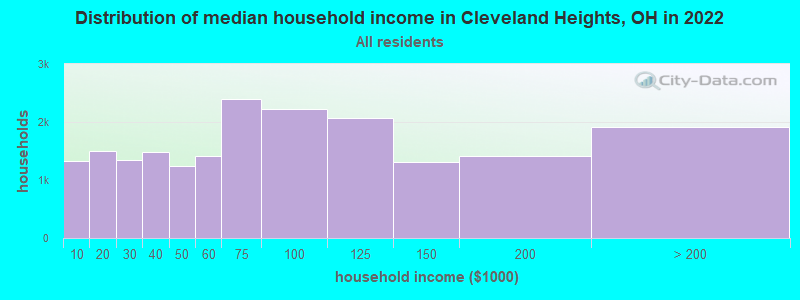
Cleveland Heights, OH household income distribution 1,319 Less than $10,0001,500 $10,000 to $19,9991,352 $20,000 to $29,9991,484 $30,000 to $39,9991,242 $40,000 to $49,9991,421 $50,000 to $59,9992,389 $60,000 to $74,9992,225 $75,000 to $99,9992,066 $100,000 to $124,9991,303 $125,000 to $149,9991,422 $150,000 to $199,9991,908 $200,000 or more
Home value of owner - occupied houses in 2022 in Cleveland Heights, OH 19 Less than $10,00041 $10,000 to $14,99936 $15,000 to $19,99949 $20,000 to $24,9992 $25,000 to $29,99915 $35,000 to $39,99943 $40,000 to $49,99989 $50,000 to $59,999100 $60,000 to $69,999275 $70,000 to $79,999443 $80,000 to $89,999491 $90,000 to $99,9991,690 $100,000 to $124,9991,293 $125,000 to $149,9991,197 $150,000 to $174,9991,045 $175,000 to $199,9991,621 $200,000 to $249,9991,004 $250,000 to $299,999867 $300,000 to $399,999550 $400,000 to $499,999487 $500,000 to $749,999104 $750,000 to $999,999148 $1,000,000 to $1,499,9991 $1,500,000 to $1,999,999Rent paid by renters in 2022 in Cleveland Heights, OH 62 Less than $10015 $100 to $14922 $150 to $199165 $200 to $249113 $250 to $29976 $300 to $349144 $350 to $399184 $400 to $44956 $450 to $499102 $500 to $549112 $550 to $599264 $600 to $649165 $650 to $699260 $700 to $749415 $750 to $799850 $800 to $899815 $900 to $9992,067 $1,000 to $1,2491,172 $1,250 to $1,499587 $1,500 to $1,999157 $2,000 to $2,4998 $2,500 to $2,9996 $3,000 to $3,49975 $3,500 or more174 No cash rent
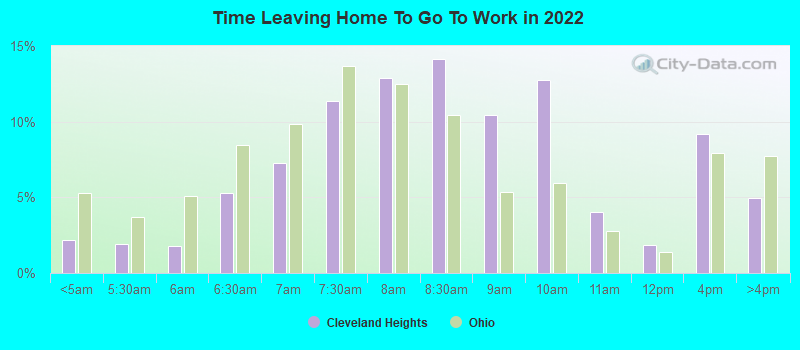
Percentage of workers working in this county: 90.9%Number of people working at home: 4,305 (19.4% of all workers )
Travel time to work (commute)
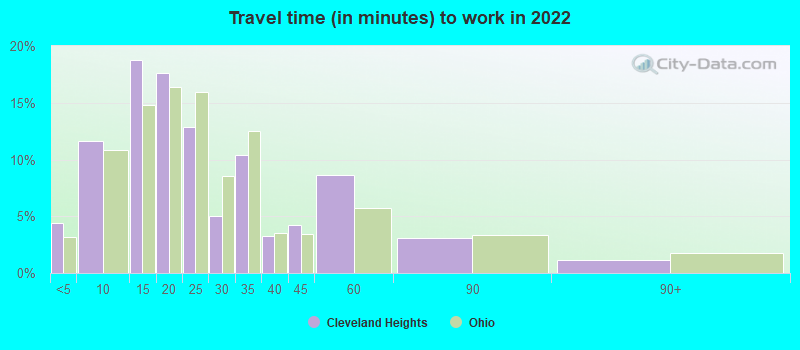
Less than 5 minutes: 3245 to 9 minutes: 1,58510 to 14 minutes: 2,99315 to 19 minutes: 3,30820 to 24 minutes: 3,67625 to 29 minutes: 1,96430 to 34 minutes: 2,28135 to 39 minutes: 43340 to 44 minutes: 52945 to 59 minutes: 67760 to 89 minutes: 37590 or more minutes: 154
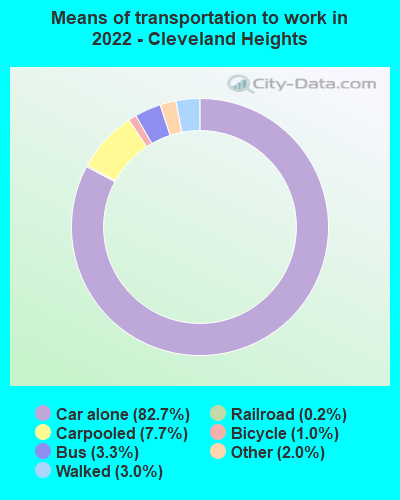
Means of transportation to work:
Drove a car alone: 5,867 (56.0%)Carpooled: 554 (5.3%)Bus : 206 (2.0%)Light rail, streetcar or trolley : 19 (0.2%)Taxi: 145 (1.4%)Bicycle: 114 (1.1%)Walked: 245 (2.3%)Worked at home: 4,305 (41.1%)
Unemployment by race in 2022
Unemployment rate for White non-Hispanic residents 1.6% Males2.3% FemalesUnemployment rate for Black residents 13.3% Males9.8% FemalesUnemployment rate for Asian residents 1.7% Males8.0% FemalesUnemployment rate for two or more race residents 11.1% Males6.2% FemalesUnemployment rate for Hispanic or Latino residents 6.9% Males0.9% Females
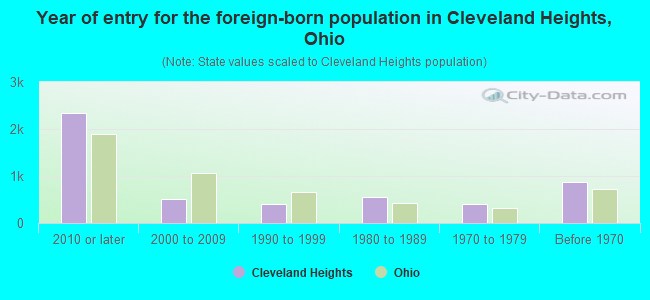
Year of entry for the foreign-born population in Cleveland Heights, Ohio
2,346 2010 or later 504 2000 to 2009 395 1990 to 1999 549 1980 to 1989 407 1970 to 1979 878 Before 1970
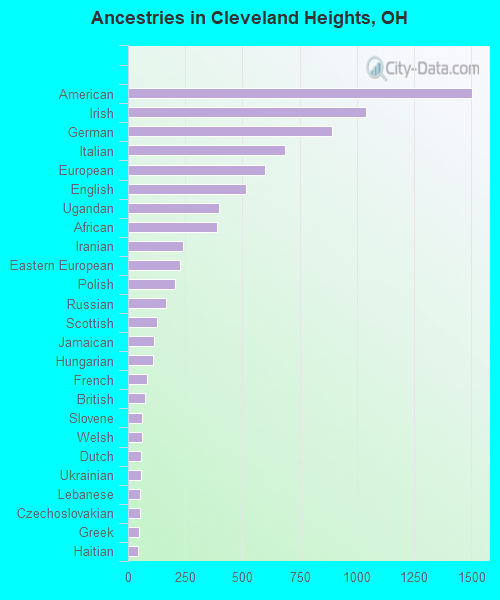
First ancestries reported:
American: 1,503 (6.0%)
Irish: 1,039 (4.2%)
German: 890 (3.6%)
Italian: 685 (2.7%)
European: 600 (2.4%)
English: 518 (2.1%)
Ugandan: 396 (1.6%)
African: 387 (1.5%)
Iranian: 240 (1.0%)
Eastern European: 228 (0.9%)
Polish: 206 (0.8%)
Russian: 168 (0.7%)
Scottish: 126 (0.5%)
Jamaican: 114 (0.5%)
Hungarian: 110 (0.4%)
French: 84 (0.3%)
British: 76 (0.3%)
Slovene: 62 (0.2%)
Welsh: 62 (0.2%)
Dutch: 59 (0.2%)
Ukrainian: 55 (0.2%)
Lebanese: 52 (0.2%)
Czechoslovakian: 51 (0.2%)
Greek: 50 (0.2%)
Haitian: 44 (0.2%)
Scotch-Irish: 43 (0.2%)
Slovak: 42 (0.2%)
Swedish: 40 (0.2%)
Canadian: 37 (0.1%)
Australian: 36 (0.1%)
Nigerian: 36 (0.1%)
Finnish: 33 (0.1%)
Albanian: 29 (0.1%)
Serbian: 28 (0.1%)
French Canadian: 24 (0.10%)
Norwegian: 24 (0.10%)
Northern European: 24 (0.10%)
Czech: 23 (0.09%)
Syrian: 21 (0.08%)
Kenyan: 21 (0.08%)
Austrian: 18 (0.07%)
Danish: 16 (0.06%)
Lithuanian: 15 (0.06%)
Croatian: 15 (0.06%)
Israeli: 12 (0.05%)
Bermudan: 12 (0.05%)
Trinidadian and Tobagonian: 10 (0.04%)
Brazilian: 9 (0.04%)
Portuguese: 9 (0.04%)
Romanian: 6 (0.02%)
Scandinavian: 6 (0.02%)
Ethiopian: 5 (0.02%)
Swiss: 5 (0.02%)
Celtic: 5 (0.02%)
Latvian: 4 (0.02%)
Zimbabwean: 4 (0.02%)
Slavic: 3 (0.01%)
Macedonian: 3 (0.01%)
Egyptian: 2 (0.01%)
Most common places of birth for foreign-born residents (%): China, excluding Hong Kong and Taiwan Cleveland Heights:
13.7% (510)Ohio:
6.2% (35,703)
Uganda Cleveland Heights:
9.3% (345)Ohio:
0.2% (875)
India Cleveland Heights:
8.0% (297)Ohio:
11.6% (66,525)
Bhutan Cleveland Heights:
6.3% (233)Ohio:
2.4% (13,773)
Canada Cleveland Heights:
6.0% (222)Ohio:
2.6% (14,988)
Korea Cleveland Heights:
4.6% (172)Ohio:
2.0% (11,398)
Iran Cleveland Heights:
4.2% (155)Ohio:
0.6% (3,552)
Jamaica Cleveland Heights:
3.9% (146)Ohio:
0.7% (4,187)
Russia Cleveland Heights:
2.7% (101)Ohio:
1.5% (8,452)
Hong Kong Cleveland Heights:
2.5% (91)Ohio:
0.4% (2,094)
Saudi Arabia Cleveland Heights:
2.1% (79)Ohio:
0.6% (3,669)
Kazakhstan Cleveland Heights:
2.0% (76)Ohio:
0.1% (640)
Brazil Cleveland Heights:
2.0% (76)Ohio:
0.9% (5,101)
Germany Cleveland Heights:
1.6% (60)Ohio:
2.2% (12,846)
Other Eastern Europe Cleveland Heights:
1.5% (56)Ohio:
0.7% (4,155)
Place of birth for U.S.-born residents:
This state: 27,344Other state: 12,693Northeast: 4,085Midwest: 2,786South: 3,925West: 1,878 80.7% of Cleveland Heights residents lived in the same house 1 years ago.
Out of people who lived in different houses, 33.7% lived in this county.
Out of people who lived in different counties, 40.1% lived in Ohio.
Cleveland Heights:
80.7%State average:
87.8%
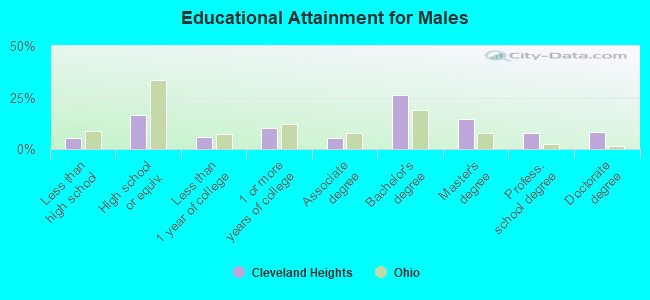
Education attainment for males 25 years and older:
No schooling: 68Nursery to 4th grade: 05th and 6th grade: 597th and 8th grade: 289th grade: 1810th grade: 10111th grade: 22812th grade, no diploma: 228High school graduate (or equivalency): 2,303Less than 1 year of college: 801Some college more than 1 year, no degree: 1,450Associate degree: 776Bachelor's degree: 3,635Master's degree: 1,998Professional school degree: 1,092Doctorate degree: 1,132
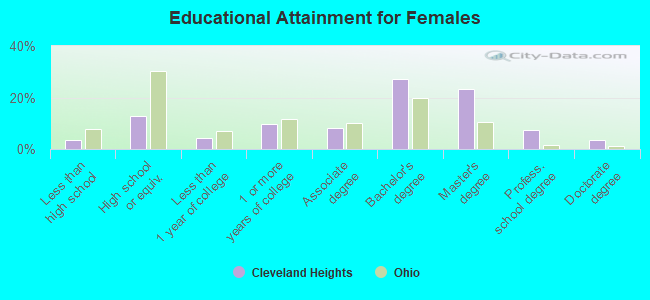
Education attainment for females 25 years and older:
No schooling: 69Nursery to 4th grade: 375th and 6th grade: 07th and 8th grade: 529th grade: 10110th grade: 5111th grade: 8712th grade, no diploma: 184High school graduate (or equivalency): 2,213Less than 1 year of college: 775Some college more than 1 year, no degree: 1,710Associate degree: 1,460Bachelor's degree: 4,736Master's degree: 4,094Professional school degree: 1,299Doctorate degree: 634
Housing units in structures:
One, detached: 13,594One, attached: 1,004Two: 1,0023 or 4: 1,1375 to 9: 1,30110 to 19: 1,18220 to 49: 89050 or more: 1,533Mobile homes: 18Housing units lacking complete plumbing facilities in 2022: 1.5%Housing units lacking complete kitchen facilities in 2022: 4.6%House/condo owner moved in on average 14 years ago
Renter moved in on average 1 years ago
Private vs. public school enrollment:
Students in private schools in grades 1 to 8 (elementary and middle school): 1,506 Students in private schools in grades 9 to 12 (high school): 485 Students in private undergraduate colleges: 1,357