Clearwater, FL (Florida) Houses and Residents
| Clearwater: | $354,500 |
| Florida: | $354,100 |
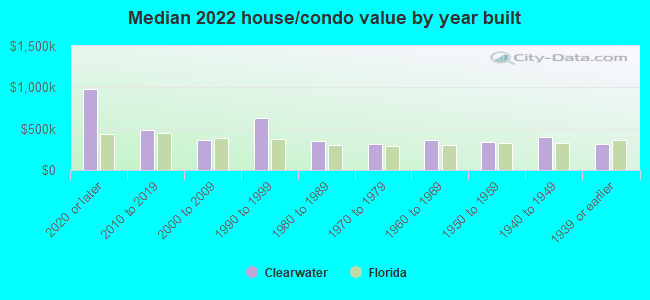
Mean price in 2022:
Detached houses: $423,007
Here: $423,007 State: $500,941 Townhouses or other attached units: $279,844
Here: $279,844 State: $370,869 In 2-unit structures: $241,064
Here: $241,064 State: $423,188 In 3-to-4-unit structures: $150,441
Here: $150,441 State: $309,944 In 5-or-more-unit structures: $389,753
Here: $389,753 State: $447,145 Mobile homes: $65,599
Here: $65,599 State: $113,202
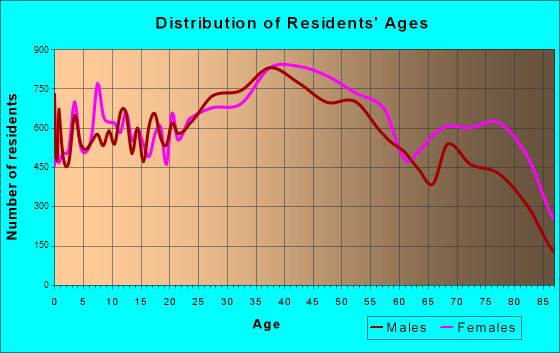
Total population: 110,703 (Urban population: 107,925, Rural population: 0)
Houses: 61,131 (48,490 occupied: 28,462 owner occupied, 20,028 renter occupied)
| % of renters here: | 41% |
| State: | 33% |
Housing density: 2,417 houses/condos per square mile
Median price asked for vacant for-sale houses and condos in 2022: $365,266.
Median contract rent in 2022: $1,289 (lower quartile is $1,031, upper quartile is $1,693)
Median rent asked for vacant for-rent units in 2022: $3,855
Median gross rent in Clearwater, FL in 2022: $1,453
Housing units in Clearwater with a mortgage: 15,335 (1,503 second mortgage, 215 home equity loan, 1,083 both second mortgage and home equity loan)
Houses without a mortgage: 1,649
Median household income for houses/condos with a mortgage: $89,502
Median household income for apartments without a mortgage: $61,690
Median monthly housing costs: $1,328
Compare current foreclosures in Clearwater, FL:
| Photo | Address | Area | Beds / Baths | Price | Details |
|---|---|---|---|---|---|

|
#1
Us Highway 19 N Apt 19-C
Clearwater, FL 33764
|
- sq. feet
|
2 baths 2 beds |
$208,000
|
show details |

|
#2
Luce Dr N
Clearwater, FL 33761
|
2,413 sq. feet
|
4 baths 4 beds |
show details | |

|
#3
S Saturn Ave
Clearwater, FL 33755
|
1,126 sq. feet
|
1 baths 2 beds |
show details | |

|
#4
State Road 590
Clearwater, FL 33759
|
2,731 sq. feet
|
2 baths - beds |
show details | |

|
#5
Friend Ave
Clearwater, FL 33756
|
882 sq. feet
|
1 baths - beds |
show details | |

|
#6
Owen Dr
Clearwater, FL 33759
|
1,161 sq. feet
|
1 baths - beds |
show details | |

|
#7
Edenwood St
Clearwater, FL 33759
|
729 sq. feet
|
1 baths - beds |
show details | |

|
#8
State Road 580
Clearwater, FL 33761
|
3,968 sq. feet
|
3 baths - beds |
show details | |

|
#9
S Betty Ln
Clearwater, FL 33756
|
1,012 sq. feet
|
1 baths - beds |
show details | |

|
#10
S Betty Ln
Clearwater, FL 33756
|
888 sq. feet
|
1 baths - beds |
show details |
| Photo | Address | Area | Beds / Baths | Price | Details |
|---|---|---|---|---|---|

|
#11
Pennsylvania Ave
Clearwater, FL 33755
|
1,716 sq. feet
|
2 baths - beds |
show details | |

|
#12
Chandler Ave
Clearwater, FL 33755
|
888 sq. feet
|
1 baths - beds |
show details | |

|
#13
Capri Dr
Clearwater, FL 33763
|
845 sq. feet
|
1 baths - beds |
show details | |

|
#14
Turner St
Clearwater, FL 33764
|
1,640 sq. feet
|
2 baths - beds |
show details | |

|
#15
Palm Dr
Clearwater, FL 33763
|
775 sq. feet
|
1 baths - beds |
show details | |

|
#16
Bell Dr
Clearwater, FL 33764
|
1,512 sq. feet
|
2 baths - beds |
show details | |

|
#17
Windsor Dr
Clearwater, FL 33756
|
1,154 sq. feet
|
2 baths - beds |
show details | |

|
#18
Druid Rd E
Clearwater, FL 33756
|
1,355 sq. feet
|
2 baths - beds |
show details | |

|
#19
Iva St
Clearwater, FL 33755
|
716 sq. feet
|
1 baths - beds |
show details | |

|
#20
Pine St
Clearwater, FL 33756
|
1,728 sq. feet
|
2 baths - beds |
show details |
| Photo | Address | Area | Beds / Baths | Price | Details |
|---|---|---|---|---|---|

|
#21
N Duncan Ave
Clearwater, FL 33755
|
1,060 sq. feet
|
1 baths - beds |
show details | |

|
#22
Highland Acre Dr
Clearwater, FL 33761
|
1,240 sq. feet
|
2 baths - beds |
show details | |

|
#23
Brunswick Dr
Clearwater, FL 33756
|
1,242 sq. feet
|
2 baths - beds |
show details | |

|
#24
Crest Dr
Clearwater, FL 33759
|
3,535 sq. feet
|
4 baths - beds |
show details | |

|
#25
Herman St
Clearwater, FL 33760
|
1,004 sq. feet
|
1 baths - beds |
show details | |

|
#26
Rebecca Dr
Clearwater, FL 33764
|
1,427 sq. feet
|
2 baths - beds |
show details | |

|
#27
Souvenir Dr
Clearwater, FL 33755
|
1,188 sq. feet
|
2 baths - beds |
show details | |

|
#28
Clark St
Clearwater, FL 33755
|
1,200 sq. feet
|
2 baths - beds |
show details | |

|
#29
Ponce De Leon Blvd
Clearwater, FL 33756
|
1,309 sq. feet
|
2 baths - beds |
show details | |

|
#30
Tilley Ave
Clearwater, FL 33756
|
1,223 sq. feet
|
2 baths - beds |
show details |
| Photo | Address | Area | Beds / Baths | Price | Details |
|---|---|---|---|---|---|

|
#31
Avalon Ave
Clearwater, FL 33760
|
1,290 sq. feet
|
2 baths - beds |
show details | |

|
#32
Nutwood St
Clearwater, FL 33759
|
1,822 sq. feet
|
1 baths - beds |
show details | |

|
#33
Luce D 104
Clearwater, FL 33761
|
2,413 sq. feet
|
3 baths - beds |
show details | |

|
#34
S Arcturas Ave
Clearwater, FL 33765
|
1,423 sq. feet
|
1 baths - beds |
show details | |

|
#35
Sedeeva St
Clearwater, FL 33755
|
2,670 sq. feet
|
2 baths - beds |
show details | |

|
#36
Capri Dr
Clearwater, FL 33763
|
980 sq. feet
|
1 baths - beds |
show details | |

|
#37
Havana Way
Clearwater, FL 33764
|
1,122 sq. feet
|
2 baths - beds |
show details | |

|
#38
140th Ter N
Clearwater, FL 33760
|
1,344 sq. feet
|
2 baths - beds |
show details | |

|
#39
Fox Hill Dr
Clearwater, FL 33761
|
1,672 sq. feet
|
2 baths - beds |
show details | |

|
#40
Ridge Top Way
Clearwater, FL 33765
|
2,794 sq. feet
|
3 baths - beds |
show details |
| Photo | Address | Area | Beds / Baths | Price | Details |
|---|---|---|---|---|---|

|
#41
Cypress Ave
Clearwater, FL 33756
|
1,395 sq. feet
|
2 baths - beds |
show details | |

|
#42
Fairmont St
Clearwater, FL 33755
|
1,204 sq. feet
|
1 baths - beds |
show details | |

|
#43
Catalina Dr N
Clearwater, FL 33763
|
1,073 sq. feet
|
1 baths - beds |
show details | |

|
#44
Carlton St
Clearwater, FL 33755
|
1,192 sq. feet
|
2 baths - beds |
show details | |

|
#45
Barbara Cir
Clearwater, FL 33756
|
1,742 sq. feet
|
2 baths - beds |
show details | |

|
#46
Joel Ln
Clearwater, FL 33755
|
1,517 sq. feet
|
2 baths - beds |
show details | |

|
#47
Wellington Dr
Clearwater, FL 33764
|
2,036 sq. feet
|
2 baths - beds |
show details | |

|
#48
Masters Dr
Clearwater, FL 33761
|
3,636 sq. feet
|
3 baths - beds |
show details | |

|
#49
Woodmere Ct
Clearwater, FL 33761
|
1,937 sq. feet
|
2 baths - beds |
show details | |

|
Check over 1 million property listings on Foreclosure.com!
|
browse all offers | |||

Latest news about housing in Clearwater, FL collected exclusively by city-data.com from local newspapers, TV, and radio stations

 | Rent apartments TAMPA, Clearwater, St.Petersburg... (1 reply) |
| Los Prados condos and Enclave apartments (0 replies) |
| Any nice apartments/ condos for rent in St. Pete beach (0 replies) |
| Condos in Largo or Clearwater (1 reply) |
| Seeking to rent single family home! (9 replies) |
| Safe apartments near Clearwater (3 replies) |
Median year apartment built: 1981
Household type by relationship:
Households: 117,010- Male householders: 23,820 (8,925 living alone), Female householders: 24,670 (9,256 living alone)
17,387 spouses (17,036 opposite-sex spouses), 5,490 unmarried partners, (5,358 opposite-sex unmarried partners), 26,643 children (24,855 natural, 1,525 adopted, 263 stepchildren), 2,266 grandchildren, 2,354 brothers or sisters, 2,461 parents, 99 foster children, 3,309 other relatives, 3,804 non-relatives
- In group quarters: 4,707
Size of family households: 14,437 2-persons, 4,670 3-persons, 3,945 4-persons, 2,070 5-persons, 454 6-persons, 274 7-or-more-persons.
Size of nonfamily households: 18,181 1-person, 3,815 2-persons, 534 3-persons, 47 5-persons, 63 6-persons.
8,562 married couples with children.
7,376 single-parent households (2,399 men, 4,977 women).
79.1% of residents of Clearwater speak English at home.
11.8% of residents speak Spanish at home (46% speak English very well, 26% speak English well, 19% speak English not well, 9% don't speak English at all).
6.2% of residents speak other Indo-European language at home (67% speak English very well, 20% speak English well, 12% speak English not well, 2% don't speak English at all).
2.0% of residents speak Asian or Pacific Island language at home (65% speak English very well, 16% speak English well, 12% speak English not well, 7% don't speak English at all).
1.3% of residents speak other language at home (55% speak English very well, 14% speak English well, 30% speak English not well).
Foreign born population: 20,672 (17.7%)
(50.5% of them are naturalized citizens)
| Here: | 5.7 |
| State: | 5.9 |
| Here: | 4.2 |
| State: | 4.2 |
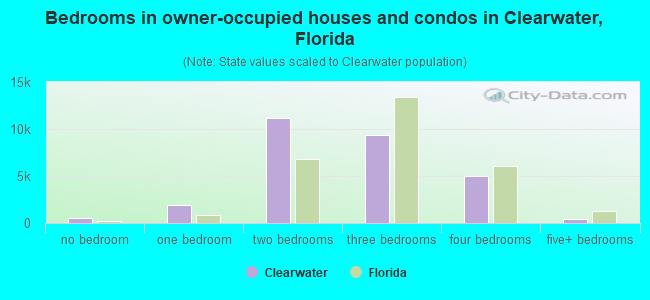
- Bedrooms in owner-occupied houses and condos in Clearwater, Florida
- 535no bedroom
- 1,9651 bedroom
- 11,1422 bedrooms
- 9,4003 bedrooms
- 5,0184 bedrooms
- 4025+ bedrooms
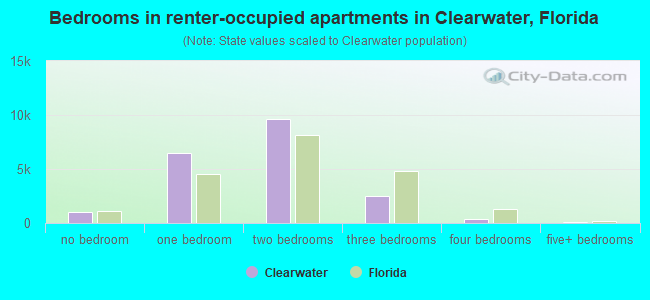
- Bedrooms in renter-occupied apartments in Clearwater, Florida
- 1,023no bedroom
- 6,5101 bedroom
- 9,5942 bedrooms
- 2,4573 bedrooms
- 3384 bedrooms
- 1065+ bedrooms
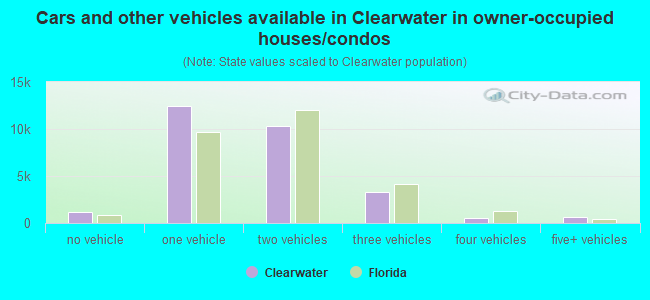
- Cars and other vehicles available in Clearwater in owner-occupied houses/condos
- 1,128no vehicle
- 12,4921 vehicle
- 10,3012 vehicles
- 3,2713 vehicles
- 5854 vehicles
- 6855+ vehicles
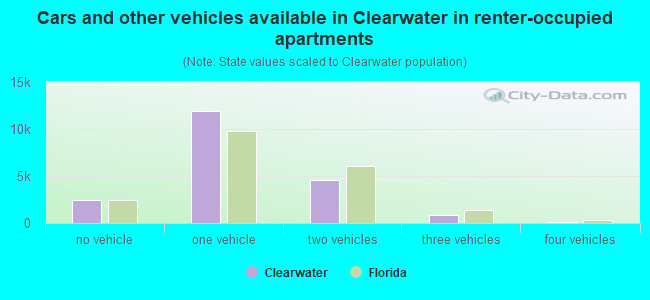
- Cars and other vehicles available in Clearwater in renter-occupied apartments
- 2,403no vehicle
- 11,9491 vehicle
- 4,5992 vehicles
- 8873 vehicles
- 1334 vehicles
- 575+ vehicles
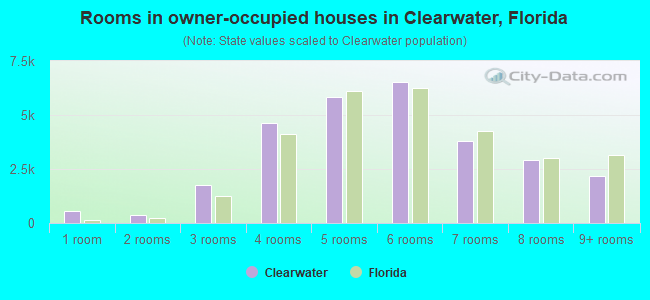
- Rooms in owner-occupied houses in Clearwater, Florida
- 5351 room
- 3582 rooms
- 1,7553 rooms
- 4,6194 rooms
- 5,8145 rooms
- 6,5166 rooms
- 3,7757 rooms
- 2,9308 rooms
- 2,1609+ rooms
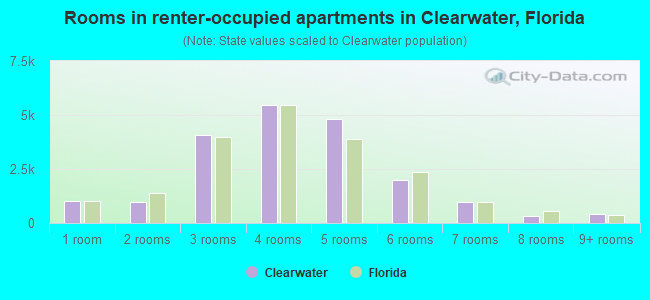
- Rooms in renter-occupied apartments in Clearwater, Florida
- 1,0231 room
- 9582 rooms
- 4,0723 rooms
- 5,4564 rooms
- 4,8195 rooms
- 2,0036 rooms
- 9817 rooms
- 3178 rooms
- 3999+ rooms
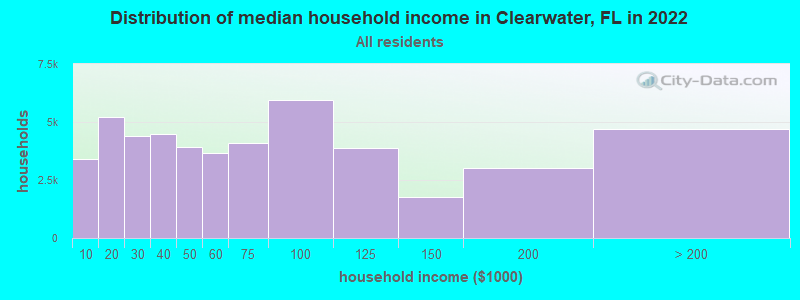
Clearwater, FL household income distribution

- 3,386Less than $10,000
- 5,224$10,000 to $19,999
- 4,401$20,000 to $29,999
- 4,496$30,000 to $39,999
- 3,913$40,000 to $49,999
- 3,671$50,000 to $59,999
- 4,081$60,000 to $74,999
- 5,945$75,000 to $99,999
- 3,874$100,000 to $124,999
- 1,784$125,000 to $149,999
- 3,010$150,000 to $199,999
- 4,705$200,000 or more
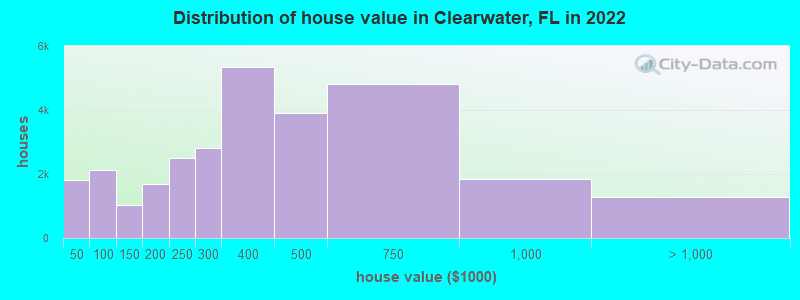
Home value of owner - occupied houses in 2022 in Clearwater, FL
-
- 328Less than $10,000
- 287$10,000 to $14,999
- 83$15,000 to $19,999
- 132$20,000 to $24,999
- 181$25,000 to $29,999
- 105$30,000 to $34,999
- 49$35,000 to $39,999
- 655$40,000 to $49,999
- 293$50,000 to $59,999
- 224$60,000 to $69,999
- 239$70,000 to $79,999
- 470$80,000 to $89,999
- 232$90,000 to $99,999
- 598$100,000 to $124,999
- 440$125,000 to $149,999
- 830$150,000 to $174,999
- 849$175,000 to $199,999
- 2,511$200,000 to $249,999
- 2,808$250,000 to $299,999
- 5,351$300,000 to $399,999
- 3,896$400,000 to $499,999
- 4,798$500,000 to $749,999
- 1,837$750,000 to $999,999
- 828$1,000,000 to $1,499,999
- 83$1,500,000 to $1,999,999
- 355$2,000,000 or more
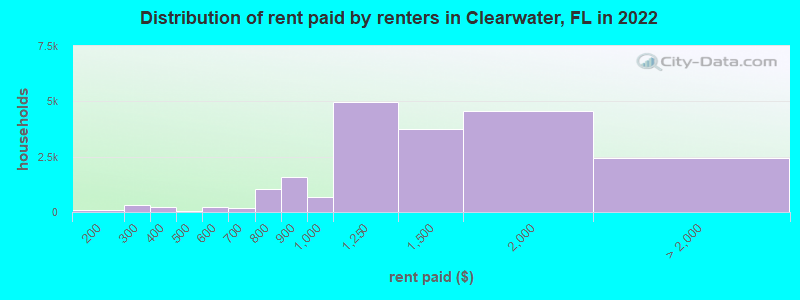
Rent paid by renters in 2022 in Clearwater, FL
-
- 20$100 to $149
- 63$150 to $199
- 87$200 to $249
- 207$250 to $299
- 80$300 to $349
- 129$350 to $399
- 46$400 to $449
- 75$500 to $549
- 171$550 to $599
- 166$600 to $649
- 634$700 to $749
- 392$750 to $799
- 1,563$800 to $899
- 673$900 to $999
- 4,964$1,000 to $1,249
- 3,746$1,250 to $1,499
- 4,576$1,500 to $1,999
- 1,277$2,000 to $2,499
- 379$2,500 to $2,999
- 189$3,000 to $3,499
- 273$3,500 or more
- 318No cash rent
Percentage of workers working in this county: 91.3%
Number of people working at home: 12,463 (23.1% of all workers)
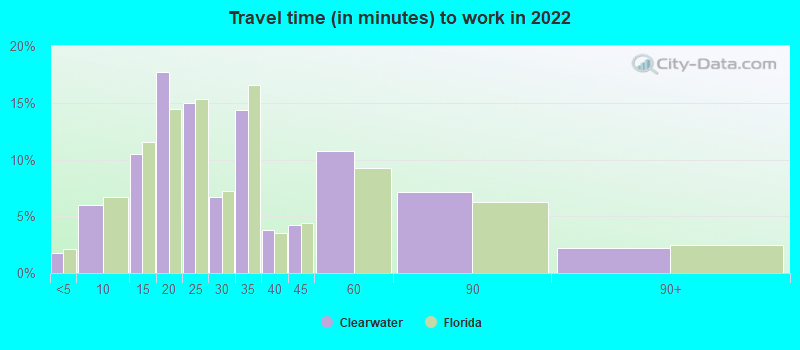
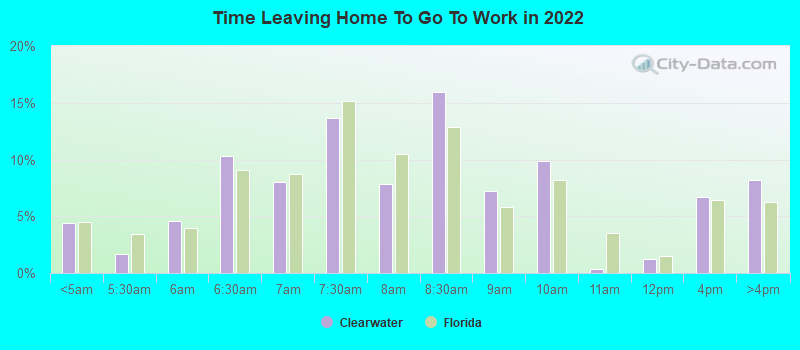
Travel time to work (commute)
- Less than 5 minutes: 1,185
- 5 to 9 minutes: 3,600
- 10 to 14 minutes: 4,342
- 15 to 19 minutes: 9,324
- 20 to 24 minutes: 7,437
- 25 to 29 minutes: 3,467
- 30 to 34 minutes: 5,261
- 35 to 39 minutes: 1,243
- 40 to 44 minutes: 1,287
- 45 to 59 minutes: 1,723
- 60 to 89 minutes: 1,400
- 90 or more minutes: 590
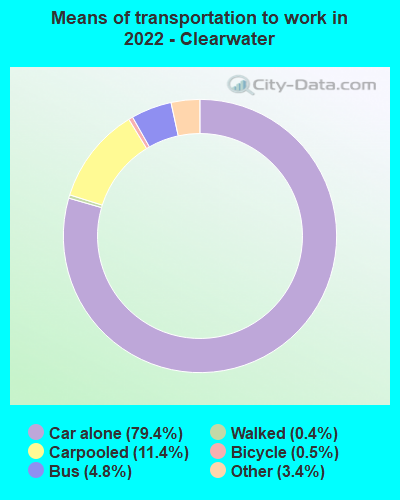
Means of transportation to work:
- Drove a car alone: 56,106 (67.2%)
- Carpooled: 8,074 (9.7%)
- Bus: 3,388 (4.1%)
- Taxi: 2,377 (2.8%)
- Bicycle: 386 (0.5%)
- Walked: 293 (0.4%)
- Worked at home: 12,817 (15.4%)
- Unemployment by race in 2022
- Unemployment rate for White non-Hispanic residents
- 3.3%Males
- 2.3%Females
- Unemployment rate for Black residents
- 7.0%Males
- 11.6%Females
- Unemployment rate for American Indian and Alaska Native residents
- 10.2%Males
- 10.4%Females
- Unemployment rate for Asian residents
- 8.4%Males
- 5.8%Females
- Unemployment rate for other race residents
- 0.9%Males
- 4.9%Females
- Unemployment rate for Hispanic or Latino residents
- 3.8%Females
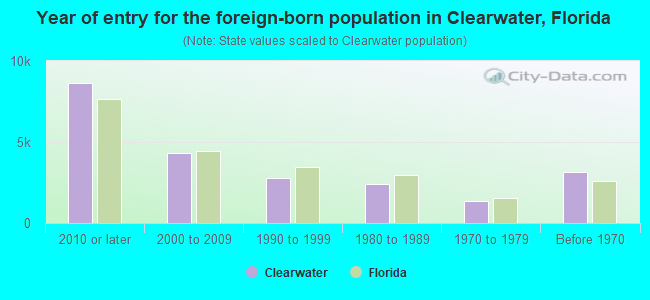
- Year of entry for the foreign-born population in Clearwater, Florida
- 8,6522010 or later
- 4,3132000 to 2009
- 2,7991990 to 1999
- 2,4211980 to 1989
- 1,3341970 to 1979
- 3,133Before 1970
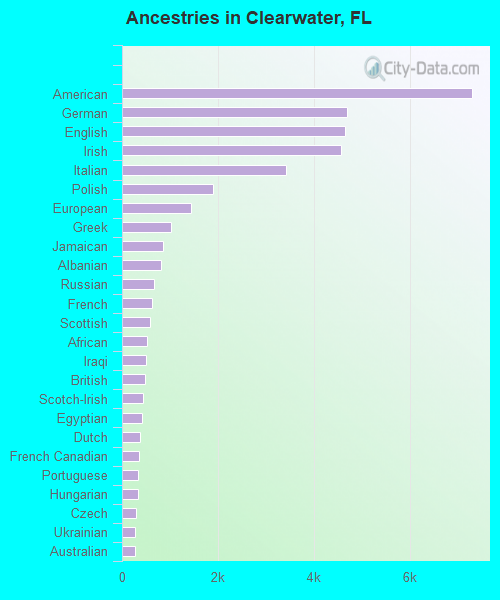
First ancestries reported:
- American: 7,287 (11.3%)
- German: 4,687 (7.3%)
- English: 4,653 (7.2%)
- Irish: 4,562 (7.1%)
- Italian: 3,412 (5.3%)
- Polish: 1,887 (2.9%)
- European: 1,442 (2.2%)
- Greek: 1,023 (1.6%)
- Jamaican: 854 (1.3%)
- Albanian: 810 (1.3%)
- Russian: 665 (1.0%)
- French: 629 (1.0%)
- Scottish: 579 (0.9%)
- African: 511 (0.8%)
- Iraqi: 493 (0.8%)
- British: 477 (0.7%)
- Scotch-Irish: 444 (0.7%)
- Egyptian: 412 (0.6%)
- Dutch: 371 (0.6%)
- French Canadian: 345 (0.5%)
- Portuguese: 331 (0.5%)
- Hungarian: 327 (0.5%)
- Czech: 299 (0.5%)
- Ukrainian: 281 (0.4%)
- Australian: 270 (0.4%)
- Canadian: 264 (0.4%)
- Nigerian: 261 (0.4%)
- Yugoslavian: 238 (0.4%)
- Welsh: 234 (0.4%)
- Eastern European: 228 (0.4%)
- Lebanese: 222 (0.3%)
- Brazilian: 201 (0.3%)
- Swedish: 195 (0.3%)
- Swiss: 191 (0.3%)
- Croatian: 182 (0.3%)
- Haitian: 182 (0.3%)
- Iranian: 171 (0.3%)
- Serbian: 135 (0.2%)
- Lithuanian: 132 (0.2%)
- South African: 126 (0.2%)
- Norwegian: 125 (0.2%)
- Belgian: 103 (0.2%)
- Czechoslovakian: 99 (0.2%)
- Palestinian: 98 (0.2%)
- Moroccan: 88 (0.1%)
- Guyanese: 69 (0.1%)
- Bulgarian: 69 (0.1%)
- Scandinavian: 68 (0.1%)
- Northern European: 67 (0.1%)
- Romanian: 65 (0.1%)
- Armenian: 55 (0.09%)
- Israeli: 54 (0.08%)
- Turkish: 52 (0.08%)
- Austrian: 48 (0.07%)
- Ghanaian: 43 (0.07%)
- Danish: 42 (0.07%)
- Slovene: 42 (0.07%)
- Slavic: 41 (0.06%)
- Cape Verdean: 39 (0.06%)
- New Zealander: 39 (0.06%)
- Slovak: 34 (0.05%)
- Macedonian: 27 (0.04%)
- Finnish: 24 (0.04%)
- Pennsylvania German: 21 (0.03%)
- Celtic: 20 (0.03%)
- Assyrian: 17 (0.03%)
- Syrian: 16 (0.02%)
- Bahamian: 15 (0.02%)
- Barbadian: 15 (0.02%)
- Carpatho Rusyn: 12 (0.02%)
- Latvian: 11 (0.02%)
- Cajun: 10 (0.02%)
- Icelander: 10 (0.02%)
- Trinidadian and Tobagonian: 10 (0.02%)
- Jordanian: 9 (0.01%)
- West Indian: 9 (0.01%)
Most common places of birth for foreign-born residents (%):
| Clearwater: | 11.5% (2,399) |
| Florida: | 5.6% (257,152) |
| Clearwater: | 7.5% (1,563) |
| Florida: | 2.4% (109,132) |
| Clearwater: | 6.7% (1,401) |
| Florida: | 5.7% (262,042) |
| Clearwater: | 4.6% (968) |
| Florida: | 22.0% (1,006,576) |
| Clearwater: | 3.9% (811) |
| Florida: | 1.8% (84,403) |
| Clearwater: | 3.6% (761) |
| Florida: | 2.1% (94,349) |
| Clearwater: | 3.0% (631) |
| Florida: | 2.7% (122,906) |
| Clearwater: | 2.9% (613) |
| Florida: | 0.6% (25,219) |
| Clearwater: | 2.9% (595) |
| Florida: | 6.5% (298,669) |
| Clearwater: | 2.8% (593) |
| Florida: | 1.1% (49,838) |
| Clearwater: | 2.5% (521) |
| Florida: | 0.2% (9,779) |
| Clearwater: | 2.5% (516) |
| Florida: | 1.2% (54,272) |
| Clearwater: | 2.3% (478) |
| Florida: | 0.1% (5,190) |
| Clearwater: | 2.2% (469) |
| Florida: | 0.2% (8,980) |
| Clearwater: | 2.2% (465) |
| Florida: | 0.3% (13,998) |
| Clearwater: | 2.1% (448) |
| Florida: | 5.0% (227,319) |
| Clearwater: | 2.1% (447) |
| Florida: | 1.3% (60,604) |
| Clearwater: | 2.1% (446) |
| Florida: | 0.7% (30,755) |
| Clearwater: | 2.0% (416) |
| Florida: | 3.0% (137,727) |
| Clearwater: | 2.0% (409) |
| Florida: | 0.7% (34,227) |
| Clearwater: | 1.8% (371) |
| Florida: | 0.5% (21,886) |
| Clearwater: | 1.6% (336) |
| Florida: | 0.2% (9,990) |
Place of birth for U.S.-born residents:
- This state: 40,461
- Other state: 53,349
- Northeast: 20,595
- Midwest: 16,865
- South: 10,711
- West: 5,178
85.4% of Clearwater residents lived in the same house 1 years ago.
Out of people who lived in different houses, 38.2% lived in this county.
Out of people who lived in different counties, 20.9% lived in Florida.
| Clearwater: | 85.4% |
| State average: | 86.3% |
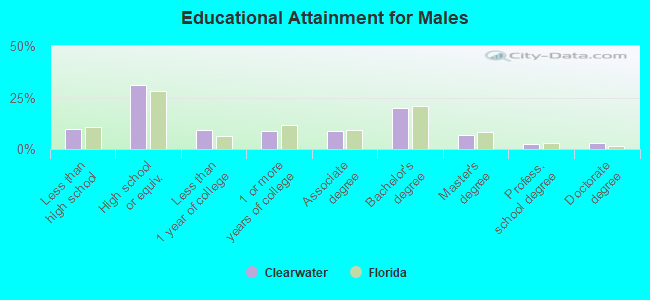
Education attainment for males 25 years and older:
- No schooling: 655
- Nursery to 4th grade: 165
- 5th and 6th grade: 503
- 7th and 8th grade: 525
- 9th grade: 266
- 10th grade: 492
- 11th grade: 852
- 12th grade, no diploma: 527
- High school graduate (or equivalency): 12,802
- Less than 1 year of college: 3,838
- Some college more than 1 year, no degree: 3,496
- Associate degree: 3,692
- Bachelor's degree: 8,112
- Master's degree: 2,864
- Professional school degree: 1,075
- Doctorate degree: 1,228
Education attainment for females 25 years and older:
- No schooling: 474
- Nursery to 4th grade: 387
- 5th and 6th grade: 175
- 7th and 8th grade: 451
- 9th grade: 207
- 10th grade: 650
- 11th grade: 641
- 12th grade, no diploma: 1,154
- High school graduate (or equivalency): 14,220
- Less than 1 year of college: 4,954
- Some college more than 1 year, no degree: 5,334
- Associate degree: 3,247
- Bachelor's degree: 7,943
- Master's degree: 4,904
- Professional school degree: 772
- Doctorate degree: 443

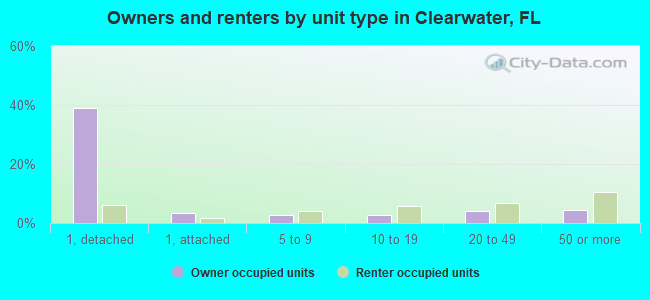
Housing units in structures:
- One, detached: 21,167
- One, attached: 4,110
- Two: 1,896
- 3 or 4: 2,253
- 5 to 9: 5,494
- 10 to 19: 3,897
- 20 to 49: 7,341
- 50 or more: 11,947
- Mobile homes: 3,000
- Boats, RVs, vans, etc.: 26
Median worth of mobile homes: $58,000
Housing units lacking complete kitchen facilities in 2022: 1.3%
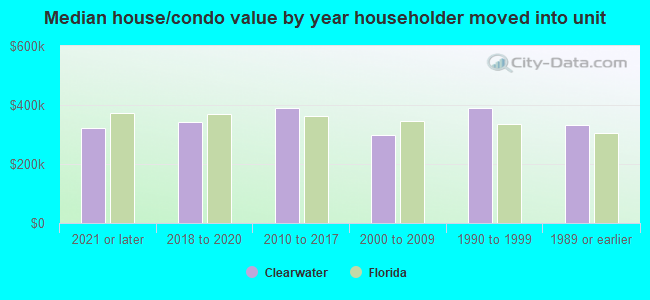
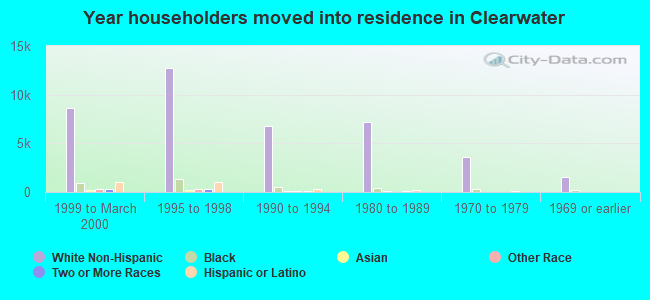
House/condo owner moved in on average 9 years ago
Renter moved in on average 2 years ago
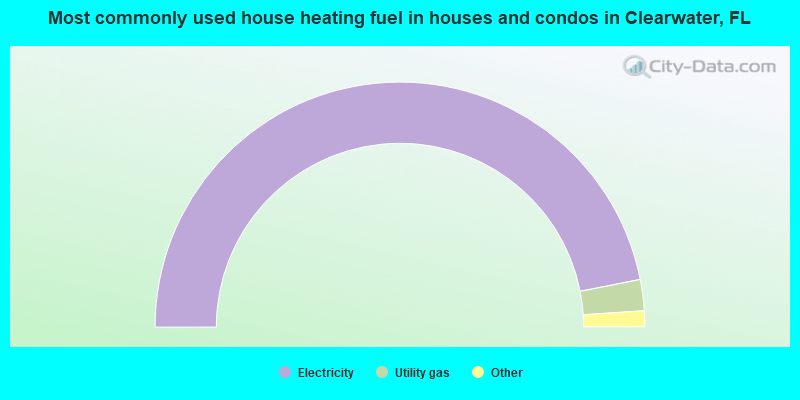
- 93.8%Electricity
- 4.1%Utility gas
- 1.2%No fuel used
- 0.5%Solar energy
- 0.1%Wood
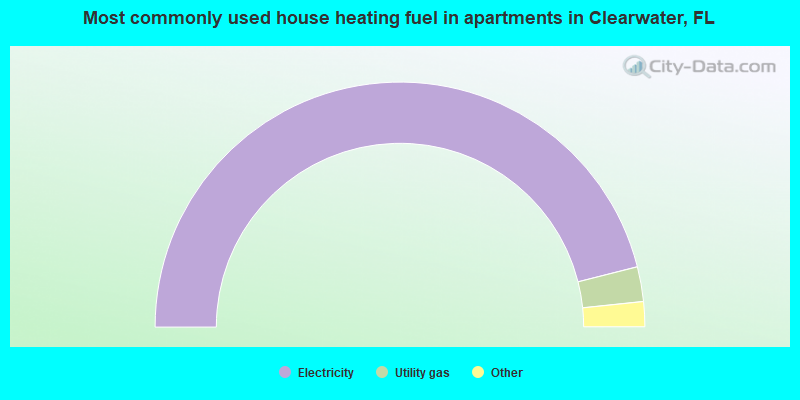
- 92.1%Electricity
- 4.6%Utility gas
- 2.7%No fuel used
- 0.5%Bottled, tank, or LP gas
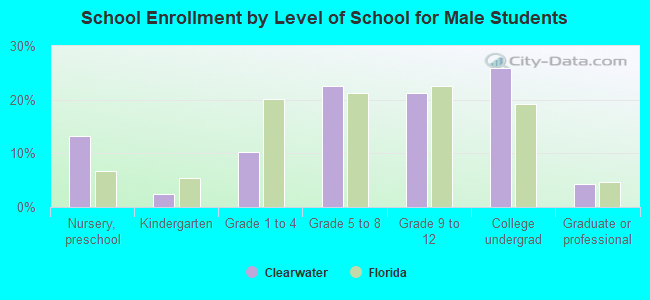
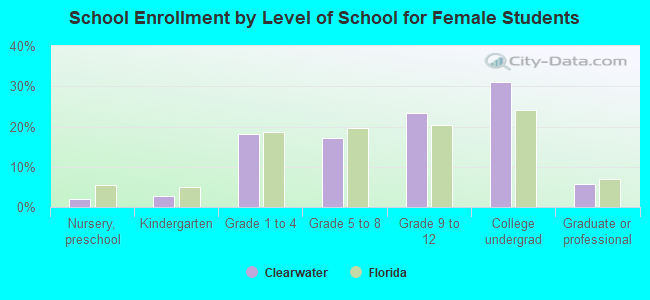
Private vs. public school enrollment:
| Here: | 21.7% |
| Florida: | 15.8% |
| Here: | 20.0% |
| Florida: | 12.9% |
| Here: | 25.8% |
| Florida: | 23.6% |