Clayton, CA (California) Houses and Residents
| Clayton: | $1,017,120 |
| California: | $715,900 |
Mean price in 2022:
Detached houses: $1,131,452
Here: $1,131,452 State: $988,808 Townhouses or other attached units: $646,759
Here: $646,759 State: $838,546 In 3-to-4-unit structures: $718,756
Here: $718,756 State: $824,253
Total population: 11,690 (Urban population: 10,792, Rural population: 0)
Houses: 4,106 (4,049 occupied: 3,681 owner occupied, 377 renter occupied)
| % of renters here: | 9% |
| State: | 44% |
Housing density: 1,041 houses/condos per square mile
Median price asked for vacant for-sale houses and condos in 2022 in this county: $378,161.
Median contract rent in 2022: over $2,000 (lower quartile is over $2,000, upper quartile is over $2,000)
Median rent asked for vacant for-rent units in 2022: $3,411
Median gross rent in Clayton, CA in 2022: over $2,000
Housing units in Clayton with a mortgage: 2,762 (398 second mortgage, 0 home equity loan, 418 both second mortgage and home equity loan)
Houses without a mortgage: 43
Median household income for houses/condos with a mortgage: $187,506
Median household income for apartments without a mortgage: $87,310
Median monthly housing costs: $3,120
Compare current foreclosures near Clayton, CA:
| Photo | Address | Area | Beds / Baths | Price | Details |
|---|---|---|---|---|---|

|
#1
Mountaire Pkwy
Clayton, CA 94517
|
2,625 sq. feet
|
3 baths 4 beds |
show details | |

|
#2
Mountaire Ct
Clayton, CA 94517
|
2,410 sq. feet
|
2 baths 5 beds |
show details | |

|
#3
Blue Oak Ln
Clayton, CA 94517
|
3,596 sq. feet
|
3 baths 5 beds |
show details | |

|
#4
Falcon Pl
Clayton, CA 94517
|
2,520 sq. feet
|
3 baths 5 beds |
show details | |

|
#5
Mountaire Pl
Clayton, CA 94517
|
2,410 sq. feet
|
2 baths 5 beds |
show details | |

|
#6
Donner Creek Ct
Clayton, CA 94517
|
1,050 sq. feet
|
2 baths 2 beds |
show details | |

|
#7
Mountaire Pl
Clayton, CA 94517
|
1,924 sq. feet
|
2 baths 4 beds |
show details | |

|
#8
Arrowhead Ter
Clayton, CA 94517
|
1,749 sq. feet
|
2 baths 3 beds |
show details | |

|
#9
Center St Apt 118
Clayton, CA 94517
|
- sq. feet
|
- baths - beds |
show details | |

|
#10
E 12th St
Pittsburg, CA 94565
|
1,345 sq. feet
|
1 baths 2 beds |
$519,000
|
show details |
| Photo | Address | Area | Beds / Baths | Price | Details |
|---|---|---|---|---|---|

|
#11
Catalina Dr
Hercules, CA 94547
|
2,518 sq. feet
|
3 baths 5 beds |
$868,400
|
show details |

|
#12
Mohr Ln Apt C
Concord, CA 94518
|
870 sq. feet
|
1 baths 2 beds |
show details | |

|
#13
Solano Way
Concord, CA 94520
|
1,470 sq. feet
|
2 baths 3 beds |
show details | |

|
#14
Merion Ter
Moraga, CA 94556
|
1,708 sq. feet
|
2 baths 3 beds |
show details | |

|
#15
Merrill Dr
Antioch, CA 94509
|
2,113 sq. feet
|
3 baths 3 beds |
show details | |

|
#16
Doyle Rd
Oakley, CA 94561
|
2,067 sq. feet
|
2 baths 4 beds |
show details | |

|
#17
Snyder Ln
Walnut Creek, CA 94598
|
4,709 sq. feet
|
3 baths 5 beds |
show details | |

|
#18
Union Mine Dr
Antioch, CA 94531
|
3,715 sq. feet
|
3 baths 5 beds |
show details | |

|
#19
San Jose Dr Unit 228
Antioch, CA 94509
|
830 sq. feet
|
2 baths 2 beds |
show details | |

|
#20
Rocky Point Dr
Antioch, CA 94531
|
3,937 sq. feet
|
4 baths 6 beds |
show details |
| Photo | Address | Area | Beds / Baths | Price | Details |
|---|---|---|---|---|---|

|
#21
Whyte Park Ave
Walnut Creek, CA 94595
|
2,389 sq. feet
|
2 baths 3 beds |
show details | |

|
#22
Shasta Cir
Pittsburg, CA 94565
|
1,053 sq. feet
|
1 baths 3 beds |
show details | |

|
#23
Sunnyside Ct
Orinda, CA 94563
|
2,700 sq. feet
|
3 baths 5 beds |
show details | |

|
#24
Montevideo Dr
San Ramon, CA 94583
|
3,495 sq. feet
|
3 baths 4 beds |
show details | |

|
#25
Beede Way
Antioch, CA 94509
|
2,228 sq. feet
|
2 baths 2 beds |
show details | |

|
#26
Pendleton Ct
Oakley, CA 94561
|
3,075 sq. feet
|
3 baths 5 beds |
show details | |

|
#27
Panoramic Ave
Pittsburg, CA 94565
|
1,364 sq. feet
|
1 baths 4 beds |
show details | |

|
#28
Diablo Ct
Danville, CA 94526
|
2,971 sq. feet
|
2 baths 4 beds |
show details | |

|
#29
Bonita Ave
Antioch, CA 94509
|
1,133 sq. feet
|
2 baths 3 beds |
show details | |

|
#30
Twilight Ct
Brentwood, CA 94513
|
1,943 sq. feet
|
3 baths 4 beds |
show details |
| Photo | Address | Area | Beds / Baths | Price | Details |
|---|---|---|---|---|---|

|
#31
Drake Ct
Oakley, CA 94561
|
1,164 sq. feet
|
2 baths 3 beds |
show details | |

|
#32
Putnam St
Antioch, CA 94509
|
1,245 sq. feet
|
2 baths 3 beds |
show details | |

|
#33
S Chanterella Dr
San Ramon, CA 94582
|
2,811 sq. feet
|
3 baths 4 beds |
show details | |

|
#34
Madera Ct
Danville, CA 94526
|
2,344 sq. feet
|
3 baths 4 beds |
show details | |

|
#35
Sonora Ct
Oakley, CA 94561
|
3,852 sq. feet
|
3 baths 5 beds |
show details | |

|
#36
Arthur Way
Antioch, CA 94509
|
1,595 sq. feet
|
2 baths 4 beds |
show details | |

|
#37
Leslie Ave
Martinez, CA 94553
|
1,006 sq. feet
|
1 baths 2 beds |
show details | |

|
#38
Bolla Ave
Alamo, CA 94507
|
4,658 sq. feet
|
4 baths 4 beds |
show details | |

|
#39
Hilliard Cir
Antioch, CA 94509
|
2,332 sq. feet
|
3 baths 4 beds |
show details | |

|
#40
Carpino Ave
Pittsburg, CA 94565
|
975 sq. feet
|
1 baths 3 beds |
show details |
| Photo | Address | Area | Beds / Baths | Price | Details |
|---|---|---|---|---|---|

|
#41
Filbert St
Antioch, CA 94509
|
1,137 sq. feet
|
2 baths 3 beds |
show details | |

|
#42
Shetland Way
Antioch, CA 94531
|
3,249 sq. feet
|
3 baths 5 beds |
show details | |

|
#43
Tabora Dr
Antioch, CA 94509
|
2,511 sq. feet
|
3 baths 4 beds |
show details | |

|
#44
Santa Fe St
Oakley, CA 94561
|
1,330 sq. feet
|
2 baths 3 beds |
show details | |

|
#45
Mare Ct
Antioch, CA 94531
|
- sq. feet
|
3 baths 5 beds |
show details | |

|
#46
Deer Trail Dr
Danville, CA 94506
|
3,856 sq. feet
|
3 baths 3 beds |
show details | |

|
#47
Canada Hills Way
Antioch, CA 94531
|
1,680 sq. feet
|
3 baths 4 beds |
show details | |

|
#48
Jane Ct
Martinez, CA 94553
|
1,121 sq. feet
|
2 baths 3 beds |
show details | |

|
#49
Columbia Cir
Benicia, CA 94510
|
1,540 sq. feet
|
3 baths 3 beds |
show details | |

|
Check over 1 million property listings on Foreclosure.com!
|
browse all offers | |||

Latest news about housing in Clayton, CA collected exclusively by city-data.com from local newspapers, TV, and radio stations

 | The Los Angeles Homeless Containment Thread (9136 replies) |
| My city list for rental homes ... Need input! (23 replies) |
| Young couple seeking to buy or rent a house in Bay Area (10 replies) |
| Is it realistic 2500$ to rent a house in the east bay? (25 replies) |
| Best place to purchase Condo...Concord, PH or Martinez (19 replies) |
| Pet Friendly and Safe Apartments (5 replies) |

Median year apartment built: 1988
Household type by relationship:
Households: 11,015- Male householders: 2,191 (269 living alone), Female householders: 1,782 (497 living alone)
2,483 spouses (2,483 opposite-sex spouses), 100 unmarried partners, (100 opposite-sex unmarried partners), 4,230 children (4,052 natural, 148 adopted, 29 stepchildren), 50 grandchildren, 32 brothers or sisters, 15 parents, 0 foster children, 27 other relatives, 70 non-relatives
- In group quarters: 29
Size of family households: 1,283 2-persons, 658 3-persons, 808 4-persons, 310 5-persons, 98 6-persons, 40 7-or-more-persons.
Size of nonfamily households: 776 1-person, 70 2-persons.
1,984 married couples with children.
421 single-parent households (57 men, 364 women).
83.4% of residents of Clayton speak English at home.
4.4% of residents speak Spanish at home (90% speak English very well, 7% speak English well, 2% don't speak English at all).
4.3% of residents speak other Indo-European language at home (71% speak English very well, 18% speak English well, 11% speak English not well).
3.9% of residents speak Asian or Pacific Island language at home (79% speak English very well, 21% speak English well).
2.5% of residents speak other language at home (100% speak English very well).
Foreign born population: 1,420 (12.9%)
(78.8% of them are naturalized citizens)
| Here: | 7.0 |
| State: | 6.0 |
| Here: | 6.6 |
| State: | 3.9 |

- Bedrooms in owner-occupied houses and condos in Clayton, California
- 0no bedroom
- 01 bedroom
- 2412 bedrooms
- 1,5983 bedrooms
- 1,5034 bedrooms
- 3395+ bedrooms

- Bedrooms in renter-occupied apartments in Clayton, California
- 0no bedroom
- 01 bedroom
- 912 bedrooms
- 2043 bedrooms
- 814 bedrooms
- 05+ bedrooms

- Cars and other vehicles available in Clayton in owner-occupied houses/condos
- 130no vehicle
- 6211 vehicle
- 1,4412 vehicles
- 1,0473 vehicles
- 3684 vehicles
- 745+ vehicles

- Cars and other vehicles available in Clayton in renter-occupied apartments
- 0no vehicle
- 1051 vehicle
- 1842 vehicles
- 353 vehicles
- 504 vehicles
- 45+ vehicles

- Rooms in owner-occupied houses in Clayton, California
- 01 room
- 02 rooms
- 113 rooms
- 1184 rooms
- 4975 rooms
- 7436 rooms
- 8647 rooms
- 6058 rooms
- 8449+ rooms

- Rooms in renter-occupied apartments in Clayton, California
- 01 room
- 02 rooms
- 03 rooms
- 634 rooms
- 885 rooms
- 176 rooms
- 1587 rooms
- 238 rooms
- 279+ rooms


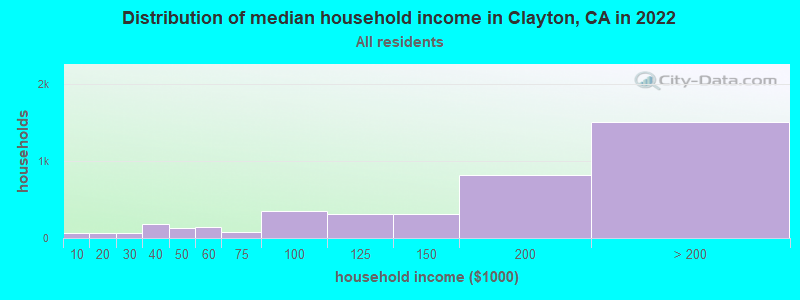
Clayton, CA household income distribution

- 63Less than $10,000
- 64$10,000 to $19,999
- 70$20,000 to $29,999
- 188$30,000 to $39,999
- 130$40,000 to $49,999
- 142$50,000 to $59,999
- 72$60,000 to $74,999
- 357$75,000 to $99,999
- 307$100,000 to $124,999
- 316$125,000 to $149,999
- 822$150,000 to $199,999
- 1,508$200,000 or more
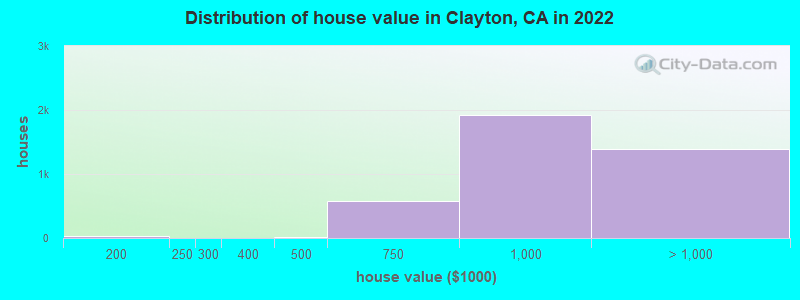
Home value of owner - occupied houses in 2022 in Clayton, CA
-
- 7$125,000 to $149,999
- 24$150,000 to $174,999
- 4$175,000 to $199,999
- 6$250,000 to $299,999
- 9$400,000 to $499,999
- 571$500,000 to $749,999
- 1,915$750,000 to $999,999
- 1,188$1,000,000 to $1,499,999
- 88$1,500,000 to $1,999,999
- 115$2,000,000 or more
Rent paid by renters in 2022 in Clayton, CA
-
- 31$1,500 to $1,999
- 34$2,000 to $2,499
- 58$2,500 to $2,999
- 39$3,000 to $3,499
- 143$3,500 or more
- 66No cash rent


Percentage of workers working in this county: 82.4%
Number of people working at home: 1,040 (21.6% of all workers)
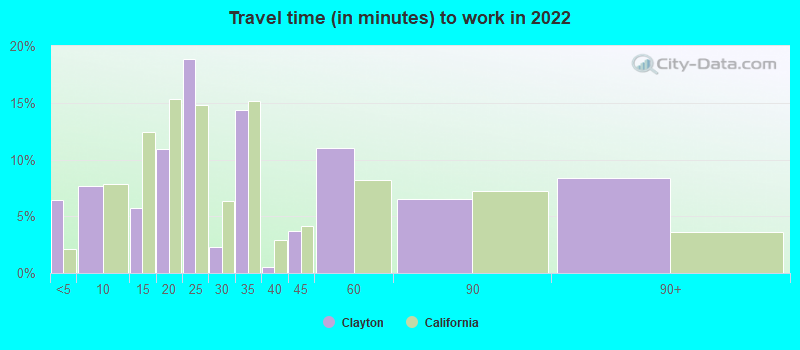
Travel time to work (commute)
- Less than 5 minutes: 111
- 5 to 9 minutes: 146
- 10 to 14 minutes: 140
- 15 to 19 minutes: 192
- 20 to 24 minutes: 532
- 25 to 29 minutes: 390
- 30 to 34 minutes: 523
- 35 to 39 minutes: 98
- 40 to 44 minutes: 187
- 45 to 59 minutes: 681
- 60 to 89 minutes: 512
- 90 or more minutes: 227
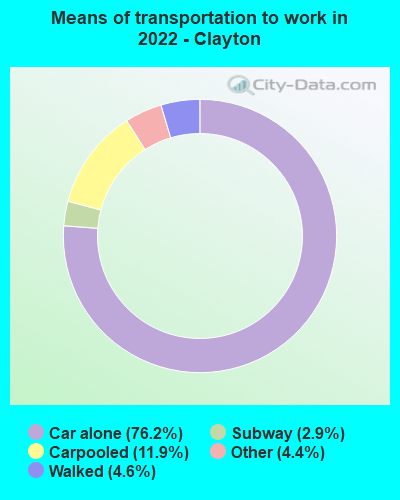
Means of transportation to work:
- Drove a car alone: 883 (41.5%)
- Carpooled: 154 (7.2%)
- Long-distance train or commuter rail: 26 (1.2%)
- Taxi: 54 (2.5%)
- Walked: 75 (3.5%)
- Worked at home: 1,040 (48.9%)

- Unemployment by race in 2022
- Unemployment rate for White non-Hispanic residents
- 2.7%Males
- 6.0%Females
- Unemployment rate for Asian residents
- 6.6%Males
- Unemployment rate for two or more race residents
- 2.5%Males
- Unemployment rate for Hispanic or Latino residents
- 27.3%Males

- Year of entry for the foreign-born population in Clayton, California
- 3292010 or later
- 3102000 to 2009
- 2561990 to 1999
- 2661980 to 1989
- 1991970 to 1979
- 288Before 1970

First ancestries reported:
- English: 743 (16.4%)
- American: 224 (4.9%)
- Italian: 224 (4.9%)
- Irish: 220 (4.9%)
- German: 172 (3.8%)
- Nigerian: 154 (3.4%)
- Ukrainian: 152 (3.4%)
- Polish: 128 (2.8%)
- European: 121 (2.7%)
- French: 95 (2.1%)
- Scottish: 61 (1.3%)
- British: 47 (1.0%)
- Eastern European: 46 (1.0%)
- Portuguese: 39 (0.9%)
- Israeli: 34 (0.8%)
- Scotch-Irish: 34 (0.8%)
- Welsh: 32 (0.7%)
- Russian: 30 (0.7%)
- Iranian: 22 (0.5%)
- Latvian: 21 (0.5%)
- Dutch: 19 (0.4%)
- Swedish: 18 (0.4%)
- Danish: 17 (0.4%)
- Greek: 15 (0.3%)
- French Canadian: 14 (0.3%)
- Croatian: 14 (0.3%)
- Northern European: 13 (0.3%)
- Afghan: 13 (0.3%)
- Armenian: 12 (0.3%)
- Hungarian: 12 (0.3%)
- Norwegian: 12 (0.3%)
- Scandinavian: 11 (0.2%)
- Slovak: 11 (0.2%)
- Finnish: 9 (0.2%)
- Jordanian: 7 (0.2%)
- Serbian: 7 (0.2%)
- Egyptian: 6 (0.1%)
- Turkish: 6 (0.1%)
- Australian: 5 (0.1%)
- Swiss: 2 (0.04%)
Most common places of birth for foreign-born residents (%):
| Clayton: | 14.2% (191) |
| California: | 7.8% (818,297) |
| Clayton: | 11.5% (155) |
| California: | 6.6% (684,672) |
| Clayton: | 7.8% (105) |
| California: | 0.2% (20,997) |
| Clayton: | 6.8% (91) |
| California: | 0.6% (60,761) |
| Clayton: | 5.6% (75) |
| California: | 5.2% (539,184) |
| Clayton: | 4.6% (62) |
| California: | 0.6% (57,953) |
| Clayton: | 4.5% (61) |
| California: | 3.0% (315,248) |
| Clayton: | 4.2% (57) |
| California: | 37.2% (3,881,193) |
| Clayton: | 4.2% (56) |
| California: | 0.7% (74,025) |
| Clayton: | 3.7% (50) |
| California: | 0.6% (60,582) |
| Clayton: | 3.4% (46) |
| California: | 0.3% (35,557) |
| Clayton: | 2.6% (35) |
| California: | 0.1% (10,213) |
| Clayton: | 2.5% (34) |
| California: | 0.0% (2,923) |
| Clayton: | 2.5% (33) |
| California: | 0.3% (28,176) |
| Clayton: | 2.2% (30) |
| California: | 0.3% (33,029) |
| Clayton: | 2.2% (29) |
| California: | 2.0% (206,004) |
| Clayton: | 2.2% (29) |
| California: | 0.6% (58,161) |
| Clayton: | 1.9% (26) |
| California: | 0.2% (16,586) |
Place of birth for U.S.-born residents:
- This state: 7,114
- Other state: 2,289
- Northeast: 587
- Midwest: 794
- South: 400
- West: 499
93.4% of Clayton residents lived in the same house 1 years ago.
Out of people who lived in different houses, 43.6% lived in this county.
Out of people who lived in different counties, 81.1% lived in California.
| Clayton: | 93.4% |
| State average: | 88.9% |
Education attainment for males 25 years and older:
- No schooling: 5
- Nursery to 4th grade: 0
- 5th and 6th grade: 0
- 7th and 8th grade: 0
- 9th grade: 0
- 10th grade: 0
- 11th grade: 0
- 12th grade, no diploma: 0
- High school graduate (or equivalency): 429
- Less than 1 year of college: 178
- Some college more than 1 year, no degree: 545
- Associate degree: 374
- Bachelor's degree: 1,304
- Master's degree: 549
- Professional school degree: 110
- Doctorate degree: 113

Education attainment for females 25 years and older:
- No schooling: 1
- Nursery to 4th grade: 0
- 5th and 6th grade: 8
- 7th and 8th grade: 0
- 9th grade: 0
- 10th grade: 0
- 11th grade: 32
- 12th grade, no diploma: 35
- High school graduate (or equivalency): 431
- Less than 1 year of college: 240
- Some college more than 1 year, no degree: 547
- Associate degree: 269
- Bachelor's degree: 1,491
- Master's degree: 475
- Professional school degree: 213
- Doctorate degree: 44


Housing units in structures:
- One, detached: 3,496
- One, attached: 567
- Two: 23
- 3 or 4: 18
House/condo owner moved in on average 16 years ago
Renter moved in on average 6 years ago

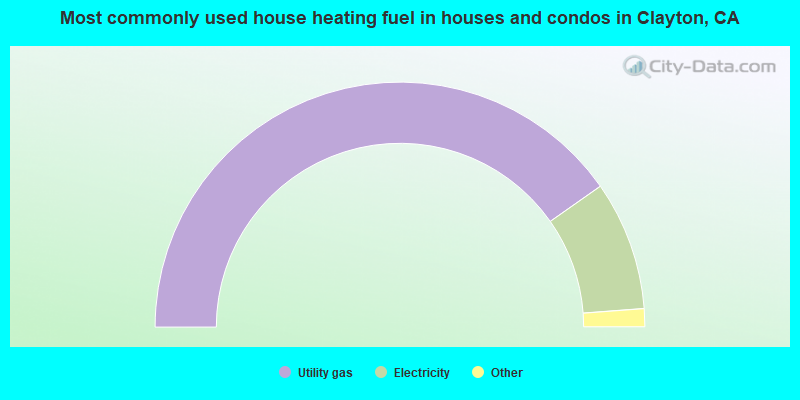
- 80.6%Utility gas
- 17.1%Electricity
- 1.1%Solar energy
- 1.0%Wood
- 0.2%Other fuel
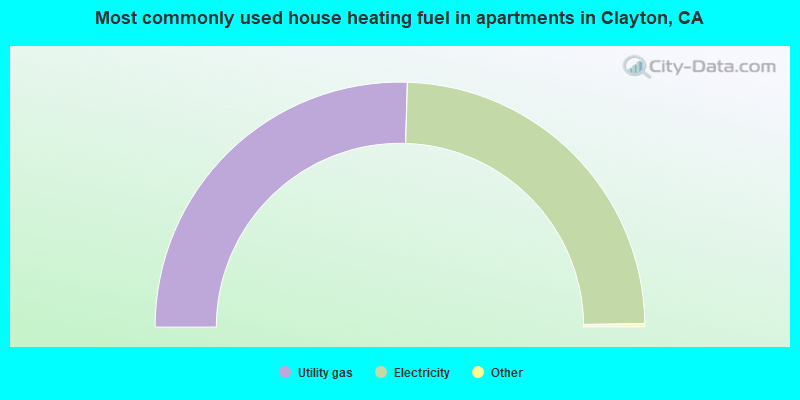
- 51.2%Utility gas
- 48.8%Electricity
Private vs. public school enrollment:
| Here: | 15.3% |
| California: | 10.5% |
| Here: | 4.4% |
| California: | 8.5% |
| Here: | 10.1% |
| California: | 15.9% |


