Clarks Green, PA (Pennsylvania) Houses and Residents
| Clarks Green: | $259,733 |
| Pennsylvania: | $245,500 |
Mean price in 2022:
Detached houses: $324,023
Here: $324,023 State: $317,202
Total population: 1,460 (All urban)
Houses: 725 (630 occupied: 589 owner occupied, 49 renter occupied)
| % of renters here: | 8% |
| State: | 31% |
Housing density: 1,276 houses/condos per square mile
Median price asked for vacant for-sale houses and condos in 2022: $296,298.
Median contract rent in 2022: $1,288 (lower quartile is $885, upper quartile is over $2,000)
Median rent asked for vacant for-rent units in 2022: $1,663
Median gross rent in Clarks Green, PA in 2022: $1,474
Housing units in Clarks Green with a mortgage: 333 (26 second mortgage, 3 home equity loan, 20 both second mortgage and home equity loan)
Houses without a mortgage: 11
Median household income for houses/condos with a mortgage: $111,788
Median household income for apartments without a mortgage: $75,958
Median monthly housing costs: $1,371
Compare current foreclosures near Clarks Green, PA:
| Photo | Address | Area | Beds / Baths | Price | Details |
|---|---|---|---|---|---|

|
#1
Burcher Ave
Clarks Summit, PA 18411
|
1,800 sq. feet
|
2 baths 3 beds |
$445,500
|
show details |

|
#2
Allen St
Scranton, PA 18512
|
1,045 sq. feet
|
1 baths 2 beds |
$231,000
|
show details |

|
#3
Cedar Ave
Scranton, PA 18505
|
1,500 sq. feet
|
1 baths 3 beds |
$26,900
|
show details |

|
#4
Searle St
Pittston, PA 18640
|
1,176 sq. feet
|
1 baths 2 beds |
$169,900
|
show details |

|
#5
W Harrison St
Tunkhannock, PA 18657
|
1,710 sq. feet
|
1 baths 3 beds |
$228,900
|
show details |

|
#6
Liberty St
Pittston, PA 18641
|
960 sq. feet
|
1 baths 2 beds |
$152,500
|
show details |

|
#7
Maple St
Scranton, PA 18505
|
1,500 sq. feet
|
1 baths 3 beds |
$195,500
|
show details |

|
#8
Keelersburg Rd
Tunkhannock, PA 18657
|
2,552 sq. feet
|
2 baths 4 beds |
$79,900
|
show details |

|
#9
Old Mill Rd
Dalton, PA 18414
|
- sq. feet
|
1 baths 2 beds |
$114,400
|
show details |

|
#10
Rachel Dr
Archbald, PA 18403
|
2,050 sq. feet
|
2 baths 3 beds |
show details |
| Photo | Address | Area | Beds / Baths | Price | Details |
|---|---|---|---|---|---|

|
#11
Petrilak Rd
Carbondale, PA 18407
|
1,400 sq. feet
|
1 baths 3 beds |
show details | |

|
#12
S Main St
Archbald, PA 18403
|
1,529 sq. feet
|
2 baths 3 beds |
show details | |

|
#13
Laurel Creek Dr
Dickson City, PA 18519
|
2,099 sq. feet
|
2 baths 4 beds |
show details | |

|
#14
E Scott St
Olyphant, PA 18447
|
1,648 sq. feet
|
2 baths 2 beds |
show details | |

|
#15
Church St
Pittston, PA 18640
|
1,668 sq. feet
|
1 baths 4 beds |
show details | |

|
#16
N Main St
Wilkes Barre, PA 18705
|
1,782 sq. feet
|
2 baths 3 beds |
show details | |

|
#17
Lower Powderly St
Carbondale, PA 18407
|
- sq. feet
|
2 baths 3 beds |
show details | |

|
#18
Wilson St
Jessup, PA 18434
|
1,548 sq. feet
|
2 baths 3 beds |
show details | |

|
#19
Evergreen Dr
Clarks Summit, PA 18411
|
1,100 sq. feet
|
1 baths 3 beds |
show details | |

|
#20
Main St
Peckville, PA 18452
|
1,768 sq. feet
|
1 baths 4 beds |
show details |
| Photo | Address | Area | Beds / Baths | Price | Details |
|---|---|---|---|---|---|

|
#21
Poplar St
Dickson City, PA 18519
|
1,160 sq. feet
|
1 baths 3 beds |
show details | |

|
#22
N Main Ave
Scranton, PA 18508
|
1,400 sq. feet
|
1 baths 3 beds |
show details | |

|
#23
Linden St
Pittston, PA 18643
|
2,428 sq. feet
|
3 baths 3 beds |
show details | |

|
#24
Grace St
Scranton, PA 18509
|
1,220 sq. feet
|
2 baths 4 beds |
show details | |

|
#25
N Sumner Ave
Scranton, PA 18508
|
1,025 sq. feet
|
1 baths 2 beds |
show details | |

|
#26
N Garfield Ave
Scranton, PA 18504
|
1,776 sq. feet
|
1 baths 4 beds |
show details | |

|
#27
Reservoir St
Carbondale, PA 18407
|
- sq. feet
|
2 baths 6 beds |
show details | |

|
#28
Norman St
Pittston, PA 18640
|
1,452 sq. feet
|
2 baths 2 beds |
show details | |

|
#29
Carbondale Rd
Waymart, PA 18472
|
2,187 sq. feet
|
2 baths 4 beds |
show details | |

|
#30
Whitmore Ave
Jermyn, PA 18433
|
870 sq. feet
|
1 baths 2 beds |
show details |
| Photo | Address | Area | Beds / Baths | Price | Details |
|---|---|---|---|---|---|

|
#31
Sanderson Ave
Olyphant, PA 18447
|
- sq. feet
|
1 baths 3 beds |
show details | |

|
#32
Circle Dr
Pittston, PA 18643
|
- sq. feet
|
1 baths 3 beds |
show details | |

|
#33
Opeil Rd
Jermyn, PA 18433
|
- sq. feet
|
2 baths 4 beds |
show details | |

|
#34
Van Leuven Rd
Lake Ariel, PA 18436
|
- sq. feet
|
2 baths 3 beds |
show details | |

|
#35
Sr 92 N
Tunkhannock, PA 18657
|
1 sq. feet
|
2 baths 2 beds |
show details | |

|
#36
Spring St
Carbondale, PA 18407
|
1,276 sq. feet
|
1 baths 3 beds |
show details | |

|
#37
Pittston Ave
Scranton, PA 18505
|
1,856 sq. feet
|
2 baths 2 beds |
show details | |

|
#38
Meadowcrest Dr
Shavertown, PA 18708
|
- sq. feet
|
2 baths 3 beds |
show details | |

|
#39
S Hyde Park Ave
Scranton, PA 18504
|
1,760 sq. feet
|
2 baths 4 beds |
show details | |

|
#40
S Church St
Carbondale, PA 18407
|
3,100 sq. feet
|
3 baths 4 beds |
show details |
| Photo | Address | Area | Beds / Baths | Price | Details |
|---|---|---|---|---|---|

|
#41
Shady Lane Rd
Clarks Summit, PA 18411
|
2,648 sq. feet
|
2 baths 5 beds |
show details | |

|
#42
5th St
Jermyn, PA 18433
|
2,100 sq. feet
|
1 baths 3 beds |
show details | |

|
#43
Hamlin Hwy
Hamlin, PA 18427
|
1,180 sq. feet
|
1 baths 3 beds |
show details | |

|
#44
Elkview Dr
Forest City, PA 18421
|
1,080 sq. feet
|
1 baths 3 beds |
show details | |

|
#45
Anthracite St
Pittston, PA 18643
|
1,144 sq. feet
|
1 baths 3 beds |
show details | |

|
#46
Elizabeth St
Pittston, PA 18640
|
1,711 sq. feet
|
1 baths 3 beds |
show details | |

|
#47
Griffin Pond Rd
Clarks Summit, PA 18411
|
- sq. feet
|
2 baths 3 beds |
show details | |

|
#48
Wyoming Ave
Wyoming, PA 18644
|
- sq. feet
|
3 baths 3 beds |
show details | |

|
#49
Thomas St
Archbald, PA 18403
|
- sq. feet
|
2 baths 2 beds |
show details | |

|
Check over 1 million property listings on Foreclosure.com!
|
browse all offers | |||


 | Best communities outside of Scranton? (3 replies) |
| Future NE Penn. residents looking for personal opinions and experiences! (273 replies) |
| Moved to NEPA transplants and opinions (137 replies) |
| Why are people so anxious to defame and degrade the place they call home? (89 replies) |
| Moving to NEPA (6 replies) |
| Moving to the area - looking for neighborhood suggestions (22 replies) |

Median year apartment built: 1938
Household type by relationship:
Households: 1,593- Male householders: 320 (73 living alone), Female householders: 307 (127 living alone)
358 spouses (358 opposite-sex spouses), 32 unmarried partners, (32 opposite-sex unmarried partners), 495 children (478 natural, 16 adopted, 0 stepchildren), 5 grandchildren, 0 brothers or sisters, 22 parents, 0 foster children, 31 other relatives, 15 non-relatives
Size of family households: 164 2-persons, 65 3-persons, 103 4-persons, 68 5-persons, 1 6-persons, 1 7-or-more-persons.
Size of nonfamily households: 213 1-person, 14 2-persons, 3 4-persons.
301 married couples with children.
36 single-parent households (2 men, 34 women).
86.8% of residents of Clarks Green speak English at home.
3.7% of residents speak Spanish at home (64% speak English very well, 29% speak English well, 7% speak English not well).
4.4% of residents speak other Indo-European language at home (39% speak English very well, 15% speak English well, 39% speak English not well, 7% don't speak English at all).
4.8% of residents speak Asian or Pacific Island language at home (70% speak English very well, 30% speak English not well).
Foreign born population: 147 (9.2%)
(81.0% of them are naturalized citizens)
| Here: | 7.2 |
| State: | 6.8 |
| Here: | 4.8 |
| State: | 4.3 |

- Bedrooms in owner-occupied houses and condos in Clarks Green, Pennsylvania
- 0no bedroom
- 01 bedroom
- 532 bedrooms
- 2733 bedrooms
- 1994 bedrooms
- 645+ bedrooms

- Bedrooms in renter-occupied apartments in Clarks Green, Pennsylvania
- 0no bedroom
- 141 bedroom
- 132 bedrooms
- 183 bedrooms
- 44 bedrooms
- 05+ bedrooms

- Cars and other vehicles available in Clarks Green in owner-occupied houses/condos
- 15no vehicle
- 1821 vehicle
- 2352 vehicles
- 1133 vehicles
- 454 vehicles
- 05+ vehicles

- Cars and other vehicles available in Clarks Green in renter-occupied apartments
- 9no vehicle
- 251 vehicle
- 82 vehicles
- 33 vehicles
- 44 vehicles
- 05+ vehicles

- Rooms in owner-occupied houses in Clarks Green, Pennsylvania
- 01 room
- 02 rooms
- 43 rooms
- 104 rooms
- 295 rooms
- 1286 rooms
- 1307 rooms
- 1258 rooms
- 1629+ rooms

- Rooms in renter-occupied apartments in Clarks Green, Pennsylvania
- 01 room
- 02 rooms
- 73 rooms
- 164 rooms
- 45 rooms
- 166 rooms
- 67 rooms
- 08 rooms
- 09+ rooms


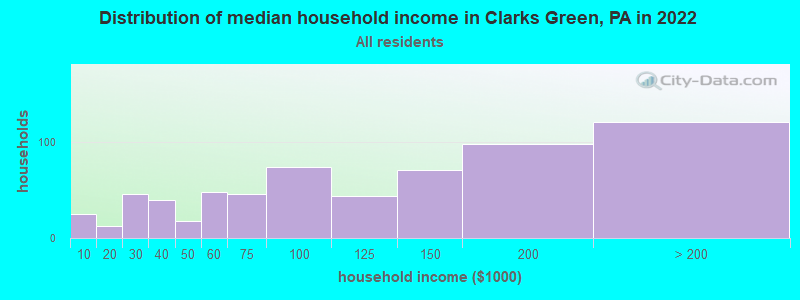
Clarks Green, PA household income distribution

- 25Less than $10,000
- 13$10,000 to $19,999
- 46$20,000 to $29,999
- 40$30,000 to $39,999
- 18$40,000 to $49,999
- 48$50,000 to $59,999
- 46$60,000 to $74,999
- 74$75,000 to $99,999
- 44$100,000 to $124,999
- 71$125,000 to $149,999
- 98$150,000 to $199,999
- 121$200,000 or more
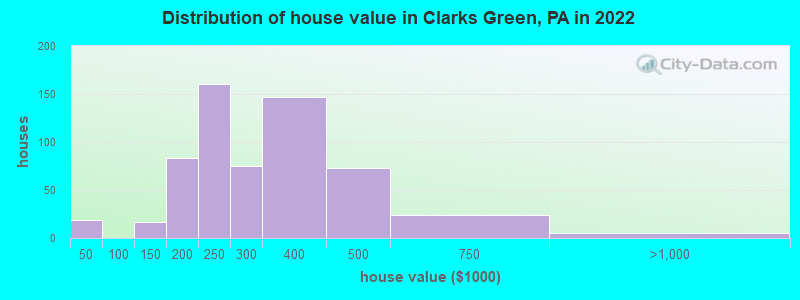
Home value of owner - occupied houses in 2022 in Clarks Green, PA
-
- 6Less than $10,000
- 12$20,000 to $24,999
- 2$100,000 to $124,999
- 14$125,000 to $149,999
- 44$150,000 to $174,999
- 38$175,000 to $199,999
- 160$200,000 to $249,999
- 74$250,000 to $299,999
- 147$300,000 to $399,999
- 72$400,000 to $499,999
- 24$500,000 to $749,999
- 4$750,000 to $999,999
Rent paid by renters in 2022 in Clarks Green, PA
-
- 2$600 to $649
- 3$800 to $899
- 7$900 to $999
- 5$1,000 to $1,249
- 5$1,250 to $1,499
- 7$1,500 to $1,999
- 11$2,000 to $2,499
- 12No cash rent


Percentage of workers working in this county: 77.9%
Number of people working at home: 122 (13.5% of all workers)
Travel time to work (commute)
- Less than 5 minutes: 44
- 5 to 9 minutes: 78
- 10 to 14 minutes: 149
- 15 to 19 minutes: 135
- 20 to 24 minutes: 165
- 25 to 29 minutes: 20
- 30 to 34 minutes: 59
- 35 to 39 minutes: 29
- 40 to 44 minutes: 23
- 45 to 59 minutes: 37
- 60 to 89 minutes: 18
- 90 or more minutes: 14
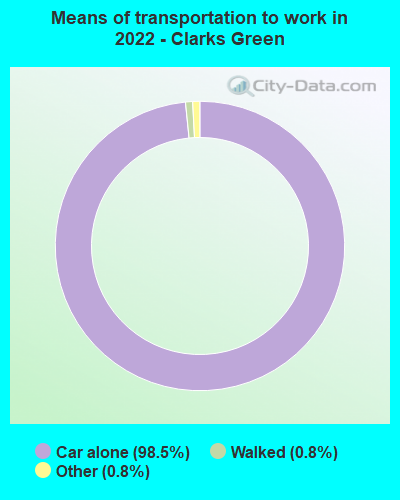
Means of transportation to work:
- Drove a car alone: 252 (68.9%)
- Taxi: 2 (0.5%)
- Walked: 1 (0.3%)
- Worked at home: 130 (35.5%)

- Unemployment by race in 2022
- Unemployment rate for White non-Hispanic residents
- 0.7%Males
- 0.6%Females

- Year of entry for the foreign-born population in Clarks Green, Pennsylvania
- 402010 or later
- 512000 to 2009
- 211990 to 1999
- 161980 to 1989
- 01970 to 1979
- 20Before 1970

First ancestries reported:
- Irish: 170 (34.6%)
- American: 57 (11.6%)
- Italian: 56 (11.4%)
- English: 36 (7.3%)
- Polish: 31 (6.3%)
- German: 18 (3.7%)
- Russian: 15 (3.1%)
- Eastern European: 14 (2.8%)
- British: 5 (1.0%)
- European: 5 (1.0%)
- Portuguese: 5 (1.0%)
- Slavic: 4 (0.8%)
- Scottish: 3 (0.6%)
- Ukrainian: 3 (0.6%)
- French: 2 (0.4%)
- Welsh: 2 (0.4%)
- Romanian: 1 (0.2%)
Most common places of birth for foreign-born residents (%):
| Clarks Green: | 32.2% (48) |
| Pennsylvania: | 10.7% (100,596) |
| Clarks Green: | 20.1% (30) |
| Pennsylvania: | 2.2% (21,039) |
| Clarks Green: | 6.7% (10) |
| Pennsylvania: | 0.8% (7,882) |
| Clarks Green: | 6.7% (10) |
| Pennsylvania: | 9.2% (86,544) |
| Clarks Green: | 6.0% (9) |
| Pennsylvania: | 1.6% (15,272) |
| Clarks Green: | 4.7% (7) |
| Pennsylvania: | 1.2% (11,211) |
| Clarks Green: | 4.7% (7) |
| Pennsylvania: | 0.5% (4,648) |
| Clarks Green: | 3.4% (5) |
| Pennsylvania: | 0.4% (4,113) |
| Clarks Green: | 2.7% (4) |
| Pennsylvania: | 1.1% (10,331) |
| Clarks Green: | 2.0% (3) |
| Pennsylvania: | 0.4% (4,198) |
| Clarks Green: | 2.0% (3) |
| Pennsylvania: | 0.2% (1,747) |
Place of birth for U.S.-born residents:
- This state: 1,134
- Other state: 302
- Northeast: 196
- Midwest: 20
- South: 75
- West: 9
95.5% of Clarks Green residents lived in the same house 1 years ago.
Out of people who lived in different houses, 21.4% lived in this county.
Out of people who lived in different counties, 52.2% lived in Pennsylvania.
| Clarks Green: | 95.5% |
| State average: | 89.3% |
Education attainment for males 25 years and older:
- No schooling: 9
- Nursery to 4th grade: 2
- 5th and 6th grade: 0
- 7th and 8th grade: 8
- 9th grade: 0
- 10th grade: 6
- 11th grade: 0
- 12th grade, no diploma: 0
- High school graduate (or equivalency): 82
- Less than 1 year of college: 6
- Some college more than 1 year, no degree: 43
- Associate degree: 82
- Bachelor's degree: 133
- Master's degree: 65
- Professional school degree: 55
- Doctorate degree: 47

Education attainment for females 25 years and older:
- No schooling: 0
- Nursery to 4th grade: 2
- 5th and 6th grade: 0
- 7th and 8th grade: 1
- 9th grade: 3
- 10th grade: 0
- 11th grade: 0
- 12th grade, no diploma: 0
- High school graduate (or equivalency): 97
- Less than 1 year of college: 23
- Some college more than 1 year, no degree: 38
- Associate degree: 56
- Bachelor's degree: 181
- Master's degree: 141
- Professional school degree: 22
- Doctorate degree: 11


Housing units in structures:
- One, detached: 667
- One, attached: 8
- Two: 17
- 3 or 4: 24
- 5 to 9: 8
Housing units lacking complete kitchen facilities in 2022: 2.1%
House/condo owner moved in on average 21 years ago
Renter moved in on average 12 years ago

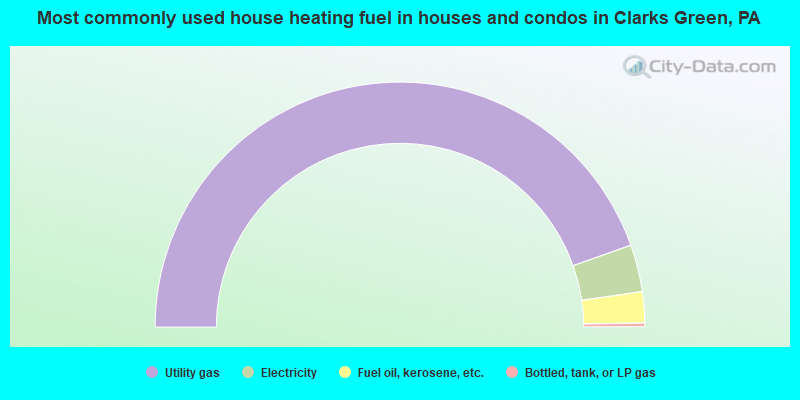
- 89.1%Utility gas
- 6.2%Electricity
- 4.1%Fuel oil, kerosene, etc.
- 0.5%Bottled, tank, or LP gas
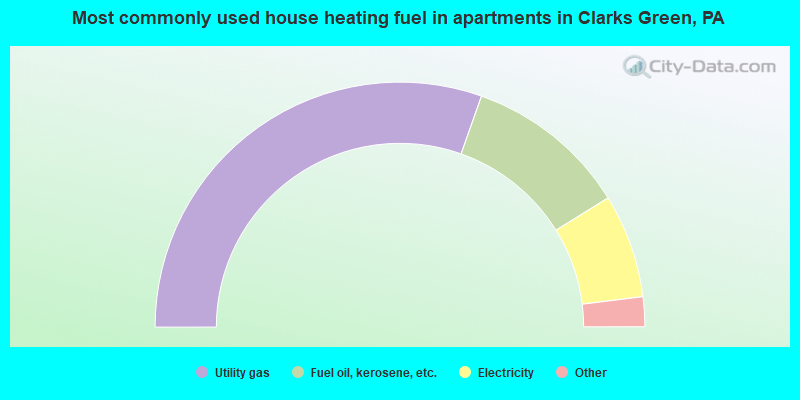
- 63.3%Utility gas
- 22.4%Fuel oil, kerosene, etc.
- 14.3%Electricity
Private vs. public school enrollment:
| Here: | 10.1% |
| Pennsylvania: | 15.7% |
| Here: | 9.9% |
| Pennsylvania: | 13.4% |
| Here: | 39.1% |
| Pennsylvania: | 39.8% |


