City of The Dalles, OR (Oregon) Houses and Residents
| City of The Dalles: | $337,860 |
| Oregon: | $475,600 |
Total population: 12,113 (All urban)
Houses: 5,246 (4,928 occupied: 3,151 owner occupied, 1,777 renter occupied)
| % of renters here: | 36% |
| State: | 37% |
Housing density: 998 houses/condos per square mile
Median price asked for vacant for-sale houses and condos in 2022 in this county: $314,160.
Median contract rent in 2022: $870 (lower quartile is $703, upper quartile is $1,181)
Median rent asked for vacant for-rent units in 2022: $745
Median gross rent in City of The Dalles, OR in 2022: $940
Housing units in City of The Dalles with a mortgage: 1,900 (199 second mortgage, 247 home equity loan, 0 both second mortgage and home equity loan)
Houses without a mortgage: 852


Household type by relationship:
Households: 24,472- In family households: 20,227 (4,636 male householders, 1,904 female householders)
4,954 spouses, 6,541 children (5,918 natural, 199 adopted, 424 stepchildren), 514 grandchildren, 230 brothers or sisters, 199 parents, foster children, 317 other relatives, 765 non-relatives
- In nonfamily households: 4,245 (1,668 male householders (1,328 living alone)), 1,823 female householders (1,558 living alone)), 754 nonrelatives
- In group quarters: 741 (421 institutionalized population)
3,925 married couples with children.
1,429 single-parent households (406 men, 1,023 women).
88.1% of residents of City of The Dalles speak English at home.
10.1% of residents speak Spanish at home (43% speak English very well, 29% speak English well, 23% speak English not well, 5% don't speak English at all).
1.2% of residents speak other Indo-European language at home (86% speak English very well, 4% speak English well, 10% speak English not well).
0.5% of residents speak Asian or Pacific Island language at home (23% speak English very well, 29% speak English well, 48% speak English not well).
0.1% of residents speak other language at home (69% speak English very well, 31% speak English well).
Foreign born population: 1,197 (7.7%)
(49.2% of them are naturalized citizens)
| Here: | 6.2 |
| State: | 6.2 |
| Here: | 5.2 |
| State: | 4.0 |

- Bedrooms in owner-occupied houses and condos in City of The Dalles, Oregon
- 5no bedroom
- 1131 bedroom
- 8272 bedrooms
- 1,4793 bedrooms
- 6204 bedrooms
- 1075+ bedrooms

- Bedrooms in renter-occupied apartments in City of The Dalles, Oregon
- 103no bedroom
- 5051 bedroom
- 7162 bedrooms
- 3273 bedrooms
- 914 bedrooms
- 355+ bedrooms

- Cars and other vehicles available in City of The Dalles in owner-occupied houses/condos
- 108no vehicle
- 8401 vehicle
- 1,4472 vehicles
- 5553 vehicles
- 1534 vehicles
- 485+ vehicles

- Cars and other vehicles available in City of The Dalles in renter-occupied apartments
- 343no vehicle
- 7781 vehicle
- 4942 vehicles
- 993 vehicles
- 154 vehicles
- 485+ vehicles

- Rooms in owner-occupied houses in City of The Dalles, Oregon
- 51 room
- 422 rooms
- 683 rooms
- 2984 rooms
- 6365 rooms
- 6326 rooms
- 5647 rooms
- 4888 rooms
- 4189+ rooms

- Rooms in renter-occupied apartments in City of The Dalles, Oregon
- 981 room
- 1812 rooms
- 2713 rooms
- 5024 rooms
- 3525 rooms
- 1926 rooms
- 797 rooms
- 658 rooms
- 379+ rooms


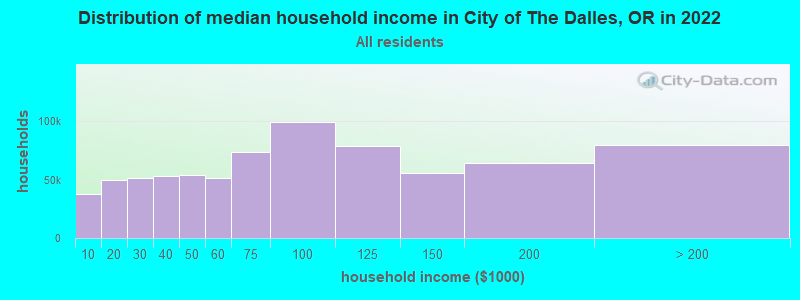
City of The Dalles, OR household income distribution

- 62,543Less than $10,000
- 83,210$10,000 to $19,999
- 82,828$20,000 to $29,999
- 86,936$30,000 to $39,999
- 86,501$40,000 to $49,999
- 84,532$50,000 to $59,999
- 122,430$60,000 to $74,999
- 160,631$75,000 to $99,999
- 130,549$100,000 to $124,999
- 90,666$125,000 to $149,999
- 105,972$150,000 to $199,999
- 132,012$200,000 or more
Percentage of workers working in this county: 89.1%
Number of people working at home: 1,377 (19.4% of all workers)
Travel time to work (commute)
- Less than 5 minutes: 570
- 5 to 9 minutes: 1,685
- 10 to 14 minutes: 1,326
- 15 to 19 minutes: 455
- 20 to 24 minutes: 207
- 25 to 29 minutes: 158
- 30 to 34 minutes: 257
- 35 to 39 minutes: 76
- 40 to 44 minutes: 60
- 45 to 59 minutes: 117
- 60 to 89 minutes: 92
- 90 or more minutes: 101
Means of transportation to work:
- Drove a car alone: 4,149 (78.6%)
- Carpooled: 598 (11.3%)
- Bus or trolley bus: 9 (0.2%)
- Streetcar or trolley car: 12 (0.2%)
- Motorcycle: 5 (0.1%)
- Bicycle: 6 (0.1%)
- Walked: 280 (5.3%)
- Other means: 45 (0.9%)
- Worked at home: 176 (3.3%)

- Year of entry for the foreign-born population in City of The Dalles, Oregon
- 1701995 to March 2000
- 1531990 to 1994
- 1701985 to 1989
- 831980 to 1984
- 571975 to 1979
- 811970 to 1974
- 351965 to 1969
- 82Before 1965

First ancestries reported:
- Other: 2,582 (20.0%)
- German: 2,525 (19.6%)
- English: 1,692 (13.1%)
- Irish: 1,478 (11.4%)
- Norwegian: 702 (5.4%)
- United States: 698 (5.4%)
- French: 620 (4.8%)
- Swedish: 448 (3.5%)
- Dutch: 312 (2.4%)
- Scottish: 309 (2.4%)
- Scotch-Irish: 293 (2.3%)
- Italian: 268 (2.1%)
- Danish: 194 (1.5%)
- Welsh: 167 (1.3%)
- Polish: 147 (1.1%)
- Czech: 96 (0.7%)
- French Canadian: 79 (0.6%)
- Portuguese: 74 (0.6%)
- Swiss: 61 (0.5%)
- Russian: 57 (0.4%)
- Greek: 46 (0.4%)
- Ukrainian: 28 (0.2%)
- Hungarian: 19 (0.1%)
- Arab: 18 (0.1%)
Most common places of birth for foreign-born residents (%):
| City of The Dalles: | 69.6% (578) |
| Oregon: | 39.0% (113,083) |
| City of The Dalles: | 4.1% (34) |
| Oregon: | 5.9% (17,137) |
| City of The Dalles: | 4.0% (33) |
| Oregon: | 3.0% (8,568) |
| City of The Dalles: | 3.6% (30) |
| Oregon: | 5.7% (16,523) |
| City of The Dalles: | 3.2% (27) |
| Oregon: | 3.3% (9,473) |
| City of The Dalles: | 2.8% (23) |
| Oregon: | 0.7% (2,012) |
| City of The Dalles: | 2.5% (21) |
| Oregon: | 0.5% (1,336) |
Place of birth for U.S.-born residents:
- This state: 5,694
- Other state: 5,639
- Northeast: 228
- Midwest: 1,415
- South: 736
- West: 3,260
45% of City of The Dalles residents lived in the same house 5 years ago.
Out of people who lived in different houses, 56% lived in this county.
Out of people who lived in different counties, 48% lived in Oregon.
Education attainment for males 25 years and older:
- No schooling: 26
- Nursery to 4th grade: 11
- 5th and 6th grade: 56
- 7th and 8th grade: 157
- 9th grade: 89
- 10th grade: 105
- 11th grade: 161
- 12th grade, no diploma: 118
- High school graduate (or equivalency): 1,289
- Less than 1 year of college: 335
- Some college more than 1 year, no degree: 588
- Associate degree: 263
- Bachelor's degree: 470
- Master's degree: 134
- Professional school degree: 96
- Doctorate degree: 30

Education attainment for females 25 years and older:
- No schooling: 28
- Nursery to 4th grade: 24
- 5th and 6th grade: 41
- 7th and 8th grade: 77
- 9th grade: 98
- 10th grade: 140
- 11th grade: 78
- 12th grade, no diploma: 151
- High school graduate (or equivalency): 1,575
- Less than 1 year of college: 522
- Some college more than 1 year, no degree: 745
- Associate degree: 255
- Bachelor's degree: 448
- Master's degree: 116
- Professional school degree: 36
- Doctorate degree: 16


Housing units in structures:
- One, detached: 3,618
- One, attached: 123
- Two: 333
- 3 or 4: 235
- 5 to 9: 186
- 10 to 19: 220
- 20 to 49: 208
- 50 or more: 27
- Mobile homes: 272
- Boats, RVs, vans, etc.: 24
Median worth of mobile homes: $149,891
Housing units lacking complete kitchen facilities: 1.0%

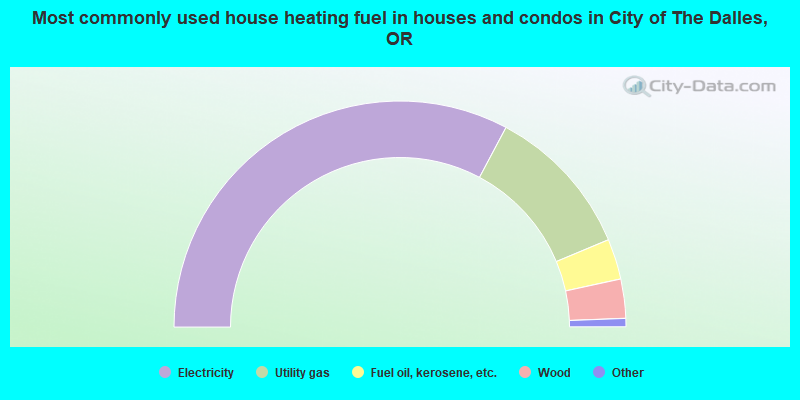
- 65.5%Electricity
- 21.8%Utility gas
- 5.8%Fuel oil, kerosene, etc.
- 5.6%Wood
- 0.6%Other fuel
- 0.4%Bottled, tank, or LP gas
- 0.2%No fuel used
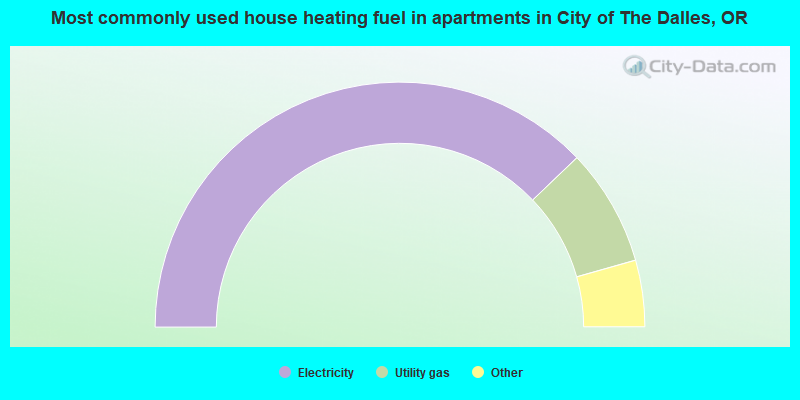
- 75.7%Electricity
- 15.5%Utility gas
- 3.6%Fuel oil, kerosene, etc.
- 2.4%Wood
- 1.8%Other fuel
- 0.7%No fuel used
- 0.3%Bottled, tank, or LP gas
Private vs. public school enrollment:
| Here: | 9.9% |
| Oregon: | 9.7% |
| Here: | 5.6% |
| Oregon: | 7.6% |
| Here: | 14.4% |
| Oregon: | 16.1% |


