Housing density: 2,402 houses/condos per square mile
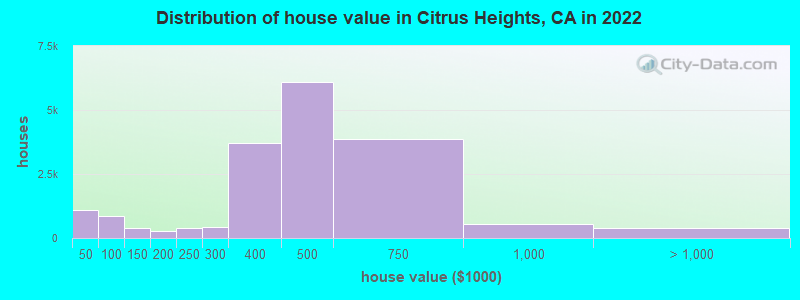
Median price asked for vacant for-sale houses and condos in 2022: $238,354.
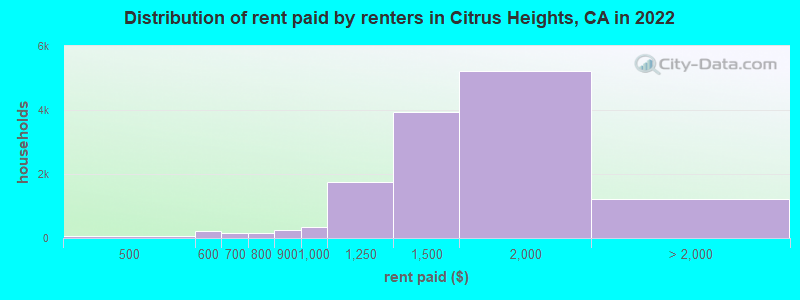
Median contract rent in 2022: $1,474 (lower quartile is $1,250, upper quartile is $1,764)
Median rent asked for vacant for-rent units in 2022: $2,118
Median gross rent in Citrus Heights, CA in 2022: $1,691
Housing units in Citrus Heights with a mortgage: 13,918 (843 second mortgage, 137 home equity loan, 651 both second mortgage and home equity loan) Houses without a mortgage: 240
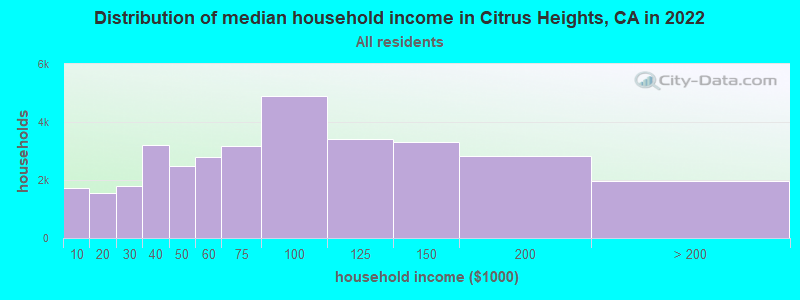
Median household income for houses/condos with a mortgage: $99,420
Median household income for apartments without a mortgage: $61,802
Median monthly housing costs: $1,617
Compare current foreclosures in Citrus Heights, CA:
10,446 married couples with children.
3,486 single-parent households (1,135 men, 2,351 women).
77.6% of residents of Citrus Heights speak English at home.
10.3% of residents speak Spanish at home (64% speak English very well, 16% speak English well, 15% speak English not well, 5% don't speak English at all).
8.7% of residents speak other Indo-European language at home (45% speak English very well, 29% speak English well, 21% speak English not well, 5% don't speak English at all).
2.7% of residents speak Asian or Pacific Island language at home (49% speak English very well, 30% speak English well, 19% speak English not well, 2% don't speak English at all).
0.3% of residents speak other language at home (53% speak English very well, 28% speak English well, 15% speak English not well, 4% don't speak English at all).
Foreign born population: 15,175 (17.6%)
(57.8% of them are naturalized citizens)
Percentage of workers working in this county: 71.5% Number of people working at home: 7,556 (17.5% of all workers)
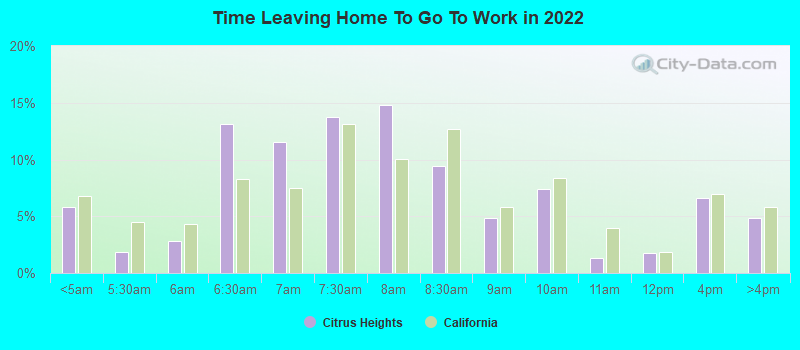
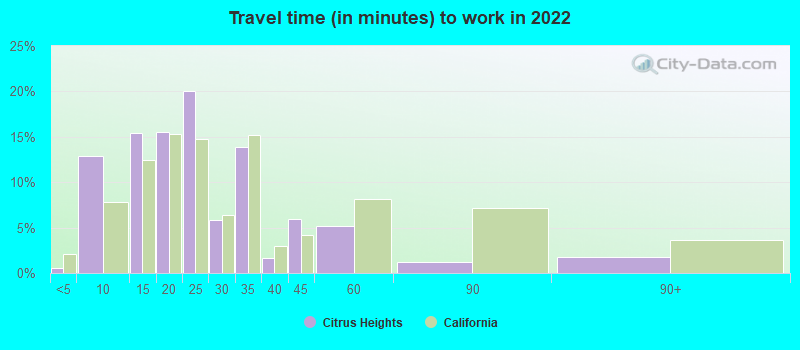
Travel time to work (commute)
Less than 5 minutes: 377
5 to 9 minutes: 2,379
10 to 14 minutes: 4,408
15 to 19 minutes: 6,557
20 to 24 minutes: 5,294
25 to 29 minutes: 2,622
30 to 34 minutes: 8,098
35 to 39 minutes: 1,355
40 to 44 minutes: 758
45 to 59 minutes: 2,270
60 to 89 minutes: 1,094
90 or more minutes: 1,366
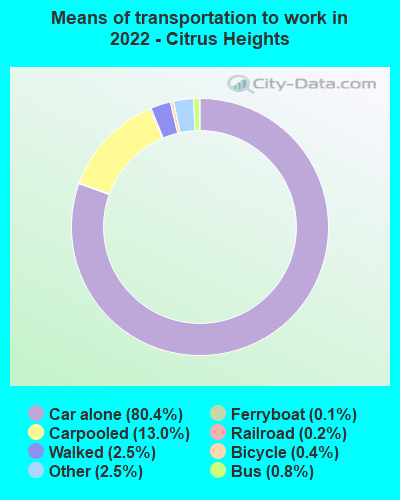
Means of transportation to work:
Drove a car alone: 12,861 (56.7%)
Carpooled: 2,150 (9.5%)
Bus: 71 (0.3%)
Light rail, streetcar or trolley: 18 (0.1%)
Ferryboat: 15 (0.1%)
Taxi: 490 (2.2%)
Bicycle: 49 (0.2%)
Walked: 450 (2.0%)
Worked at home: 7,556 (33.3%)
Unemployment by race in 2022
Unemployment rate for White non-Hispanic residents
1.2%Males
1.4%Females
Unemployment rate for Black residents
19.7%Males
10.7%Females
Unemployment rate for American Indian and Alaska Native residents
4.9%Females
Unemployment rate for Asian residents
2.8%Males
8.1%Females
Unemployment rate for other race residents
1.2%Males
4.1%Females
Unemployment rate for two or more race residents
12.0%Males
6.7%Females
Unemployment rate for Hispanic or Latino residents
3.0%Males
3.8%Females
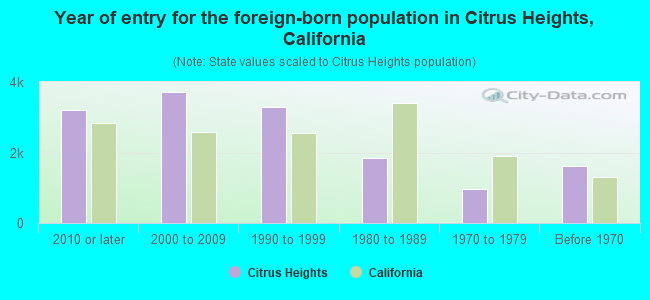
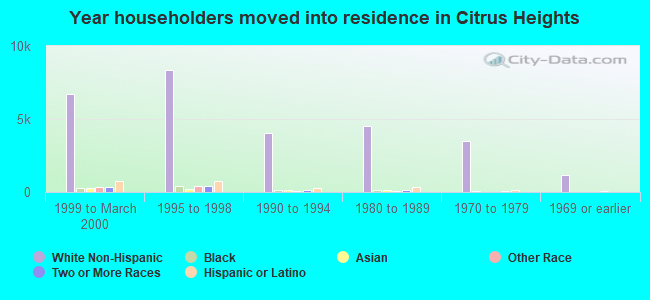
Year of entry for the foreign-born population in Citrus Heights, California
3,1962010 or later
3,7042000 to 2009
3,2891990 to 1999
1,8311980 to 1989
9611970 to 1979
1,613Before 1970
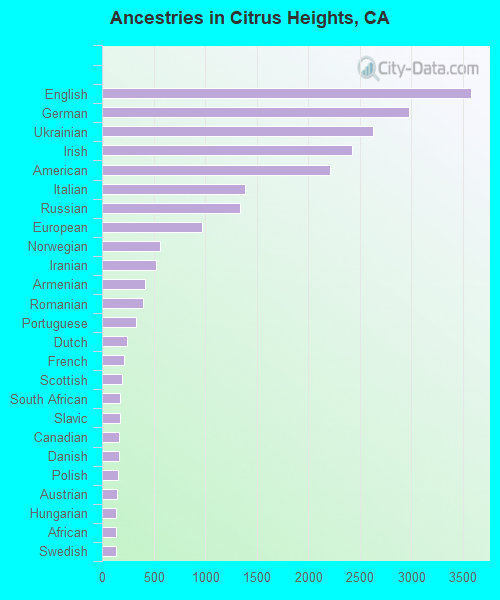
First ancestries reported:
English: 3,575 (9.0%)
German: 2,975 (7.5%)
Ukrainian: 2,627 (6.6%)
Irish: 2,426 (6.1%)
American: 2,208 (5.5%)
Italian: 1,391 (3.5%)
Russian: 1,334 (3.3%)
European: 968 (2.4%)
Norwegian: 561 (1.4%)
Iranian: 521 (1.3%)
Armenian: 413 (1.0%)
Romanian: 400 (1.0%)
Portuguese: 328 (0.8%)
Dutch: 241 (0.6%)
French: 214 (0.5%)
Scottish: 190 (0.5%)
South African: 179 (0.4%)
Slavic: 177 (0.4%)
Canadian: 164 (0.4%)
Danish: 162 (0.4%)
Polish: 156 (0.4%)
Austrian: 147 (0.4%)
Hungarian: 140 (0.4%)
African: 139 (0.3%)
Swedish: 138 (0.3%)
Scandinavian: 123 (0.3%)
Eastern European: 122 (0.3%)
Greek: 104 (0.3%)
Arab: 87 (0.2%)
Estonian: 84 (0.2%)
Brazilian: 75 (0.2%)
Syrian: 73 (0.2%)
Scotch-Irish: 72 (0.2%)
Lebanese: 67 (0.2%)
Yugoslavian: 64 (0.2%)
British: 58 (0.1%)
French Canadian: 46 (0.1%)
Welsh: 45 (0.1%)
Nigerian: 38 (0.10%)
Soviet Union: 37 (0.09%)
Jamaican: 29 (0.07%)
Egyptian: 27 (0.07%)
Czech: 26 (0.07%)
Lithuanian: 22 (0.06%)
Finnish: 21 (0.05%)
Swiss: 21 (0.05%)
Trinidadian and Tobagonian: 21 (0.05%)
Israeli: 17 (0.04%)
Croatian: 16 (0.04%)
Iraqi: 15 (0.04%)
Afghan: 14 (0.04%)
Bulgarian: 14 (0.04%)
Northern European: 13 (0.03%)
Slovak: 13 (0.03%)
Liberian: 13 (0.03%)
Belgian: 12 (0.03%)
Serbian: 7 (0.02%)
Turkish: 7 (0.02%)
Australian: 6 (0.02%)
Latvian: 6 (0.02%)
Pennsylvania German: 6 (0.02%)
Most common places of birth for foreign-born residents (%):
Mexico
Citrus Heights:
22.4% (2,947)
California:
37.2% (3,881,193)
Ukraine
Citrus Heights:
17.8% (2,345)
California:
0.6% (60,761)
Philippines
Citrus Heights:
8.6% (1,137)
California:
7.8% (818,297)
Russia
Citrus Heights:
7.1% (932)
California:
0.7% (71,932)
Iran
Citrus Heights:
3.5% (457)
California:
2.0% (206,004)
Vietnam
Citrus Heights:
2.7% (351)
California:
4.9% (512,335)
Belarus
Citrus Heights:
2.3% (300)
California:
0.1% (11,157)
Romania
Citrus Heights:
2.2% (293)
California:
0.2% (23,058)
Armenia
Citrus Heights:
2.2% (291)
California:
0.8% (78,847)
Guatemala
Citrus Heights:
2.1% (281)
California:
2.8% (290,436)
Canada
Citrus Heights:
2.0% (267)
California:
1.2% (127,477)
Other Eastern Europe
Citrus Heights:
1.9% (247)
California:
0.2% (17,699)
Pakistan
Citrus Heights:
1.9% (246)
California:
0.5% (49,399)
Moldova
Citrus Heights:
1.8% (239)
California:
0.1% (10,171)
Germany
Citrus Heights:
1.8% (231)
California:
0.7% (73,304)
Place of birth for U.S.-born residents:
This state: 55,507
Other state: 14,392
Northeast: 2,224
Midwest: 3,469
South: 3,203
West: 5,496
88.8% of Citrus Heights residents lived in the same house 1 years ago. Out of people who lived in different houses, 40.0% lived in this county. Out of people who lived in different counties, 84.1% lived in California.
Citrus Heights:
88.8%
State average:
88.9%
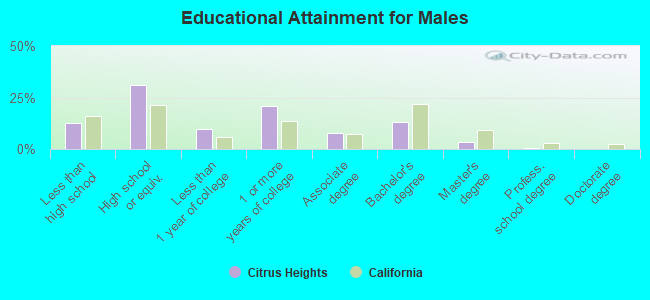
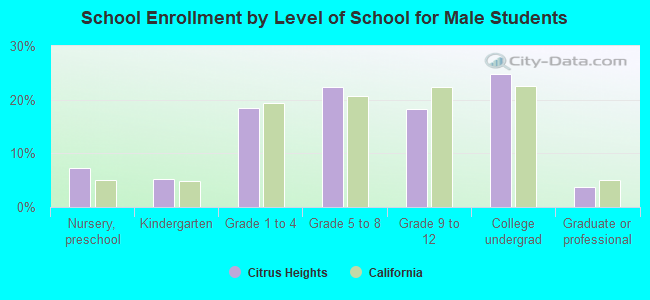
Education attainment for males 25 years and older:
No schooling: 1,107
Nursery to 4th grade: 96
5th and 6th grade: 391
7th and 8th grade: 116
9th grade: 295
10th grade: 377
11th grade: 391
12th grade, no diploma: 1,186
High school graduate (or equivalency): 9,594
Less than 1 year of college: 3,056
Some college more than 1 year, no degree: 6,514
Associate degree: 2,420
Bachelor's degree: 4,117
Master's degree: 1,073
Professional school degree: 120
Doctorate degree: 52
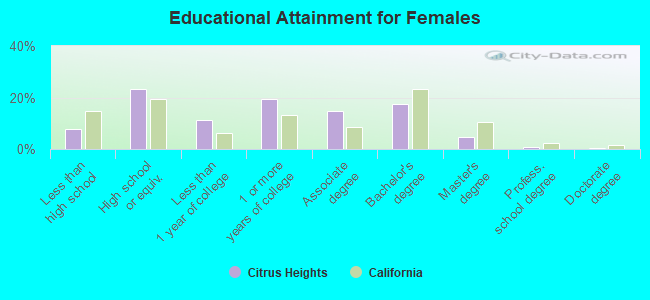
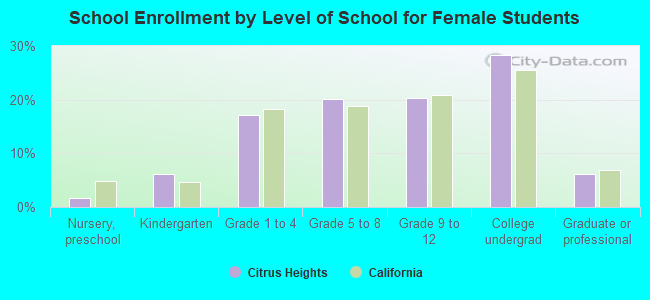
Education attainment for females 25 years and older:
No schooling: 658
Nursery to 4th grade: 43
5th and 6th grade: 0
7th and 8th grade: 343
9th grade: 307
10th grade: 304
11th grade: 373
12th grade, no diploma: 431
High school graduate (or equivalency): 7,512
Less than 1 year of college: 3,678
Some college more than 1 year, no degree: 6,202
Associate degree: 4,774
Bachelor's degree: 5,673
Master's degree: 1,518
Professional school degree: 287
Doctorate degree: 80
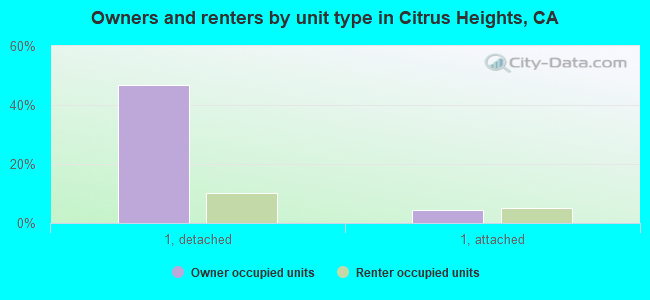
Housing units in structures:
One, detached: 20,597
One, attached: 2,744
Two: 539
3 or 4: 1,918
5 to 9: 2,312
10 to 19: 1,121
20 to 49: 540
50 or more: 2,388
Mobile homes: 2,174
Boats, RVs, vans, etc.: 126
Median worth of mobile homes: $80,800
Housing units lacking complete plumbing facilities in 2022: 0.9%
Housing units lacking complete kitchen facilities in 2022: 1.8%
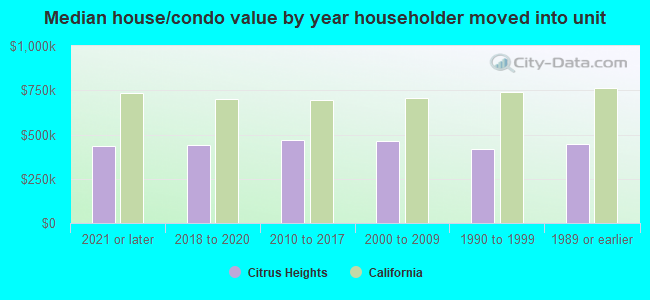
House/condo owner moved in on average 11 years ago