Cicero, IN (Indiana) Houses and Residents
| Cicero: | $260,134 |
| Indiana: | $208,700 |
Mean price in 2022:
Detached houses: $311,782
Here: $311,782 State: $257,916 Townhouses or other attached units: $310,532
Here: $310,532 State: $224,114 Mobile homes: $61,782
Here: $61,782 State: $67,116
Total population: 4,891 (Urban population: 3,990, Rural population: 0)
Houses: 2,526 (2,445 occupied: 1,983 owner occupied, 437 renter occupied)
| % of renters here: | 18% |
| State: | 29% |
Housing density: 1,689 houses/condos per square mile
Median price asked for vacant for-sale houses and condos in 2022 in this county: $922,622.
Median contract rent in 2022: $935 (lower quartile is $826, upper quartile is $1,371)
Median rent asked for vacant for-rent units in 2022: $944
Median gross rent in Cicero, IN in 2022: $1,168
Housing units in Cicero with a mortgage: 1,005 (85 second mortgage, 0 home equity loan, 61 both second mortgage and home equity loan)
Houses without a mortgage: 49
Median household income for houses/condos with a mortgage: $106,937
Median household income for apartments without a mortgage: $62,490
Median monthly housing costs: $1,016
Compare current foreclosures near Cicero, IN:
| Photo | Address | Area | Beds / Baths | Price | Details |
|---|---|---|---|---|---|

|
#1
S Peru St
Cicero, IN 46034
|
1,200 sq. feet
|
2 baths 3 beds |
show details | |

|
#2
S Harrison St
Cicero, IN 46034
|
2,426 sq. feet
|
3 baths 3 beds |
show details | |

|
#3
Mount Pleasant Rd
Cicero, IN 46034
|
1,704 sq. feet
|
1 baths 3 beds |
show details | |

|
#4
Morse Landing Dr
Cicero, IN 46034
|
2,193 sq. feet
|
2 baths 3 beds |
show details | |

|
#5
Gull Ct
Cicero, IN 46034
|
2,256 sq. feet
|
2 baths 3 beds |
show details | |

|
#6
Vos Hiatt Ave
Cicero, IN 46034
|
1,801 sq. feet
|
2 baths 3 beds |
show details | |

|
#7
S Harrison St
Cicero, IN 46034
|
- sq. feet
|
- baths - beds |
show details | |

|
#8
E 226th St
Cicero, IN 46034
|
- sq. feet
|
- baths - beds |
show details | |

|
#9
Voss Hiatt Avenue
Cicero, IN 46034
|
- sq. feet
|
- baths - beds |
show details | |

|
#10
Oak Hill Ln
Cicero, IN 46034
|
- sq. feet
|
- baths - beds |
show details |
| Photo | Address | Area | Beds / Baths | Price | Details |
|---|---|---|---|---|---|

|
#11
Shoreline Dr
Cicero, IN 46034
|
- sq. feet
|
- baths - beds |
show details | |

|
#12
Coral Springs Dr
Cicero, IN 46034
|
- sq. feet
|
- baths - beds |
show details | |

|
#13
Senator Way
Carmel, IN 46032
|
2,379 sq. feet
|
3 baths 3 beds |
show details | |

|
#14
Weathered Edge Dr
Fishers, IN 46037
|
1,406 sq. feet
|
2 baths 3 beds |
show details | |

|
#15
Aspen Dr
Fishers, IN 46037
|
1,872 sq. feet
|
3 baths 3 beds |
show details | |

|
#16
Sand Creek Blvd
Fishers, IN 46037
|
1,626 sq. feet
|
2 baths 4 beds |
show details | |

|
#17
Clearview Dr
Carmel, IN 46033
|
5,475 sq. feet
|
5 baths 4 beds |
show details | |

|
#18
Champions Blvd
Fishers, IN 46037
|
2,105 sq. feet
|
3 baths 3 beds |
show details | |

|
#19
Courage Xing
Fishers, IN 46037
|
1,860 sq. feet
|
3 baths 3 beds |
show details | |

|
#20
Blue Springs Ln
Fishers, IN 46037
|
1,572 sq. feet
|
2 baths 4 beds |
show details |
| Photo | Address | Area | Beds / Baths | Price | Details |
|---|---|---|---|---|---|

|
#21
Jerkwater Rd
Sheridan, IN 46069
|
1,449 sq. feet
|
2 baths 3 beds |
show details | |

|
#22
Maryport Dr
Westfield, IN 46074
|
3,884 sq. feet
|
3 baths 4 beds |
show details | |

|
#23
Shadetree Ct
Sheridan, IN 46069
|
1,692 sq. feet
|
2 baths 4 beds |
show details | |

|
#24
Timberlake Ln
Fishers, IN 46038
|
1,668 sq. feet
|
2 baths 3 beds |
show details | |

|
#25
Stanwich Pl
Carmel, IN 46033
|
2,762 sq. feet
|
2 baths 4 beds |
show details | |

|
#26
Witherbee Ln
Fishers, IN 46037
|
4,045 sq. feet
|
4 baths 3 beds |
show details | |

|
#27
Bentley Way
Carmel, IN 46032
|
2,280 sq. feet
|
3 baths 3 beds |
show details | |

|
#28
Tamworth Dr
Fishers, IN 46037
|
1,540 sq. feet
|
3 baths 3 beds |
show details | |

|
#29
Bristow Ln
Fishers, IN 46037
|
2,420 sq. feet
|
4 baths 3 beds |
show details | |

|
#30
Heather Dr
Carmel, IN 46032
|
1,958 sq. feet
|
3 baths 3 beds |
show details |
| Photo | Address | Area | Beds / Baths | Price | Details |
|---|---|---|---|---|---|

|
#31
E State Road 38
Sheridan, IN 46069
|
1,968 sq. feet
|
2 baths 3 beds |
show details | |

|
#32
Marsden Dr
Westfield, IN 46074
|
3,365 sq. feet
|
4 baths 3 beds |
show details | |

|
#33
S California St
Sheridan, IN 46069
|
1,008 sq. feet
|
1 baths 2 beds |
show details | |

|
#34
Brookshire Pkwy
Carmel, IN 46033
|
2,462 sq. feet
|
3 baths 4 beds |
show details | |

|
#35
Forest Dr
Carmel, IN 46033
|
3,008 sq. feet
|
3 baths 4 beds |
show details | |

|
#36
Cyntheanne Rd
Fishers, IN 46037
|
1,546 sq. feet
|
2 baths 4 beds |
show details | |

|
#37
Harvest Knoll Ct
Fishers, IN 46037
|
5,155 sq. feet
|
5 baths 4 beds |
show details | |

|
#38
Lois Way
Carmel, IN 46032
|
3,797 sq. feet
|
3 baths 3 beds |
show details | |

|
#39
Crossing Dr
Fishers, IN 46037
|
1,797 sq. feet
|
3 baths 3 beds |
show details | |

|
#40
Merlot Ln
Fishers, IN 46037
|
1,935 sq. feet
|
2 baths 4 beds |
show details |
| Photo | Address | Area | Beds / Baths | Price | Details |
|---|---|---|---|---|---|

|
#41
E 106th St
Fishers, IN 46038
|
3,707 sq. feet
|
4 baths 4 beds |
show details | |

|
#42
Essex Ct
Carmel, IN 46033
|
2,105 sq. feet
|
2 baths 3 beds |
show details | |

|
#43
Annandale Dr
Carmel, IN 46033
|
2,403 sq. feet
|
3 baths 3 beds |
show details | |

|
#44
Ironwood Dr
Carmel, IN 46033
|
2,594 sq. feet
|
2 baths 5 beds |
show details | |

|
#45
Jayson Cir
Westfield, IN 46074
|
1,840 sq. feet
|
3 baths 3 beds |
show details | |

|
#46
Hawks Way
Carmel, IN 46033
|
4,213 sq. feet
|
5 baths 4 beds |
show details | |

|
#47
Farmland Ct
Noblesville, IN 46060
|
1,506 sq. feet
|
2 baths 4 beds |
show details | |

|
#48
Wolf Run Ct
Noblesville, IN 46060
|
2,736 sq. feet
|
3 baths 3 beds |
show details | |

|
#49
Old Pond Cir
Noblesville, IN 46060
|
1,710 sq. feet
|
3 baths 3 beds |
show details | |

|
Check over 1 million property listings on Foreclosure.com!
|
browse all offers | |||

Latest news about housing in Cicero, IN collected exclusively by city-data.com from local newspapers, TV, and radio stations

 | Indianapolis Area Tiers (9 replies) |
| Apartments between Walkerton & Fishers (5 replies) |
| Greencastle Up and Coming? (17 replies) |
| New homes in the Noblesville/Fishers area in the $200k range without vinyl? (15 replies) |
| Considering Indiana for a potential relocation (122 replies) |
| Suburban growth in the far NE side (12 replies) |

Median year apartment built: 1971
Household type by relationship:
Households: 5,591- Male householders: 1,452 (368 living alone), Female householders: 962 (195 living alone)
1,389 spouses (1,389 opposite-sex spouses), 92 unmarried partners, (92 opposite-sex unmarried partners), 1,289 children (1,263 natural, 0 adopted, 26 stepchildren), 144 grandchildren, 0 brothers or sisters, 32 parents, 133 foster children, 59 other relatives, 35 non-relatives
Size of family households: 994 2-persons, 496 3-persons, 191 4-persons, 97 5-persons, 28 7-or-more-persons.
Size of nonfamily households: 622 1-person, 30 2-persons, 6 3-persons.
457 married couples with children.
543 single-parent households (161 men, 382 women).
98.3% of residents of Cicero speak English at home.
0.3% of residents speak Spanish at home (100% speak English very well).
0.4% of residents speak other Indo-European language at home (100% speak English well).
Foreign born population: 19 (0.3%)
(105.3% of them are naturalized citizens)
| Here: | 6.2 |
| State: | 6.6 |
| Here: | 5.3 |
| State: | 4.3 |

- Bedrooms in owner-occupied houses and condos in Cicero, Indiana
- 0no bedroom
- 1601 bedroom
- 3192 bedrooms
- 1,0743 bedrooms
- 3554 bedrooms
- 755+ bedrooms

- Bedrooms in renter-occupied apartments in Cicero, Indiana
- 27no bedroom
- 351 bedroom
- 1112 bedrooms
- 2293 bedrooms
- 364 bedrooms
- 05+ bedrooms

- Cars and other vehicles available in Cicero in owner-occupied houses/condos
- 0no vehicle
- 4191 vehicle
- 1,0372 vehicles
- 4333 vehicles
- 944 vehicles
- 05+ vehicles

- Cars and other vehicles available in Cicero in renter-occupied apartments
- 0no vehicle
- 2311 vehicle
- 1982 vehicles
- 83 vehicles
- 04 vehicles
- 05+ vehicles

- Rooms in owner-occupied houses in Cicero, Indiana
- 01 room
- 172 rooms
- 1433 rooms
- 634 rooms
- 3595 rooms
- 5186 rooms
- 2337 rooms
- 2788 rooms
- 3729+ rooms

- Rooms in renter-occupied apartments in Cicero, Indiana
- 271 room
- 02 rooms
- 03 rooms
- 1264 rooms
- 835 rooms
- 1076 rooms
- 607 rooms
- 08 rooms
- 369+ rooms


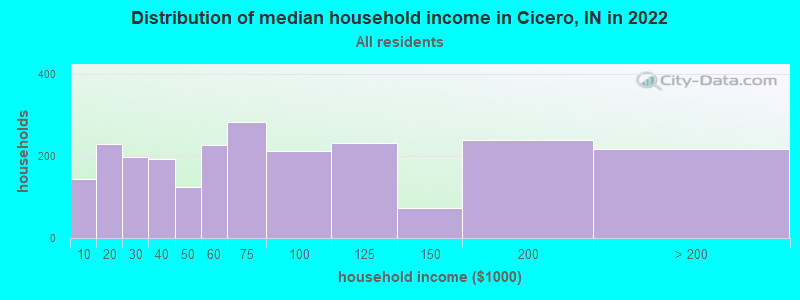
Cicero, IN household income distribution

- 143Less than $10,000
- 229$10,000 to $19,999
- 197$20,000 to $29,999
- 193$30,000 to $39,999
- 125$40,000 to $49,999
- 228$50,000 to $59,999
- 283$60,000 to $74,999
- 212$75,000 to $99,999
- 232$100,000 to $124,999
- 74$125,000 to $149,999
- 238$150,000 to $199,999
- 216$200,000 or more
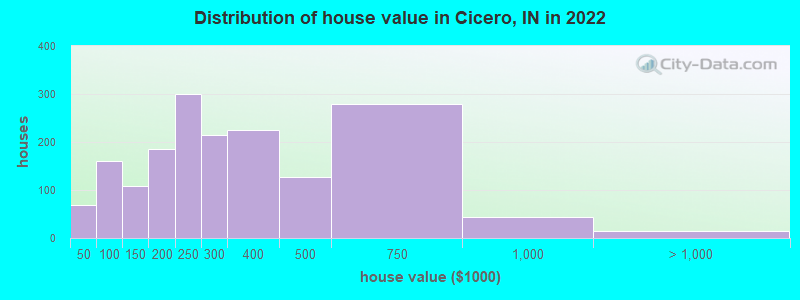
Home value of owner - occupied houses in 2022 in Cicero, IN
-
- 38Less than $10,000
- 31$40,000 to $49,999
- 21$60,000 to $69,999
- 53$70,000 to $79,999
- 19$80,000 to $89,999
- 34$90,000 to $99,999
- 40$100,000 to $124,999
- 69$125,000 to $149,999
- 110$150,000 to $174,999
- 75$175,000 to $199,999
- 301$200,000 to $249,999
- 214$250,000 to $299,999
- 225$300,000 to $399,999
- 128$400,000 to $499,999
- 278$500,000 to $749,999
- 44$750,000 to $999,999
- 13$1,000,000 to $1,499,999
Rent paid by renters in 2022 in Cicero, IN
-
- 33$150 to $199
- 30$600 to $649
- 54$750 to $799
- 86$800 to $899
- 40$900 to $999
- 44$1,000 to $1,249
- 127$1,250 to $1,499


Percentage of workers working in this county: 66.2%
Number of people working at home: 382 (14.1% of all workers)
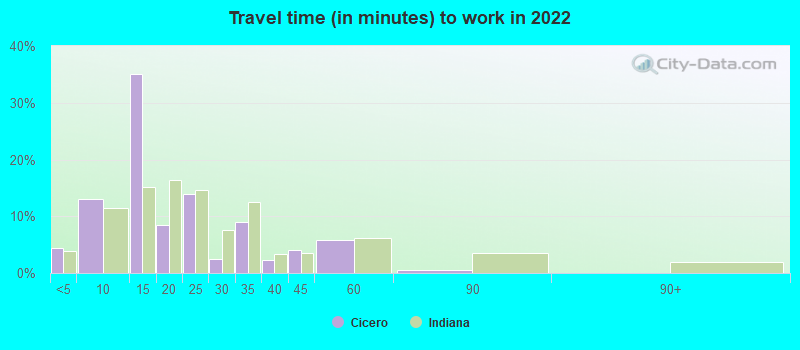
Travel time to work (commute)
- Less than 5 minutes: 68
- 5 to 9 minutes: 83
- 10 to 14 minutes: 207
- 15 to 19 minutes: 272
- 20 to 24 minutes: 190
- 25 to 29 minutes: 163
- 30 to 34 minutes: 566
- 35 to 39 minutes: 96
- 40 to 44 minutes: 192
- 45 to 59 minutes: 346
- 60 to 89 minutes: 79
- 90 or more minutes: 0
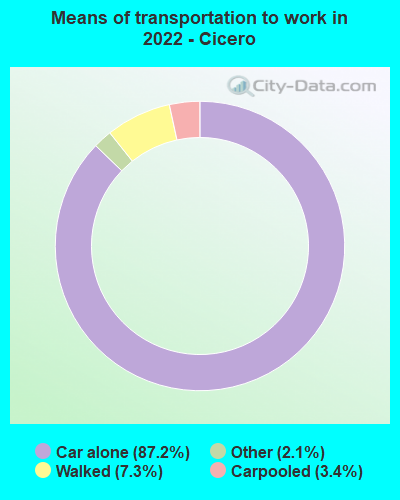
Means of transportation to work:
- Drove a car alone: 582 (54.8%)
- Carpooled: 32 (3.0%)
- Taxi: 19 (1.8%)
- Walked: 46 (4.3%)
- Worked at home: 382 (35.9%)

- Unemployment by race in 2022
- Unemployment rate for White non-Hispanic residents
- 1.1%Females

- Year of entry for the foreign-born population in Cicero, Indiana
- 02010 or later
- 02000 to 2009
- 01990 to 1999
- 71980 to 1989
- 01970 to 1979
- 38Before 1970

First ancestries reported:
- English: 924 (35.4%)
- German: 749 (28.7%)
- American: 301 (11.5%)
- Irish: 180 (6.9%)
- Eastern European: 111 (4.3%)
- Polish: 51 (2.0%)
- Dutch: 25 (1.0%)
- Austrian: 23 (0.9%)
- Scottish: 22 (0.8%)
- Northern European: 21 (0.8%)
- Ukrainian: 20 (0.8%)
- Scotch-Irish: 15 (0.6%)
- Welsh: 14 (0.5%)
- European: 9 (0.3%)
- Italian: 7 (0.3%)
- Greek: 6 (0.2%)
Most common places of birth for foreign-born residents (%):
| Cicero: | 42.1% (8) |
| Indiana: | 0.6% (2,303) |
| Cicero: | 36.8% (7) |
| Indiana: | 0.7% (2,504) |
Place of birth for U.S.-born residents:
- This state: 4,379
- Other state: 1,189
- Northeast: 72
- Midwest: 719
- South: 184
- West: 248
84.6% of Cicero residents lived in the same house 1 years ago.
Out of people who lived in different houses, 48.9% lived in this county.
Out of people who lived in different counties, 51.8% lived in Indiana.
| Cicero: | 84.6% |
| State average: | 87.1% |
Education attainment for males 25 years and older:
- No schooling: 0
- Nursery to 4th grade: 75
- 5th and 6th grade: 0
- 7th and 8th grade: 32
- 9th grade: 0
- 10th grade: 0
- 11th grade: 33
- 12th grade, no diploma: 17
- High school graduate (or equivalency): 476
- Less than 1 year of college: 147
- Some college more than 1 year, no degree: 271
- Associate degree: 181
- Bachelor's degree: 605
- Master's degree: 137
- Professional school degree: 30
- Doctorate degree: 30

Education attainment for females 25 years and older:
- No schooling: 0
- Nursery to 4th grade: 0
- 5th and 6th grade: 0
- 7th and 8th grade: 0
- 9th grade: 0
- 10th grade: 92
- 11th grade: 6
- 12th grade, no diploma: 0
- High school graduate (or equivalency): 764
- Less than 1 year of college: 123
- Some college more than 1 year, no degree: 312
- Associate degree: 195
- Bachelor's degree: 405
- Master's degree: 101
- Professional school degree: 0
- Doctorate degree: 12


Housing units in structures:
- One, detached: 1,959
- One, attached: 19
- Two: 22
- 3 or 4: 272
- 10 to 19: 37
- Mobile homes: 215
Median worth of mobile homes: $103,853
Housing units lacking complete kitchen facilities in 2022: 3.2%
House/condo owner moved in on average 10 years ago
Renter moved in on average 2 years ago

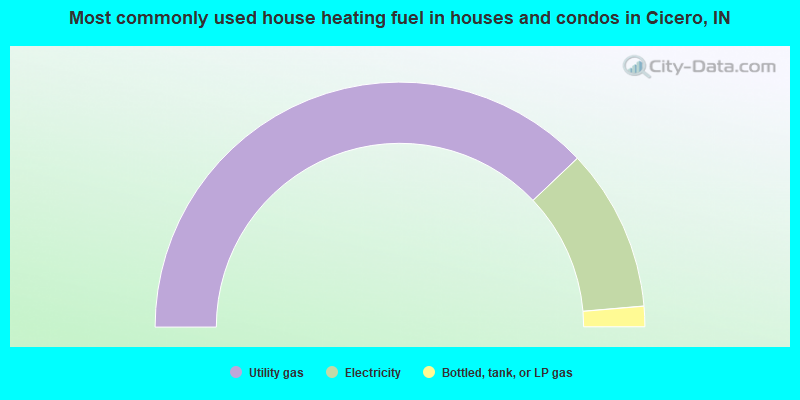
- 75.8%Utility gas
- 21.5%Electricity
- 2.7%Bottled, tank, or LP gas
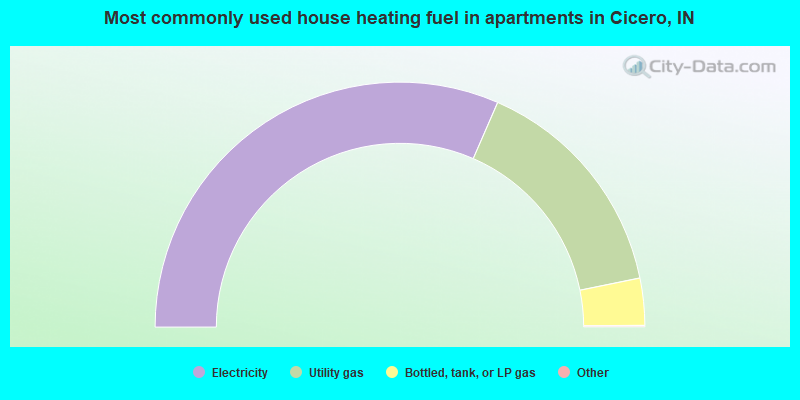
- 63.2%Electricity
- 30.6%Utility gas
- 6.2%Bottled, tank, or LP gas
Private vs. public school enrollment:
| Here: | 17.5% |
| Indiana: | 14.9% |
| Here: | 18.7% |
| Indiana: | 11.4% |
| Here: | 56.5% |
| Indiana: | 22.3% |


