Chula Vista, CA (California) Houses and Residents
| Chula Vista: | $767,500 |
| California: | $715,900 |
Mean price in 2022:
Detached houses: $774,524
Here: $774,524 State: $988,808 Townhouses or other attached units: $552,250
Here: $552,250 State: $838,546 In 2-unit structures: $451,316
Here: $451,316 State: $1,138,100 In 3-to-4-unit structures: $440,396
Here: $440,396 State: $824,253 In 5-or-more-unit structures: $432,668
Here: $432,668 State: $730,996 Mobile homes: $96,729
Here: $96,729 State: $184,506
Total population: 260,988 (Urban population: 172,267, Rural population: 1,593 (all nonfarm))
Houses: 89,711 (85,487 occupied: 49,733 owner occupied, 35,754 renter occupied)
| % of renters here: | 42% |
| State: | 44% |
Housing density: 1,835 houses/condos per square mile
Median price asked for vacant for-sale houses and condos in 2022: $783,453.
Median contract rent in 2022: $1,879 (lower quartile is $1,418, upper quartile is over $2,000)
Median rent asked for vacant for-rent units in 2022: $1,137
Median gross rent in Chula Vista, CA in 2022: over $2,000
Housing units in Chula Vista with a mortgage: 37,784 (4,419 second mortgage, 440 home equity loan, 3,433 both second mortgage and home equity loan)
Houses without a mortgage: 231
Median household income for houses/condos with a mortgage: $139,469
Median household income for apartments without a mortgage: $95,561
Median monthly housing costs: $2,248
Compare current foreclosures in Chula Vista, CA:
| Photo | Address | Area | Beds / Baths | Price | Details |
|---|---|---|---|---|---|

|
#1
Otay Valley Rd Unit A
Chula Vista, CA 91911
|
1,212 sq. feet
|
2 baths 3 beds |
show details | |

|
#2
Tremont St
Chula Vista, CA 91911
|
912 sq. feet
|
2 baths 3 beds |
show details | |

|
#3
N Paradise Ridge Way
Chula Vista, CA 91915
|
3,258 sq. feet
|
3 baths 3 beds |
show details | |

|
#4
Myra Ct
Chula Vista, CA 91911
|
1,314 sq. feet
|
2 baths 3 beds |
show details | |

|
#5
Carver St
Chula Vista, CA 91911
|
1,475 sq. feet
|
3 baths 4 beds |
show details | |

|
#6
Tamayo Dr Apt 1
Chula Vista, CA 91910
|
1,006 sq. feet
|
2 baths 2 beds |
show details | |

|
#7
E Rienstra St
Chula Vista, CA 91911
|
1,350 sq. feet
|
1 baths 3 beds |
show details | |

|
#8
Arthur Ave
Chula Vista, CA 91910
|
- sq. feet
|
1 baths 3 beds |
show details | |

|
#9
Via Sinuoso
Chula Vista, CA 91910
|
2,871 sq. feet
|
3 baths 4 beds |
show details | |

|
#10
Magdalena Ave
Chula Vista, CA 91913
|
2,466 sq. feet
|
2 baths 4 beds |
show details |
| Photo | Address | Area | Beds / Baths | Price | Details |
|---|---|---|---|---|---|

|
#11
Kent St
Chula Vista, CA 91913
|
2,035 sq. feet
|
2 baths 3 beds |
show details | |

|
#12
Josselyn Ave
Chula Vista, CA 91911
|
1,042 sq. feet
|
1 baths 3 beds |
show details | |

|
#13
Caminito Siena
Chula Vista, CA 91911
|
1,705 sq. feet
|
2 baths 4 beds |
show details | |

|
#14
Via La Paloma
Chula Vista, CA 91910
|
1,888 sq. feet
|
3 baths 4 beds |
show details | |

|
#15
N 2nd Ave Unit 27
Chula Vista, CA 91910
|
1,003 sq. feet
|
2 baths 2 beds |
show details | |

|
#16
Robert Ave
Chula Vista, CA 91910
|
1,016 sq. feet
|
1 baths 3 beds |
show details | |

|
#17
I St
Chula Vista, CA 91910
|
3,446 sq. feet
|
3 baths 5 beds |
show details | |

|
#18
Camellia Ct
Chula Vista, CA 91911
|
2,070 sq. feet
|
2 baths 5 beds |
show details | |

|
#19
Amador St
Chula Vista, CA 91913
|
2,102 sq. feet
|
3 baths 5 beds |
show details | |

|
#20
Mount Dana Dr
Chula Vista, CA 91913
|
2,950 sq. feet
|
3 baths 5 beds |
show details |
| Photo | Address | Area | Beds / Baths | Price | Details |
|---|---|---|---|---|---|

|
#21
Melrose Ave
Chula Vista, CA 91911
|
1,040 sq. feet
|
2 baths 3 beds |
show details | |

|
#22
Amador St, O Ernesto Monzon
Chula Vista, CA 91913
|
2,102 sq. feet
|
3 baths 5 beds |
show details | |

|
#23
Carlos Canyon Dr
Chula Vista, CA 91910
|
5,109 sq. feet
|
3 baths 4 beds |
show details | |

|
#24
Camino Del Sol
Chula Vista, CA 91910
|
2,017 sq. feet
|
3 baths 3 beds |
show details | |

|
#25
Red Granite Rd
Chula Vista, CA 91913
|
3,745 sq. feet
|
4 baths 5 beds |
show details | |

|
#26
Broadway Unit 16
Chula Vista, CA 91910
|
1,584 sq. feet
|
3 baths 3 beds |
show details | |

|
#27
Carla Ave
Chula Vista, CA 91910
|
1,062 sq. feet
|
1 baths 2 beds |
show details | |

|
#28
Hilltop Dr Unit 103
Chula Vista, CA 91911
|
1,004 sq. feet
|
2 baths 2 beds |
show details | |

|
#29
Morgan Hill Dr
Chula Vista, CA 91913
|
2,631 sq. feet
|
3 baths 5 beds |
show details | |

|
#30
1st Ave
Chula Vista, CA 91911
|
1,354 sq. feet
|
2 baths 3 beds |
show details |
| Photo | Address | Area | Beds / Baths | Price | Details |
|---|---|---|---|---|---|

|
#31
Camino La Paz
Chula Vista, CA 91910
|
2,137 sq. feet
|
2 baths 4 beds |
show details | |

|
#32
David Dr
Chula Vista, CA 91910
|
1,417 sq. feet
|
2 baths 3 beds |
show details | |

|
#33
Elm Ave
Chula Vista, CA 91910
|
2,183 sq. feet
|
2 baths 4 beds |
show details | |

|
#34
Tree Song 170
Chula Vista, CA 91915
|
2,375 sq. feet
|
3 baths 4 beds |
show details | |

|
#35
Rue Bienville Pl Unit 834
Chula Vista, CA 91913
|
959 sq. feet
|
2 baths 2 beds |
show details | |

|
#36
Sherwood St
Chula Vista, CA 91911
|
1,083 sq. feet
|
2 baths 3 beds |
show details | |

|
#37
Old Janal Ranch Rd
Chula Vista, CA 91915
|
2,565 sq. feet
|
2 baths 4 beds |
show details | |

|
#38
Claret Cup Dr Unit 1
Chula Vista, CA 91915
|
1,581 sq. feet
|
3 baths 3 beds |
show details | |

|
#39
Rambling Vista Rd
Chula Vista, CA 91915
|
3,096 sq. feet
|
4 baths 4 beds |
show details | |

|
#40
E Emerson St
Chula Vista, CA 91911
|
1,448 sq. feet
|
2 baths 3 beds |
show details |
| Photo | Address | Area | Beds / Baths | Price | Details |
|---|---|---|---|---|---|

|
#41
Saint Helena Ave
Chula Vista, CA 91913
|
1,708 sq. feet
|
2 baths 3 beds |
show details | |

|
#42
Meeks Bay Dr
Chula Vista, CA 91913
|
2,464 sq. feet
|
3 baths 4 beds |
show details | |

|
#43
Journey St
Chula Vista, CA 91915
|
3,046 sq. feet
|
3 baths 4 beds |
show details | |

|
#44
Otay Lakes Rd Spc 134
Chula Vista, CA 91913
|
780 sq. feet
|
2 baths 2 beds |
show details | |

|
#45
Windjammer Cir
Chula Vista, CA 91910
|
1,184 sq. feet
|
2 baths 2 beds |
show details | |

|
#46
Waterville Lake Rd
Chula Vista, CA 91915
|
2,808 sq. feet
|
2 baths 4 beds |
show details | |

|
#47
Neptune Dr
Chula Vista, CA 91911
|
1,882 sq. feet
|
2 baths 4 beds |
show details | |

|
#48
Corte Castillo
Chula Vista, CA 91914
|
2,616 sq. feet
|
3 baths 3 beds |
show details | |

|
#49
Castaic Ct
Chula Vista, CA 91913
|
2,407 sq. feet
|
2 baths 4 beds |
show details | |

|
Check over 1 million property listings on Foreclosure.com!
|
browse all offers | |||


 | Homes in Otay Ranch, Chula Vista vs. rest of San Diego (13 replies) |
| Nice Condos/Townhomes (15 replies) |
| East/West Chula Vista for buying a house? (12 replies) |
| CA Cities(Pop 65,000+) by Median Household Income, 2019 (8 replies) |
| Downtown Luxury Apartments / Which Ones To Avoid..Which Ones To Look At ? (19 replies) |
| GET REAL About San Diego Rental and Real Estate Prices (751 replies) |

Median year apartment built: 1983
Household type by relationship:
Households: 279,158- Male householders: 42,098 (5,964 living alone), Female householders: 43,389 (7,230 living alone)
46,223 spouses (45,837 opposite-sex spouses), 5,978 unmarried partners, (5,513 opposite-sex unmarried partners), 98,281 children (92,669 natural, 1,260 adopted, 4,352 stepchildren), 6,508 grandchildren, 5,999 brothers or sisters, 9,323 parents, 285 foster children, 11,210 other relatives, 8,128 non-relatives
- In group quarters: 1,736
Size of family households: 18,332 2-persons, 16,918 3-persons, 14,928 4-persons, 9,797 5-persons, 4,364 6-persons, 2,870 7-or-more-persons.
Size of nonfamily households: 13,194 1-person, 4,345 2-persons, 641 3-persons, 98 4-persons.
45,925 married couples with children.
15,533 single-parent households (4,445 men, 11,088 women).
43.3% of residents of Chula Vista speak English at home.
48.1% of residents speak Spanish at home (67% speak English very well, 16% speak English well, 12% speak English not well, 4% don't speak English at all).
0.9% of residents speak other Indo-European language at home (82% speak English very well, 12% speak English well, 6% speak English not well).
7.0% of residents speak Asian or Pacific Island language at home (68% speak English very well, 23% speak English well, 7% speak English not well, 1% don't speak English at all).
0.7% of residents speak other language at home (95% speak English very well, 5% speak English well).
Foreign born population: 76,997 (27.6%)
(67.6% of them are naturalized citizens)
| Here: | 6.1 |
| State: | 6.0 |
| Here: | 3.9 |
| State: | 3.9 |

- Bedrooms in owner-occupied houses and condos in Chula Vista, California
- 477no bedroom
- 7971 bedroom
- 5,6522 bedrooms
- 19,6093 bedrooms
- 16,5844 bedrooms
- 6,6145+ bedrooms

- Bedrooms in renter-occupied apartments in Chula Vista, California
- 1,621no bedroom
- 8,1741 bedroom
- 15,7382 bedrooms
- 7,2523 bedrooms
- 2,4774 bedrooms
- 4925+ bedrooms

- Cars and other vehicles available in Chula Vista in owner-occupied houses/condos
- 708no vehicle
- 8,6201 vehicle
- 21,2302 vehicles
- 10,8273 vehicles
- 4,7554 vehicles
- 3,5935+ vehicles

- Cars and other vehicles available in Chula Vista in renter-occupied apartments
- 2,721no vehicle
- 13,1341 vehicle
- 14,5672 vehicles
- 4,0183 vehicles
- 1,0184 vehicles
- 2965+ vehicles

- Rooms in owner-occupied houses in Chula Vista, California
- 4771 room
- 3232 rooms
- 1,6953 rooms
- 5,3554 rooms
- 9,7295 rooms
- 11,3406 rooms
- 7,8917 rooms
- 6,4068 rooms
- 6,5179+ rooms

- Rooms in renter-occupied apartments in Chula Vista, California
- 1,5931 room
- 3,9482 rooms
- 6,7133 rooms
- 12,9354 rooms
- 4,9045 rooms
- 2,8926 rooms
- 1,6427 rooms
- 8318 rooms
- 2969+ rooms


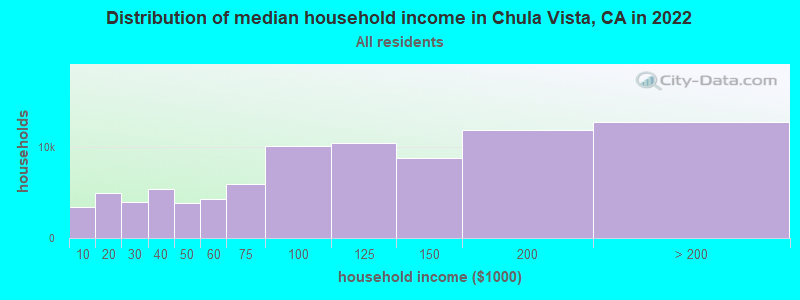
Chula Vista, CA household income distribution

- 3,374Less than $10,000
- 4,941$10,000 to $19,999
- 3,987$20,000 to $29,999
- 5,405$30,000 to $39,999
- 3,840$40,000 to $49,999
- 4,237$50,000 to $59,999
- 5,881$60,000 to $74,999
- 10,050$75,000 to $99,999
- 10,436$100,000 to $124,999
- 8,802$125,000 to $149,999
- 11,825$150,000 to $199,999
- 12,709$200,000 or more
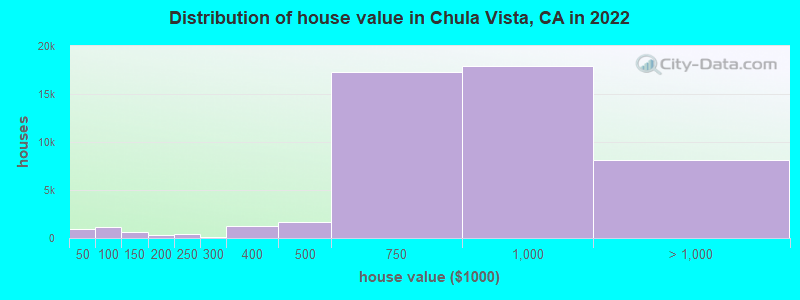
Home value of owner - occupied houses in 2022 in Chula Vista, CA
-
- 264Less than $10,000
- 206$10,000 to $14,999
- 120$15,000 to $19,999
- 48$20,000 to $24,999
- 118$30,000 to $34,999
- 58$35,000 to $39,999
- 163$40,000 to $49,999
- 339$50,000 to $59,999
- 100$60,000 to $69,999
- 156$70,000 to $79,999
- 245$80,000 to $89,999
- 169$90,000 to $99,999
- 546$100,000 to $124,999
- 92$125,000 to $149,999
- 234$150,000 to $174,999
- 85$175,000 to $199,999
- 382$200,000 to $249,999
- 93$250,000 to $299,999
- 1,241$300,000 to $399,999
- 1,654$400,000 to $499,999
- 17,293$500,000 to $749,999
- 17,964$750,000 to $999,999
- 7,180$1,000,000 to $1,499,999
- 649$1,500,000 to $1,999,999
- 334$2,000,000 or more
Rent paid by renters in 2022 in Chula Vista, CA
-
- 321$150 to $199
- 181$200 to $249
- 63$250 to $299
- 86$300 to $349
- 248$350 to $399
- 76$450 to $499
- 339$500 to $549
- 123$550 to $599
- 232$600 to $649
- 163$650 to $699
- 321$750 to $799
- 337$800 to $899
- 311$900 to $999
- 2,984$1,000 to $1,249
- 4,532$1,250 to $1,499
- 9,656$1,500 to $1,999
- 7,253$2,000 to $2,499
- 5,878$2,500 to $2,999
- 1,072$3,000 to $3,499
- 1,114$3,500 or more
- 464No cash rent


Percentage of workers working in this county: 98.1%
Number of people working at home: 17,376 (13.0% of all workers)
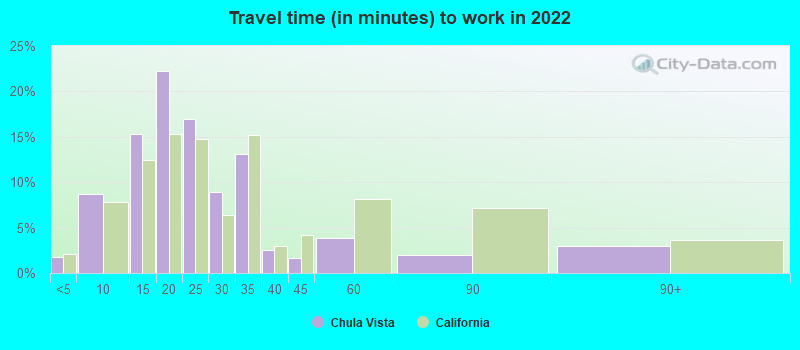
Travel time to work (commute)
- Less than 5 minutes: 1,391
- 5 to 9 minutes: 6,437
- 10 to 14 minutes: 10,399
- 15 to 19 minutes: 17,140
- 20 to 24 minutes: 18,183
- 25 to 29 minutes: 11,146
- 30 to 34 minutes: 18,818
- 35 to 39 minutes: 5,271
- 40 to 44 minutes: 3,815
- 45 to 59 minutes: 12,338
- 60 to 89 minutes: 7,406
- 90 or more minutes: 4,392
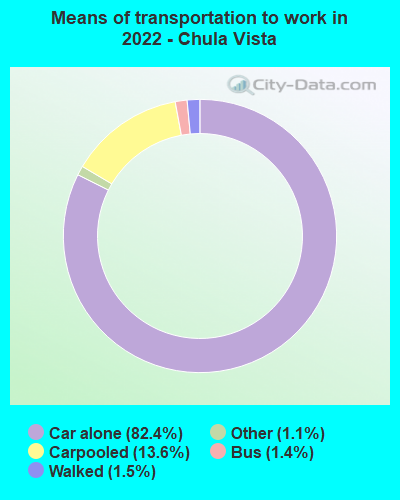
Means of transportation to work:
- Drove a car alone: 47,986 (63.5%)
- Carpooled: 7,922 (10.5%)
- Bus: 795 (1.1%)
- Light rail, streetcar or trolley: 39 (0.1%)
- Taxi: 643 (0.9%)
- Walked: 847 (1.1%)
- Worked at home: 17,376 (23.0%)

- Unemployment by race in 2022
- Unemployment rate for White non-Hispanic residents
- 5.0%Males
- 5.4%Females
- Unemployment rate for Black residents
- 2.1%Males
- 14.0%Females
- Unemployment rate for American Indian and Alaska Native residents
- 0.7%Males
- 1.7%Females
- Unemployment rate for Asian residents
- 1.8%Males
- 1.0%Females
- Unemployment rate for other race residents
- 9.1%Males
- 3.7%Females
- Unemployment rate for two or more race residents
- 7.4%Males
- 15.2%Females
- Unemployment rate for Hispanic or Latino residents
- 7.8%Males
- 9.1%Females

- Year of entry for the foreign-born population in Chula Vista, California
- 15,3832010 or later
- 16,8442000 to 2009
- 14,1361990 to 1999
- 14,4731980 to 1989
- 10,8421970 to 1979
- 10,983Before 1970

First ancestries reported:
- American: 2,910 (1.6%)
- German: 2,388 (1.3%)
- English: 2,385 (1.3%)
- Irish: 2,021 (1.1%)
- Italian: 1,510 (0.8%)
- European: 1,150 (0.6%)
- Jamaican: 1,043 (0.6%)
- African: 616 (0.3%)
- French: 564 (0.3%)
- Polish: 554 (0.3%)
- Eastern European: 502 (0.3%)
- Russian: 381 (0.2%)
- Swedish: 379 (0.2%)
- Scottish: 278 (0.2%)
- Dutch: 274 (0.2%)
- Norwegian: 272 (0.1%)
- Iranian: 267 (0.1%)
- Portuguese: 237 (0.1%)
- Lebanese: 228 (0.1%)
- British: 213 (0.1%)
- Egyptian: 209 (0.1%)
- Greek: 184 (0.1%)
- Scotch-Irish: 178 (0.10%)
- Ghanaian: 154 (0.08%)
- Brazilian: 153 (0.08%)
- Palestinian: 135 (0.07%)
- Nigerian: 131 (0.07%)
- Scandinavian: 125 (0.07%)
- Ukrainian: 125 (0.07%)
- French Canadian: 116 (0.06%)
- Welsh: 79 (0.04%)
- Canadian: 75 (0.04%)
- Kenyan: 74 (0.04%)
- Northern European: 63 (0.03%)
- Haitian: 53 (0.03%)
- Danish: 51 (0.03%)
- Arab: 48 (0.03%)
- Swiss: 47 (0.03%)
- Jordanian: 45 (0.02%)
- Finnish: 45 (0.02%)
- Romanian: 41 (0.02%)
- Afghan: 28 (0.02%)
- Austrian: 24 (0.01%)
- Croatian: 24 (0.01%)
- Ethiopian: 23 (0.01%)
- Serbian: 22 (0.01%)
- Czechoslovakian: 18 (0.01%)
- Turkish: 17 (0.01%)
- German Russian: 16 (0.01%)
- Syrian: 15 (0.01%)
- Lithuanian: 10 (0.01%)
- Basque: 10 (0.01%)
- Assyrian: 10 (0.01%)
Most common places of birth for foreign-born residents (%):
| Chula Vista: | 60.3% (48,065) |
| California: | 37.2% (3,881,193) |
| Chula Vista: | 20.7% (16,520) |
| California: | 7.8% (818,297) |
| Chula Vista: | 1.7% (1,320) |
| California: | 3.0% (315,248) |
Place of birth for U.S.-born residents:
- This state: 157,627
- Other state: 36,621
- Northeast: 7,452
- Midwest: 6,406
- South: 14,579
- West: 8,184
90.2% of Chula Vista residents lived in the same house 1 years ago.
Out of people who lived in different houses, 47.2% lived in this county.
Out of people who lived in different counties, 66.8% lived in California.
| Chula Vista: | 90.2% |
| State average: | 88.9% |
Education attainment for males 25 years and older:
- No schooling: 2,212
- Nursery to 4th grade: 507
- 5th and 6th grade: 1,016
- 7th and 8th grade: 1,217
- 9th grade: 781
- 10th grade: 386
- 11th grade: 1,361
- 12th grade, no diploma: 2,800
- High school graduate (or equivalency): 19,556
- Less than 1 year of college: 5,746
- Some college more than 1 year, no degree: 15,499
- Associate degree: 7,044
- Bachelor's degree: 19,337
- Master's degree: 6,573
- Professional school degree: 2,051
- Doctorate degree: 1,242

Education attainment for females 25 years and older:
- No schooling: 3,388
- Nursery to 4th grade: 1,189
- 5th and 6th grade: 2,747
- 7th and 8th grade: 870
- 9th grade: 1,328
- 10th grade: 411
- 11th grade: 978
- 12th grade, no diploma: 2,076
- High school graduate (or equivalency): 18,957
- Less than 1 year of college: 6,048
- Some college more than 1 year, no degree: 14,858
- Associate degree: 7,593
- Bachelor's degree: 21,207
- Master's degree: 8,802
- Professional school degree: 1,424
- Doctorate degree: 869


Housing units in structures:
- One, detached: 48,106
- One, attached: 9,365
- Two: 1,139
- 3 or 4: 5,840
- 5 to 9: 5,376
- 10 to 19: 5,013
- 20 to 49: 4,642
- 50 or more: 7,093
- Mobile homes: 3,089
- Boats, RVs, vans, etc.: 48
Median worth of mobile homes: $92,400
Housing units lacking complete kitchen facilities in 2022: 1.1%
House/condo owner moved in on average 11 years ago
Renter moved in on average 4 years ago

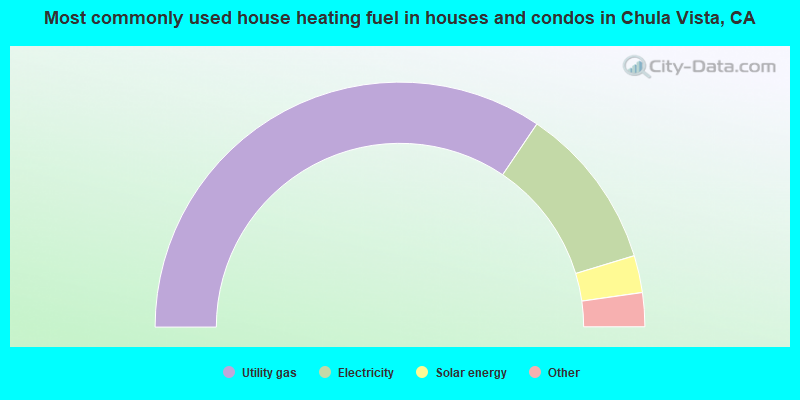
- 68.9%Utility gas
- 21.7%Electricity
- 4.9%Solar energy
- 2.8%No fuel used
- 1.3%Bottled, tank, or LP gas
- 0.2%Wood
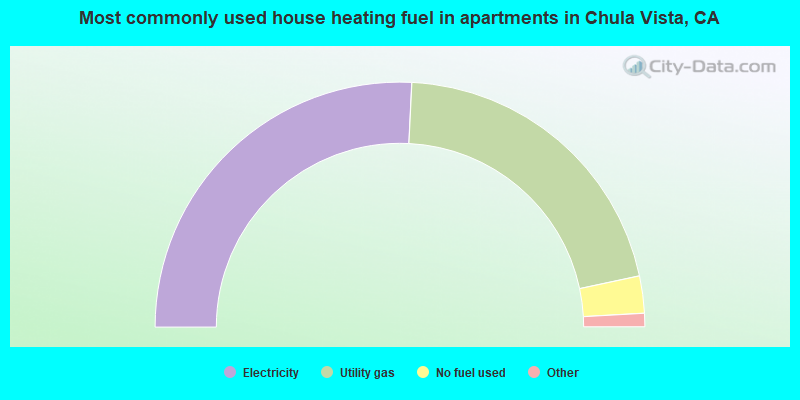
- 51.6%Electricity
- 41.8%Utility gas
- 4.9%No fuel used
- 1.2%Bottled, tank, or LP gas
- 0.5%Wood
- 0.1%Solar energy
Private vs. public school enrollment:
| Here: | 7.6% |
| California: | 10.5% |
| Here: | 5.2% |
| California: | 8.5% |
| Here: | 20.2% |
| California: | 15.9% |


