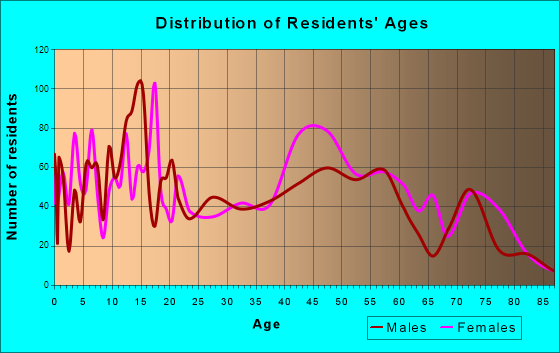
Chino Valley, AZ (Arizona) Houses and Residents
Estimated median house or condo value in 2022: $395,806 (it was $95,600 in 2000 )
Chino Valley:
$395,806Arizona:
$402,800
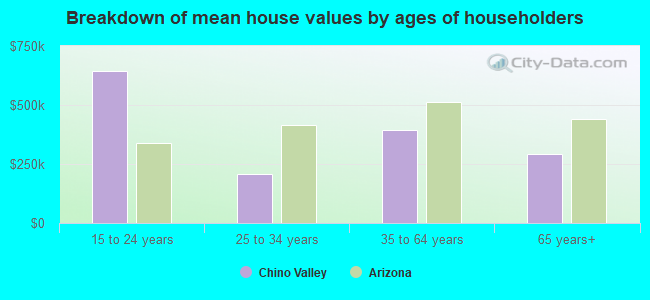
Lower value quartile - upper value quartile: $273,060 - $565,118Mean price in 2022: Detached houses: $487,011 Here:
$487,011State:
$521,408
Townhouses or other attached units: $1,319,686 Here:
$1,319,686State:
$387,465
Mobile homes: $248,877 Here:
$248,877State:
$141,516
Occupied boats, RVs, vans, etc.: $6,476 Total population: 11,019 (Urban population: 4,986 (all inside urban clusters), Rural population: 3,023 (101 farm, 2,922 nonfarm ))
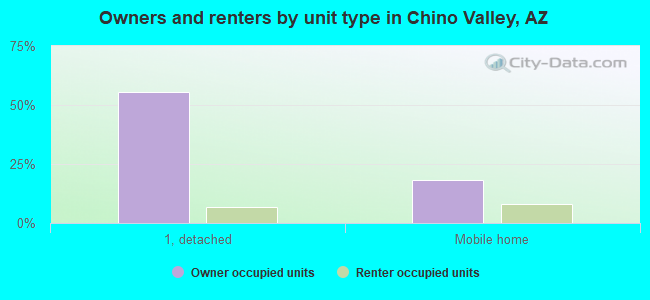
Houses: 6,262 (5,830 occupied: 4,428 owner occupied, 1,427 renter occupied )
% of renters here:
24%State:
33%
Housing density: 337 houses/condos per square mile
Median price asked for vacant for-sale houses and condos in 2022: $3,082,442.
Median contract rent in 2022: $876 (lower quartile is $605, upper quartile is $1,130)
Median rent asked for vacant for-rent units in 2022: $1,107
Median gross rent in Chino Valley, AZ in 2022: $1,137
Housing units in Chino Valley with a mortgage: 2,459 (109 second mortgage, 51 home equity loan, 66 both second mortgage and home equity loan )Houses without a mortgage: 46
Median household income for houses/condos with a mortgage: $76,637
Median household income for apartments without a mortgage: $45,797
Median monthly housing costs: $962
Data:
Median house or condo value ($)
Median house or condo value ($ change since 2000)
Median house or condo value ($) - White
Median house or condo value ($) - Black or African American
Median house or condo value ($) - Asian
Median house or condo value ($) - Hispanic or Latino
Median house or condo value ($) - American Indian and Alaska Native
Median house or condo value ($) - Multirace
Median house or condo value ($) - Other Race
Median price asked for mobile homes ($)
Household density (households per square mile)
Mean house or condo value by units in structure - 1, detached ($)
Mean house or condo value by units in structure - 1, attached ($)
Mean house or condo value by units in structure - 2 ($)
Mean house or condo value by units in structure by units in structure - 3 or 4 ($)
Mean house or condo value by units in structure - 5 or more ($)
Mean house or condo value by units in structure - Boat, RV, van, etc. ($)
Mean house or condo value by units in structure - Mobile home ($)
Median contract rent ($)
Median contract rent - Lower quartile ($)
Median contract rent - Upper quartile ($)
Median gross rent ($)
Urban houses (%)
Rural houses (%)
Houses occupied (%)
Houses occupied (% change since 2000)
Houses owner occupied (%)
Houses owner occupied (% change since 2000)
Houses renter occupied (%)
Houses renter occupied (% change since 2000)
Vacant housing units - For rent (%)
Vacant housing units - For rent (% change since 2000)
Vacant housing units - For sale only (%)
Vacant housing units - For sale only (% change since 2000)
Vacant housing units - Rented or sold, not occupied (%)
Vacant housing units - Rented or sold, not occupied (% change since 2000)
Vacant housing units - For seasonal, recreational, or occasional use (%)
Vacant housing units - For seasonal, recreational, or occasional use (% change since 2000)
Vacant housing units - For migrant workers (%)
Vacant housing units - For migrant workers (% change since 2000)
Vacant housing units - Other vacant (%)
Vacant housing units - Other vacant (% change since 2000)
Median monthly housing costs ($)
Median household income for houses/condos with a mortgage ($)
Median household income for houses/condos without a mortgage ($)
Median household income ($)
Median household income ($) - White
Median household income ($) - Black or African American
Median household income ($) - Asian
Median household income ($) - Hispanic or Latino
Median household income ($) - American Indian and Alaska Native
Median household income ($) - Multirace
Median household income ($) - Other Race
Mortgage status - with mortgage (%)
Mortgage status - with second mortgage (%)
Mortgage status - with home equity loan (%)
Mortgage status - with both second mortgage and home equity loan (%)
Mortgage status - without a mortgage (%)
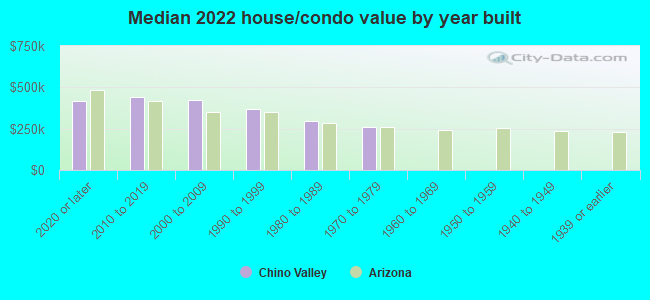
Median year house/condo built
Median year apartment built
Household type by relationship - Male householder living alone (%)
Household type by relationship - Male householder not living alone (%)
Household type by relationship - Female householder living alone (%)
Household type by relationship - Female householder not living alone (%)
Household type by relationship - Opposite-Sex spouse (%)
Household type by relationship - Same-Sex spouse (%)
Household type by relationship - Opposite-Sex unmarried partner (%)
Household type by relationship - Same-Sex unmarried partner (%)
Household type by relationship - In group quarters (%)
Size of family households - 2-person household (%)
Size of family households - 3-person household (%)
Size of family households - 4-person household (%)
Size of family households - 5-person household (%)
Size of family households - 6-person household (%)
Size of family households - 7-or-more-person household (%)
Size of nonfamily households - 1-person household (%)
Size of nonfamily households - 2-person household (%)
Size of nonfamily households - 3-person household (%)
Size of nonfamily households - 4-person household (%)
Size of nonfamily households - 5-person household (%)
Size of nonfamily households - 6-person household (%)
Size of nonfamily households - 7-or-moreperson household (%)
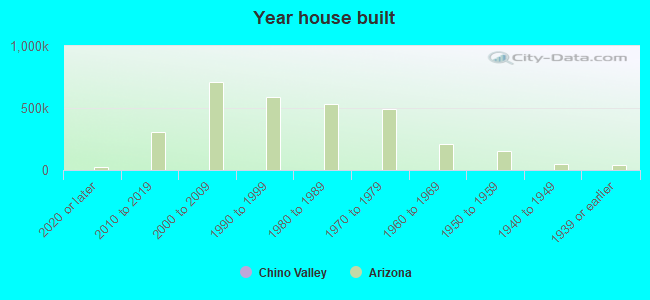
Year house built - Built 2010 or later (%)
Year house built - Built 2000 to 2009 (%)
Year house built - Built 1990 to 1999 (%)
Year house built - Built 1980 to 1989 (%)
Year house built - Built 1970 to 1979 (%)
Year house built - Built 1960 to 1969 (%)
Year house built - Built 1950 to 1959 (%)
Year house built - Built 1940 to 1949 (%)
Year house built - Built 1939 or earlier (%)
Median number of rooms in houses and condos
Median number of rooms in apartments
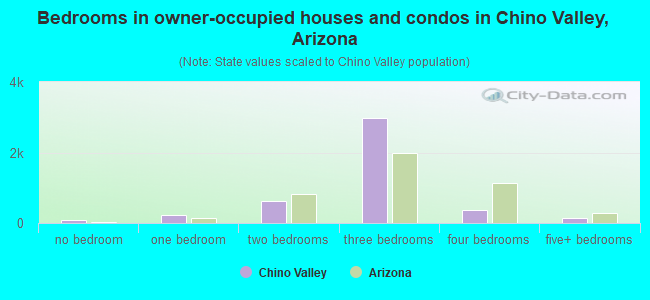
Median number of bedrooms in owner occupied houses
Mean number of bedrooms in owner occupied houses
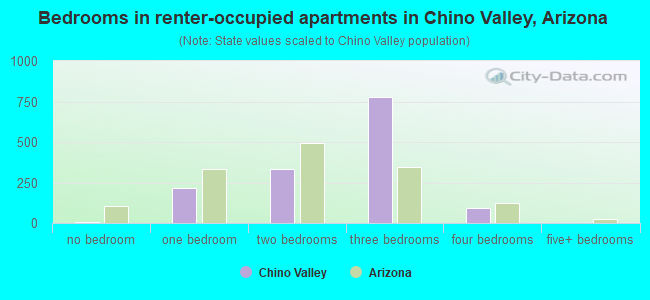
Median number of bedrooms in renter occupied houses
Mean number of bedrooms in renter occupied houses
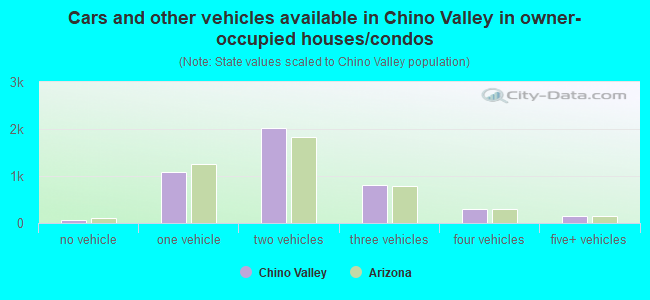
Median number of vehichles in owner occupied houses
Mean number of vehichles in owner occupied houses
Median number of vehichles in renter occupied houses
Mean number of vehichles in renter occupied houses
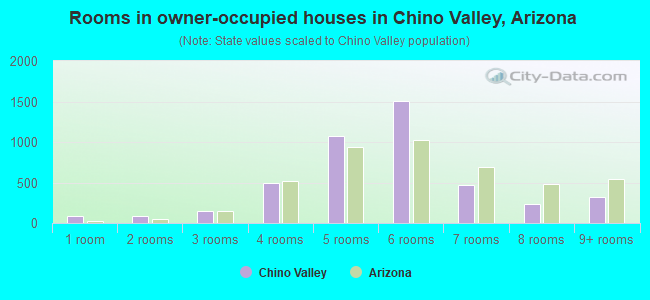
Rooms in owner-occupied houses - 1 room (%)
Rooms in owner-occupied houses - 2 rooms (%)
Rooms in owner-occupied houses - 3 rooms (%)
Rooms in owner-occupied houses - 4 rooms (%)
Rooms in owner-occupied houses - 5 rooms (%)
Rooms in owner-occupied houses - 6 rooms (%)
Rooms in owner-occupied houses - 7 rooms (%)
Rooms in owner-occupied houses - 8 rooms (%)
Rooms in owner-occupied houses - 9+ rooms (%)
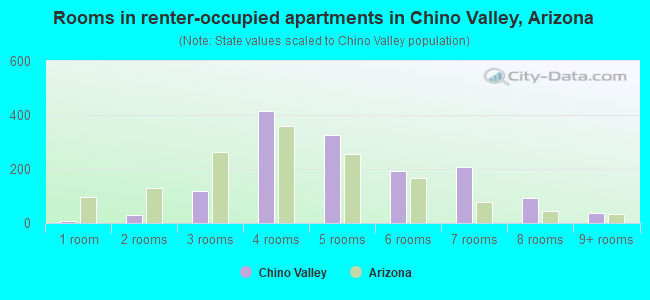
Rooms in renter-occupied houses - 1 room (%)
Rooms in renter-occupied houses - 2 rooms (%)
Rooms in renter-occupied houses - 3 rooms (%)
Rooms in renter-occupied houses - 4 rooms (%)
Rooms in renter-occupied houses - 5 rooms (%)
Rooms in renter-occupied houses - 6 rooms (%)
Rooms in renter-occupied houses - 7 rooms (%)
Rooms in renter-occupied houses - 8 rooms (%)
Rooms in renter-occupied houses - 9+ rooms (%)
Bedrooms in owner-occupied houses - no bedrooms (%)
Bedrooms in owner-occupied houses - 1 bedroom (%)
Bedrooms in owner-occupied houses - 2 bedrooms (%)
Bedrooms in owner-occupied houses - 3 bedrooms (%)
Bedrooms in owner-occupied houses - 4 bedrooms (%)
Bedrooms in owner-occupied houses - 5+ bedrooms (%)
Bedrooms in renter-occupied houses - no bedrooms (%)
Bedrooms in renter-occupied houses - 1 bedroom (%)
Bedrooms in renter-occupied houses - 2 bedrooms (%)
Bedrooms in renter-occupied houses - 3 bedrooms (%)
Bedrooms in renter-occupied houses - 4 bedrooms (%)
Bedrooms in renter-occupied houses - 5+ bedrooms (%)
Vehicles available in owner-occupied houses - no vehicle available (%)
Vehicles available in owner-occupied houses - 1 vehicle available(%)
Vehicles available in owner-occupied houses - 2 Vehicles available (%)
Vehicles available in owner-occupied houses - 3 Vehicles available (%)
Vehicles available in owner-occupied houses - 4 Vehicles available (%)
Vehicles available in owner-occupied houses - 5+ Vehicles available (%)
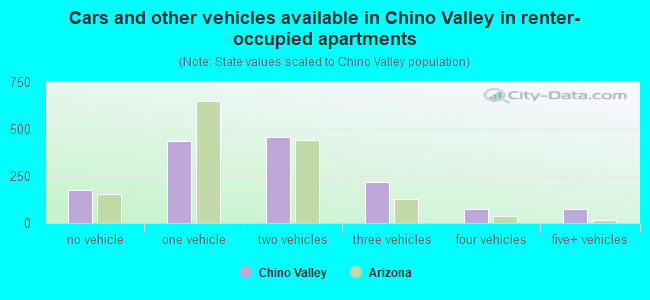
Vehicles available in renter-occupied houses - no vehicle available (%)
Vehicles available in renter-occupied houses - 1 vehicle available (%)
Vehicles available in renter-occupied houses - 2 Vehicles available (%)
Vehicles available in renter-occupied houses - 3 Vehicles available (%)
Vehicles available in renter-occupied houses - 4 Vehicles available (%)
Vehicles available in renter-occupied houses - 5+ Vehicles available (%)
Housing units in structures - 1, detached (%)
Housing units in structures - 1, attached (%)
Housing units in structures - 2 (%)
Housing units in structures - 3 or 4 (%)
Housing units in structures - 5 to 9 (%)
Housing units in structures - 10 to 19 (%)
Housing units in structures - 20 to 49 (%)
Housing units in structures - 50 or more (%)
Housing units in structures - Mobile home (%)
Housing units in structures - Boat, RV, van, etc. (%)
Housing units in structures - Owners - 1, detached (%)
Housing units in structures - Owners - 1, attached (%)
Housing units in structures - Owners - 2 (%)
Housing units in structures - Owners - 3 or 4 (%)
Housing units in structures - Owners - 5 to 9 (%)
Housing units in structures - Owners - 10 to 19 (%)
Housing units in structures - Owners - 20 to 49 (%)
Housing units in structures - Owners - 50 or more (%)
Housing units in structures - Owners - Mobile home (%)
Housing units in structures - Owners - Boat, RV, van, etc. (%)
Housing units in structures - Renters - 1, detached (%)
Housing units in structures - Renters - 1, attached (%)
Housing units in structures - Renters - 2 (%)
Housing units in structures - Renters - 3 or 4 (%)
Housing units in structures - Renters - 5 to 9 (%)
Housing units in structures - Renters - 10 to 19 (%)
Housing units in structures - Renters - 20 to 49 (%)
Housing units in structures - Renters - 50 or more (%)
Housing units in structures - Renters - Mobile home (%)
Housing units in structures - Renters - Boat, RV, van, etc. (%)
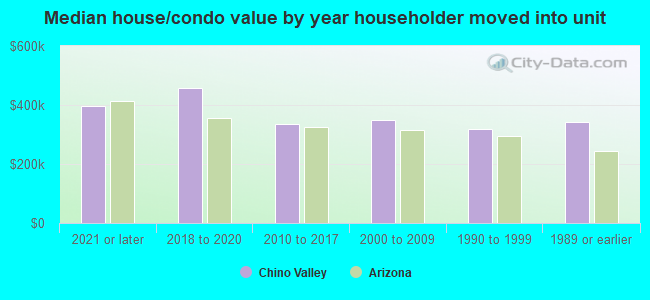
House/condo owner moved in on average (years ago)
Renter moved in on average (years ago)
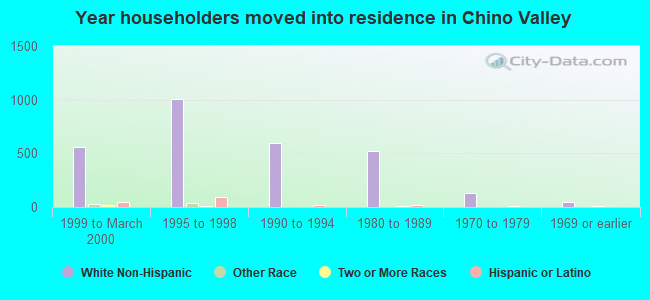
Year householder moved into unit - Moved in 1999 to March 2000 (%)
Year householder moved into unit - Moved in 1999 to March 2000 (%) - White
Year householder moved into unit - Moved in 1999 to March 2000 (%) - Black or African American
Year householder moved into unit - Moved in 1999 to March 2000 (%) - Asian
Year householder moved into unit - Moved in 1999 to March 2000 (%) - Hispanic or Latino
Year householder moved into unit - Moved in 1999 to March 2000 (%) - American Indian and Alaska Native
Year householder moved into unit - Moved in 1999 to March 2000 (%) - Multirace
Year householder moved into unit - Moved in 1999 to March 2000 (%) - Other Race
Year householder moved into unit - Moved in 1995 to 1998 (%)
Year householder moved into unit - Moved in 1995 to 1998 (%) - White
Year householder moved into unit - Moved in 1995 to 1998 (%) - Black or African American
Year householder moved into unit - Moved in 1995 to 1998 (%) - Asian
Year householder moved into unit - Moved in 1995 to 1998 (%) - Hispanic or Latino
Year householder moved into unit - Moved in 1995 to 1998 (%) - American Indian and Alaska Native
Year householder moved into unit - Moved in 1995 to 1998 (%) - Multirace
Year householder moved into unit - Moved in 1995 to 1998 (%) - Other Race
Year householder moved into unit - Moved in 1990 to 1994 (%)
Year householder moved into unit - Moved in 1990 to 1994 (%) - White
Year householder moved into unit - Moved in 1990 to 1994 (%) - Black or African American
Year householder moved into unit - Moved in 1990 to 1994 (%) - Asian
Year householder moved into unit - Moved in 1990 to 1994 (%) - Hispanic or Latino
Year householder moved into unit - Moved in 1990 to 1994 (%) - American Indian and Alaska Native
Year householder moved into unit - Moved in 1990 to 1994 (%) - Multirace
Year householder moved into unit - Moved in 1990 to 1994 (%) - Other Race
Year householder moved into unit - Moved in 1980 to 1989 (%)
Year householder moved into unit - Moved in 1980 to 1989 (%) - White
Year householder moved into unit - Moved in 1980 to 1989 (%) - Black or African American
Year householder moved into unit - Moved in 1980 to 1989 (%) - Asian
Year householder moved into unit - Moved in 1980 to 1989 (%) - Hispanic or Latino
Year householder moved into unit - Moved in 1980 to 1989 (%) - American Indian and Alaska Native
Year householder moved into unit - Moved in 1980 to 1989 (%) - Multirace
Year householder moved into unit - Moved in 1980 to 1989 (%) - Other Race
Year householder moved into unit - Moved in 1970 to 1979 (%)
Year householder moved into unit - Moved in 1970 to 1979 (%) - White
Year householder moved into unit - Moved in 1970 to 1979 (%) - Black or African American
Year householder moved into unit - Moved in 1970 to 1979 (%) - Asian
Year householder moved into unit - Moved in 1970 to 1979 (%) - Hispanic or Latino
Year householder moved into unit - Moved in 1970 to 1979 (%) - American Indian and Alaska Native
Year householder moved into unit - Moved in 1970 to 1979 (%) - Multirace
Year householder moved into unit - Moved in 1970 to 1979 (%) - Other Race
Year householder moved into unit - Moved in 1969 or earlier (%)
Year householder moved into unit - Moved in 1969 or earlier (%) - White
Year householder moved into unit - Moved in 1969 or earlier (%) - Black or African American
Year householder moved into unit - Moved in 1969 or earlier (%) - Asian
Year householder moved into unit - Moved in 1969 or earlier (%) - Hispanic or Latino
Year householder moved into unit - Moved in 1969 or earlier (%) - American Indian and Alaska Native
Year householder moved into unit - Moved in 1969 or earlier (%) - Multirace
Year householder moved into unit - Moved in 1969 or earlier (%) - Other Race
Housing units lacking complete plumbing facilities (%)
Housing units lacking complete kitchen facilities (%)
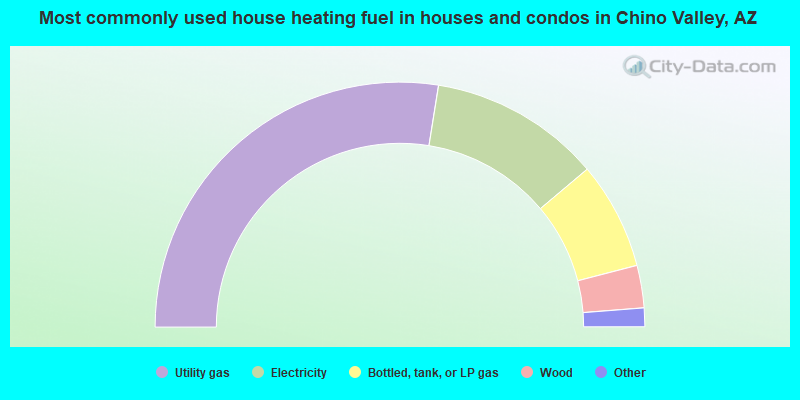
House heating fuel used in houses and condos - Utility gas (%)
House heating fuel used in houses and condos - Bottled, tank, or LP gas (%)
House heating fuel used in houses and condos - Electricity (%)
House heating fuel used in houses and condos - Fuel oil, kerosene, etc. (%)
House heating fuel used in houses and condos - Coal or coke (%)
House heating fuel used in houses and condos - Wood (%)
House heating fuel used in houses and condos - Solar energy (%)
House heating fuel used in houses and condos - Other fuel (%)
House heating fuel used in houses and condos - No fuel used (%)
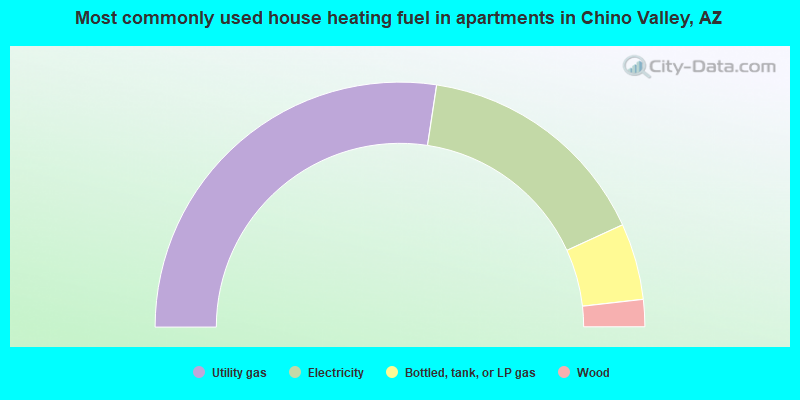
House heating fuel used in apartments - Utility gas (%)
House heating fuel used in apartments - Bottled, tank, or LP gas (%)
House heating fuel used in apartments - Electricity (%)
House heating fuel used in apartments - Fuel oil, kerosene, etc. (%)
House heating fuel used in apartments - Coal or coke (%)
House heating fuel used in apartments - Wood (%)
House heating fuel used in apartments - Solar energy (%)
House heating fuel used in apartments - Other fuel (%)
House heating fuel used in apartments - No fuel used (%)
Median year house/condo built: 2002Median year apartment built: 1990Household type by relationship:
Households: 13,581
Male householders: 3,149 (615 living alone ), Female householders: 2,671 (854 living alone )2,960 spouses (2,960 opposite-sex spouses ), 289 unmarried partners , (289 opposite-sex unmarried partners ), 3,038 children (2,728 natural , 0 adopted , 309 stepchildren ), 504 grandchildren , 151 brothers or sisters , 188 parents , 0 foster children , 216 other relatives , 387 non-relatives In group quarters: 23
Size of family households: 2,480 2-persons , 722 3-persons , 551 4-persons , 146 5-persons , 84 6-persons , 69 7-or-more-persons .
Size of nonfamily households: 1,430 1-person , 245 2-persons , 41 3-persons , 16 4-persons .
1,149 married couples with children. single-parent households (284 men , 262 women ).
92.1% of residents of Chino Valley speak English at home. of residents speak Spanish at home (76% speak English very well , 21% speak English well , 2% speak English not well , 1% don't speak English at all ).of residents speak other Indo-European language at home (100% speak English very well ).of residents speak Asian or Pacific Island language at home (100% speak English very well ).of residents speak other language at home (100% speak English very well ).
Foreign born population: 641 (4.7%)of them are naturalized citizens )
Median number of rooms in houses and condos:
Median number of rooms in apartments
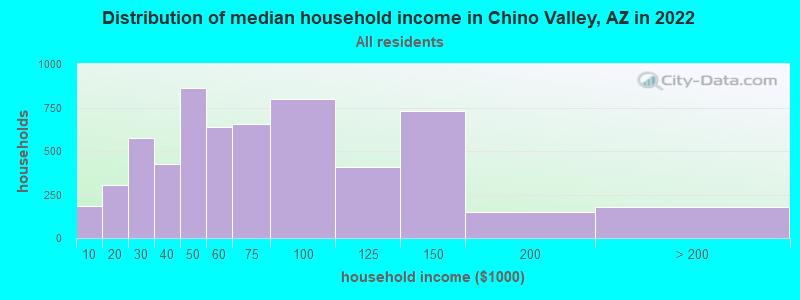
Chino Valley, AZ household income distribution 182 Less than $10,000304 $10,000 to $19,999574 $20,000 to $29,999425 $30,000 to $39,999860 $40,000 to $49,999636 $50,000 to $59,999657 $60,000 to $74,999796 $75,000 to $99,999407 $100,000 to $124,999729 $125,000 to $149,999151 $150,000 to $199,999176 $200,000 or more
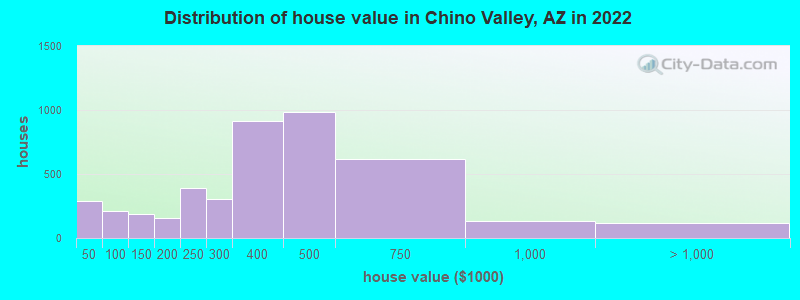
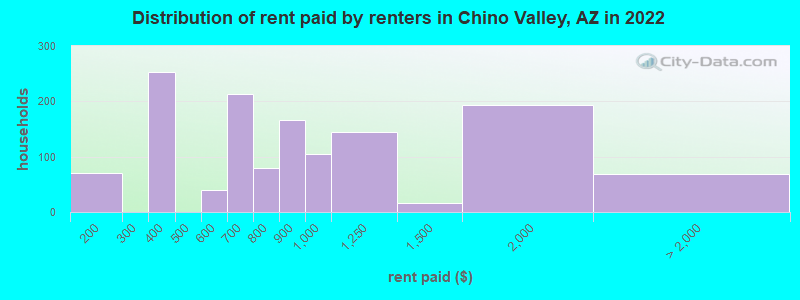
Home value of owner - occupied houses in 2022 in Chino Valley, AZ 90 Less than $10,00034 $10,000 to $14,99917 $15,000 to $19,99915 $20,000 to $24,99921 $35,000 to $39,999105 $40,000 to $49,99959 $50,000 to $59,99912 $70,000 to $79,99933 $80,000 to $89,999126 $100,000 to $124,99957 $125,000 to $149,99968 $150,000 to $174,99985 $175,000 to $199,999393 $200,000 to $249,999307 $250,000 to $299,999913 $300,000 to $399,999987 $400,000 to $499,999619 $500,000 to $749,999136 $750,000 to $999,99925 $1,500,000 to $1,999,99989 $2,000,000 or moreRent paid by renters in 2022 in Chino Valley, AZ 71 $150 to $199239 $300 to $34913 $350 to $39940 $550 to $599187 $600 to $64926 $650 to $69915 $700 to $74965 $750 to $799166 $800 to $899104 $900 to $999143 $1,000 to $1,24917 $1,250 to $1,499194 $1,500 to $1,99950 $2,000 to $2,49918 No cash rent
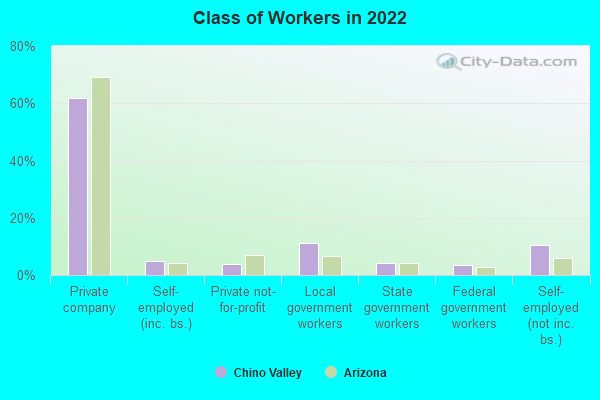
Percentage of workers working in this county: 100.2%Number of people working at home: 581 (11.3% of all workers )
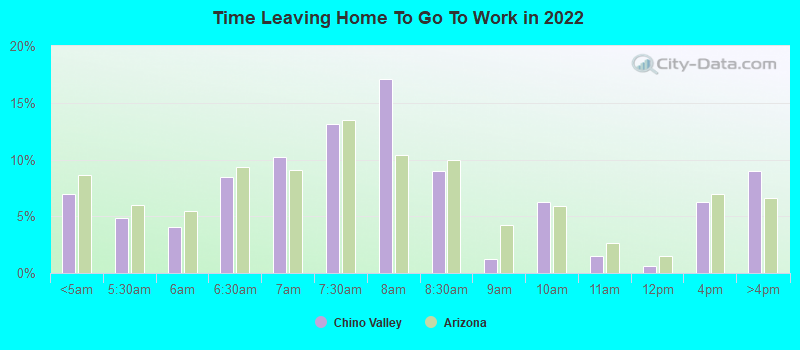
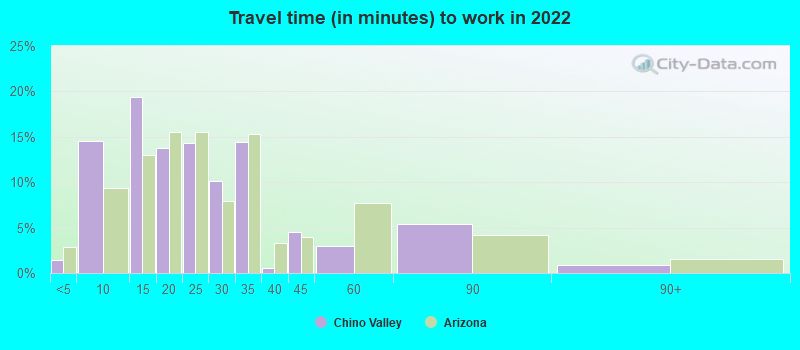
Travel time to work (commute)
Less than 5 minutes: 455 to 9 minutes: 41810 to 14 minutes: 29815 to 19 minutes: 16820 to 24 minutes: 73825 to 29 minutes: 55130 to 34 minutes: 1,09935 to 39 minutes: 18940 to 44 minutes: 18845 to 59 minutes: 47360 to 89 minutes: 13190 or more minutes: 177
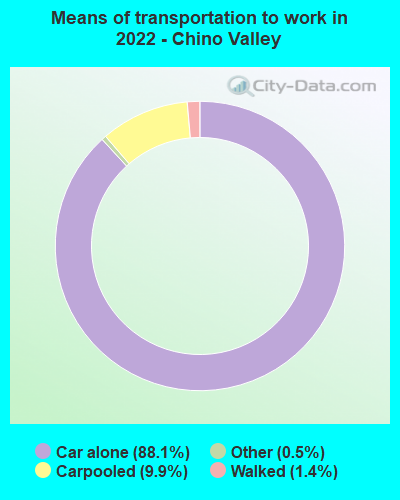
Means of transportation to work:
Drove a car alone: 2,710 (75.4%)Carpooled: 265 (7.4%)Taxi: 15 (0.4%)Walked: 37 (1.0%)Worked at home: 581 (16.2%)
Unemployment by race in 2022
Unemployment rate for White non-Hispanic residents 3.0% Males3.8% FemalesUnemployment rate for Asian residents 52.0% FemalesUnemployment rate for other race residents 27.1% MalesUnemployment rate for Hispanic or Latino residents 3.0% Males2.9% Females
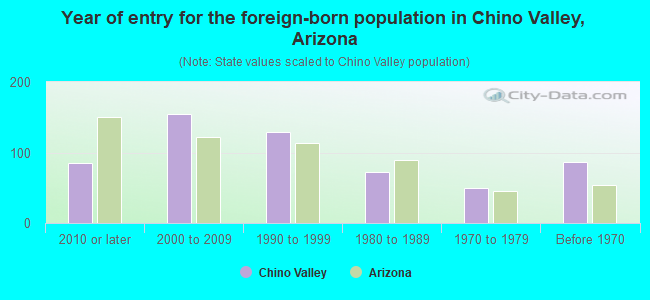
Year of entry for the foreign-born population in Chino Valley, Arizona
85 2010 or later 154 2000 to 2009 129 1990 to 1999 72 1980 to 1989 50 1970 to 1979 86 Before 1970
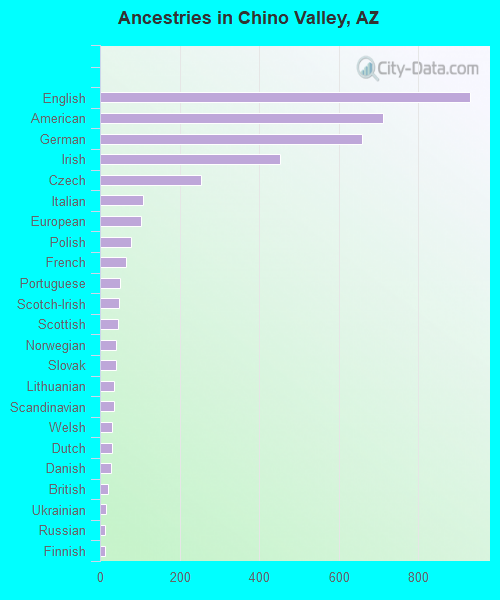
First ancestries reported:
English: 931 (19.7%)
American: 711 (15.0%)
German: 658 (13.9%)
Irish: 453 (9.6%)
Czech: 254 (5.4%)
Italian: 107 (2.3%)
European: 102 (2.2%)
Polish: 79 (1.7%)
French: 65 (1.4%)
Portuguese: 50 (1.1%)
Scotch-Irish: 47 (1.0%)
Scottish: 44 (0.9%)
Norwegian: 39 (0.8%)
Slovak: 39 (0.8%)
Lithuanian: 35 (0.7%)
Scandinavian: 35 (0.7%)
Welsh: 30 (0.6%)
Dutch: 29 (0.6%)
Danish: 28 (0.6%)
British: 19 (0.4%)
Ukrainian: 15 (0.3%)
Russian: 13 (0.3%)
Finnish: 12 (0.3%) Most common places of birth for foreign-born residents (%): Mexico Chino Valley:
47.0% (302)Arizona:
53.4% (500,086)
France Chino Valley:
18.4% (118)Arizona:
0.4% (3,628)
Germany Chino Valley:
7.0% (45)Arizona:
1.5% (14,058)
Czechoslovakia (includes Czech Republic and Slovakia) Chino Valley:
5.5% (35)Arizona:
0.2% (1,678)
Japan Chino Valley:
4.0% (26)Arizona:
0.6% (6,077)
El Salvador Chino Valley:
3.9% (25)Arizona:
1.2% (10,932)
Canada Chino Valley:
3.3% (21)Arizona:
4.3% (40,102)
India Chino Valley:
3.1% (20)Arizona:
4.5% (41,719)
Russia Chino Valley:
2.6% (17)Arizona:
0.4% (3,763)
Saudi Arabia Chino Valley:
2.2% (14)Arizona:
0.2% (1,456)
Portugal Chino Valley:
2.0% (13)Arizona:
0.1% (484)
Place of birth for U.S.-born residents:
This state: 5,416Other state: 7,516Northeast: 596Midwest: 2,129South: 799West: 4,110 88.1% of Chino Valley residents lived in the same house 1 years ago.
Out of people who lived in different houses, 22.8% lived in this county.
Out of people who lived in different counties, 36.0% lived in Arizona.
Chino Valley:
88.1%State average:
86.0%
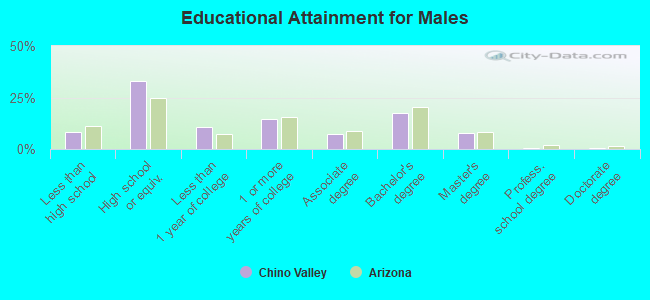
Education attainment for males 25 years and older:
No schooling: 38Nursery to 4th grade: 25th and 6th grade: 07th and 8th grade: 89th grade: 3210th grade: 1011th grade: 17012th grade, no diploma: 139High school graduate (or equivalency): 1,584Less than 1 year of college: 517Some college more than 1 year, no degree: 698Associate degree: 343Bachelor's degree: 831Master's degree: 369Professional school degree: 28Doctorate degree: 22
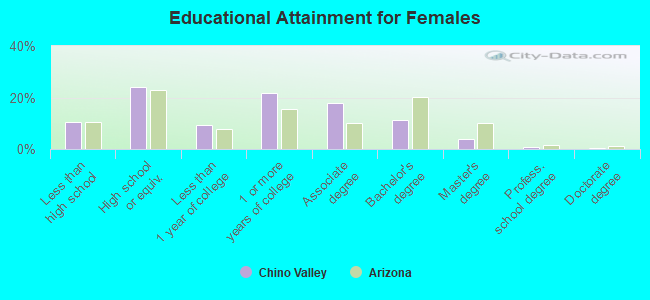
Education attainment for females 25 years and older:
No schooling: 13Nursery to 4th grade: 425th and 6th grade: 2827th and 8th grade: 349th grade: 7910th grade: 1911th grade: 10312th grade, no diploma: 31High school graduate (or equivalency): 1,393Less than 1 year of college: 529Some college more than 1 year, no degree: 1,244Associate degree: 1,037Bachelor's degree: 643Master's degree: 226Professional school degree: 54Doctorate degree: 32
Housing units in structures:
One, detached: 3,715One, attached: 66Two: 923 or 4: 1145 to 9: 12720 to 49: 2750 or more: 63Mobile homes: 1,964Boats, RVs, vans, etc.: 90Median worth of mobile homes: $236,584
Housing units lacking complete plumbing facilities in 2022: 1.4%Housing units lacking complete kitchen facilities in 2022: 1.4%House/condo owner moved in on average 7 years ago
Renter moved in on average 4 years ago
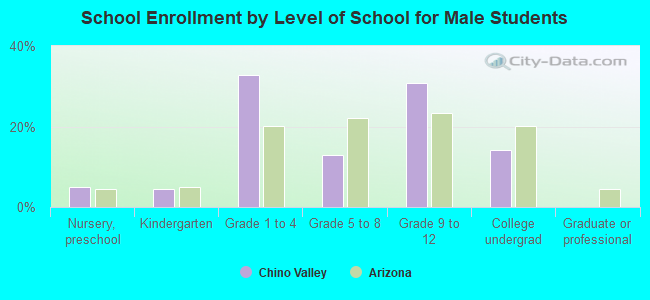
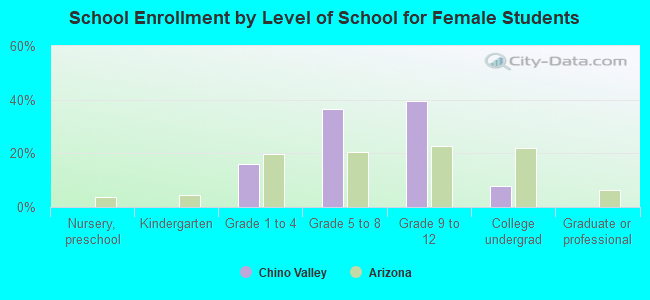
Private vs. public school enrollment:
Students in private schools in grades 1 to 8 (elementary and middle school): 130 Students in private schools in grades 9 to 12 (high school): 46 Students in private undergraduate colleges: 4