Chicopee, MA (Massachusetts) Houses and Residents
| Chicopee: | $252,152 |
| Massachusetts: | $534,700 |
Mean price in 2022:
Detached houses: $296,681
Here: $296,681 State: $651,570 Townhouses or other attached units: $247,067
Here: $247,067 State: $617,749 In 2-unit structures: $251,838
Here: $251,838 State: $594,808 In 3-to-4-unit structures: $186,488
Here: $186,488 State: $601,912 In 5-or-more-unit structures: $508,902
Here: $508,902 State: $555,768 Mobile homes: $110,521
Here: $110,521 State: $170,209
Total population: 55,795 (Urban population: 53,804, Rural population: 849 (all nonfarm))
Houses: 25,319 (23,794 occupied: 14,000 owner occupied, 9,739 renter occupied)
| % of renters here: | 41% |
| State: | 38% |
Housing density: 1,107 houses/condos per square mile
Median price asked for vacant for-sale houses and condos in 2022: $262,567.
Median contract rent in 2022: $878 (lower quartile is $641, upper quartile is $1,169)
Median rent asked for vacant for-rent units in 2022: $1,136
Median gross rent in Chicopee, MA in 2022: $1,018
Housing units in Chicopee with a mortgage: 8,580 (963 second mortgage, 24 home equity loan, 797 both second mortgage and home equity loan)
Houses without a mortgage: 563
Median household income for houses/condos with a mortgage: $84,482
Median household income for apartments without a mortgage: $63,121
Median monthly housing costs: $1,100
Compare current foreclosures in Chicopee, MA:
| Photo | Address | Area | Beds / Baths | Price | Details |
|---|---|---|---|---|---|

|
#1
Artisan St
Chicopee, MA 01013
|
1,125 sq. feet
|
1 baths 3 beds |
show details | |

|
#2
Butler Ave
Chicopee, MA 01020
|
1,445 sq. feet
|
1 baths 3 beds |
show details | |

|
#3
Granby Rd
Chicopee, MA 01013
|
945 sq. feet
|
1 baths 2 beds |
show details | |

|
#4
Wilfred St
Chicopee, MA 01020
|
1,360 sq. feet
|
1 baths 4 beds |
show details | |

|
#5
Pendleton Ave
Chicopee, MA 01022
|
1,024 sq. feet
|
1 baths 2 beds |
show details | |

|
#6
Royal St
Chicopee, MA 01020
|
3,296 sq. feet
|
4 baths 7 beds |
show details | |

|
#7
Telegraph Ave
Chicopee, MA 01020
|
3,072 sq. feet
|
5 baths 6 beds |
show details | |

|
#8
Honeysuckle Dr
Chicopee, MA 01022
|
1,042 sq. feet
|
1 baths 2 beds |
show details | |

|
#9
Fuller St
Chicopee, MA 01020
|
1,098 sq. feet
|
2 baths 3 beds |
show details | |

|
#10
Ohio Ave
Chicopee, MA 01013
|
1,411 sq. feet
|
1 baths 4 beds |
show details |
| Photo | Address | Area | Beds / Baths | Price | Details |
|---|---|---|---|---|---|

|
#11
Pondview Dr
Chicopee, MA 01020
|
1,200 sq. feet
|
1 baths 3 beds |
show details | |

|
#12
Wells Ave
Chicopee, MA 01020
|
1,144 sq. feet
|
1 baths 3 beds |
show details | |

|
#13
Chicopee St Apt 42
Chicopee, MA 01013
|
774 sq. feet
|
1 baths 2 beds |
show details | |

|
#14
Ferry St
Chicopee, MA 01013
|
792 sq. feet
|
1 baths 2 beds |
show details | |

|
#15
Elliot St
Chicopee, MA 01020
|
1,183 sq. feet
|
1 baths 2 beds |
show details | |

|
#16
Perrault St
Chicopee, MA 01013
|
1,156 sq. feet
|
1 baths 2 beds |
show details | |

|
#17
Old Pendleton Ave
Chicopee, MA 01020
|
1,340 sq. feet
|
1 baths 3 beds |
show details | |

|
#18
Hendrick St
Chicopee, MA 01020
|
1,008 sq. feet
|
1 baths 3 beds |
show details | |

|
#19
Calvin St
Chicopee, MA 01013
|
966 sq. feet
|
2 baths 3 beds |
show details | |

|
#20
Myrtle St
Chicopee, MA 01013
|
2,136 sq. feet
|
2 baths 4 beds |
show details |
| Photo | Address | Area | Beds / Baths | Price | Details |
|---|---|---|---|---|---|

|
#21
Boulay Cir
Chicopee, MA 01020
|
1,048 sq. feet
|
1 baths 2 beds |
show details | |

|
#22
Fredette St
Chicopee, MA 01022
|
769 sq. feet
|
1 baths 2 beds |
show details | |

|
#23
Wildermere St
Chicopee, MA 01020
|
1,648 sq. feet
|
1 baths 3 beds |
show details | |

|
#24
Irene St
Chicopee, MA 01020
|
1,088 sq. feet
|
2 baths 3 beds |
show details | |

|
#25
Butler Ave
Chicopee, MA 01020
|
1,445 sq. feet
|
1 baths 3 beds |
show details | |

|
#26
Clarendon Ave
Chicopee, MA 01013
|
616 sq. feet
|
1 baths 2 beds |
show details | |

|
#27
Marble Ave
Chicopee, MA 01013
|
1,274 sq. feet
|
2 baths 2 beds |
show details | |

|
#28
Grattan St
Chicopee, MA 01020
|
2,240 sq. feet
|
2 baths 4 beds |
show details | |

|
#29
Grattan St
Chicopee, MA 01020
|
3,447 sq. feet
|
3 baths 8 beds |
show details | |

|
#30
Andersen Rd
Chicopee, MA 01022
|
840 sq. feet
|
1 baths 2 beds |
show details |
| Photo | Address | Area | Beds / Baths | Price | Details |
|---|---|---|---|---|---|

|
#31
Medford St
Chicopee, MA 01020
|
1,352 sq. feet
|
1 baths 3 beds |
show details | |

|
#32
Chicopee St Apt 21
Chicopee, MA 01013
|
774 sq. feet
|
1 baths 2 beds |
show details | |

|
#33
Fredette St
Chicopee, MA 01022
|
769 sq. feet
|
1 baths 2 beds |
show details | |

|
#34
Mary St
Chicopee, MA 01020
|
1,414 sq. feet
|
2 baths 4 beds |
show details | |

|
#35
Old Lyman Rd
Chicopee, MA 01020
|
960 sq. feet
|
1 baths 3 beds |
show details | |

|
#36
Labelle Cir
Chicopee, MA 01020
|
2,234 sq. feet
|
1 baths 4 beds |
show details | |

|
#37
Sheridan St
Chicopee, MA 01020
|
1,966 sq. feet
|
2 baths 3 beds |
show details | |

|
#38
Leo Dr
Chicopee, MA 01020
|
1,228 sq. feet
|
2 baths 3 beds |
show details | |

|
#39
Beeler Ave
Chicopee, MA 01020
|
1,056 sq. feet
|
1 baths 3 beds |
show details | |

|
#40
Sheridan St
Chicopee, MA 01020
|
1,155 sq. feet
|
1 baths 3 beds |
show details |
| Photo | Address | Area | Beds / Baths | Price | Details |
|---|---|---|---|---|---|

|
#41
Dale St
Chicopee, MA 01013
|
2,344 sq. feet
|
2 baths 3 beds |
show details | |

|
#42
State St
Chicopee, MA 01013
|
1,632 sq. feet
|
1 baths 4 beds |
show details | |

|
#43
Stebbins St
Chicopee, MA 01020
|
864 sq. feet
|
1 baths 2 beds |
show details | |

|
#44
Irene St
Chicopee, MA 01020
|
1,088 sq. feet
|
1 baths 3 beds |
show details | |

|
#45
Brightwood St
Chicopee, MA 01020
|
2,576 sq. feet
|
4 baths 4 beds |
show details | |

|
#46
Asselin St
Chicopee, MA 01020
|
950 sq. feet
|
1 baths 3 beds |
show details | |

|
#47
Chicopee St # 2
Chicopee, MA 01013
|
2,402 sq. feet
|
2 baths 4 beds |
show details | |

|
#48
Burnett Rd
Chicopee, MA 01020
|
1,092 sq. feet
|
1 baths 2 beds |
show details | |

|
#49
Rolf Ave
Chicopee, MA 01020
|
2,354 sq. feet
|
2 baths 4 beds |
show details | |

|
Check over 1 million property listings on Foreclosure.com!
|
browse all offers | |||

Latest news about housing in Chicopee, MA collected exclusively by city-data.com from local newspapers, TV, and radio stations

 | Pet (dog) friendly apartments or homes to rent near Springfield MA? (3 replies) |
| How Much Massachusetts Households Make Per Year: Census Data (37 replies) |
| 2023 Real Estate Observations (5278 replies) |
| 2022 Real Estate Observations (1122 replies) |
| 2021 Real Estate Observations (1729 replies) |
| When is the insanity going to end? There has to be a real estate market crash, right? (99 replies) |

Median year apartment built: 1956
Household type by relationship:
Households: 55,019- Male householders: 10,427 (3,946 living alone), Female householders: 13,124 (4,220 living alone)
8,124 spouses (8,057 opposite-sex spouses), 2,068 unmarried partners, (1,940 opposite-sex unmarried partners), 15,513 children (14,445 natural, 339 adopted, 728 stepchildren), 952 grandchildren, 599 brothers or sisters, 485 parents, 85 foster children, 848 other relatives, 1,777 non-relatives
- In group quarters: 1,013
Size of family households: 6,319 2-persons, 3,817 3-persons, 2,019 4-persons, 824 5-persons, 312 6-persons, 150 7-or-more-persons.
Size of nonfamily households: 8,841 1-person, 1,464 2-persons, 48 3-persons, 27 4-persons, 7 6-persons.
4,463 married couples with children.
4,731 single-parent households (1,087 men, 3,644 women).
77.0% of residents of Chicopee speak English at home.
13.9% of residents speak Spanish at home (75% speak English very well, 14% speak English well, 6% speak English not well, 5% don't speak English at all).
6.6% of residents speak other Indo-European language at home (60% speak English very well, 25% speak English well, 10% speak English not well, 5% don't speak English at all).
1.9% of residents speak Asian or Pacific Island language at home (60% speak English very well, 31% speak English well, 9% speak English not well).
0.5% of residents speak other language at home (75% speak English very well, 25% speak English well).
Foreign born population: 5,039 (9.2%)
(57.6% of them are naturalized citizens)
| Here: | 5.6 |
| State: | 6.5 |
| Here: | 4.2 |
| State: | 4.0 |

- Bedrooms in owner-occupied houses and condos in Chicopee, Massachusetts
- 0no bedroom
- 2801 bedroom
- 4,0362 bedrooms
- 7,3173 bedrooms
- 1,8564 bedrooms
- 5115+ bedrooms

- Bedrooms in renter-occupied apartments in Chicopee, Massachusetts
- 550no bedroom
- 2,7821 bedroom
- 3,7732 bedrooms
- 2,2063 bedrooms
- 3154 bedrooms
- 1135+ bedrooms

- Cars and other vehicles available in Chicopee in owner-occupied houses/condos
- 512no vehicle
- 4,7851 vehicle
- 6,1632 vehicles
- 1,6503 vehicles
- 5024 vehicles
- 3895+ vehicles

- Cars and other vehicles available in Chicopee in renter-occupied apartments
- 2,083no vehicle
- 4,7411 vehicle
- 2,4462 vehicles
- 3593 vehicles
- 864 vehicles
- 255+ vehicles

- Rooms in owner-occupied houses in Chicopee, Massachusetts
- 01 room
- 652 rooms
- 2173 rooms
- 2,1544 rooms
- 3,9255 rooms
- 3,6996 rooms
- 1,8707 rooms
- 8678 rooms
- 1,2039+ rooms

- Rooms in renter-occupied apartments in Chicopee, Massachusetts
- 5101 room
- 4472 rooms
- 1,8313 rooms
- 2,8984 rooms
- 2,5005 rooms
- 9546 rooms
- 2497 rooms
- 2278 rooms
- 1239+ rooms


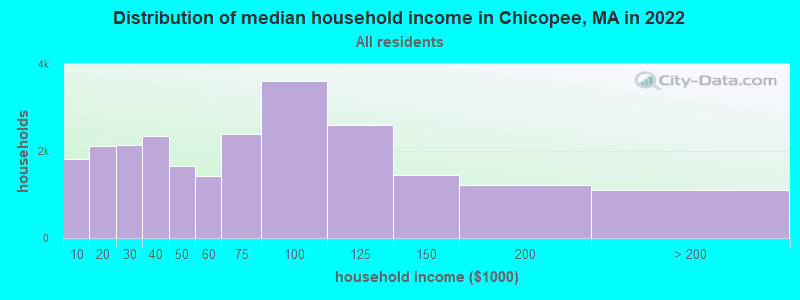
Chicopee, MA household income distribution

- 1,819Less than $10,000
- 2,120$10,000 to $19,999
- 2,129$20,000 to $29,999
- 2,354$30,000 to $39,999
- 1,662$40,000 to $49,999
- 1,428$50,000 to $59,999
- 2,393$60,000 to $74,999
- 3,618$75,000 to $99,999
- 2,591$100,000 to $124,999
- 1,455$125,000 to $149,999
- 1,219$150,000 to $199,999
- 1,104$200,000 or more
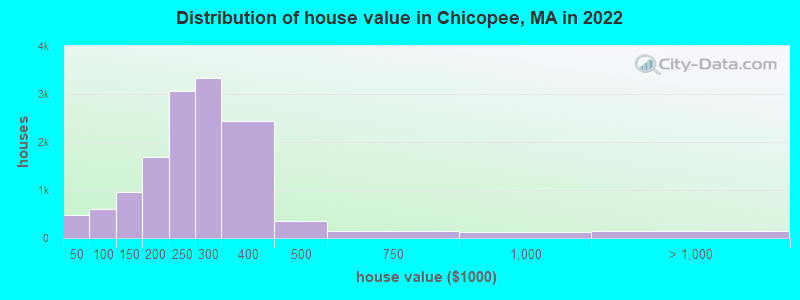
Home value of owner - occupied houses in 2022 in Chicopee, MA
-
- 65Less than $10,000
- 17$10,000 to $14,999
- 107$15,000 to $19,999
- 178$20,000 to $24,999
- 47$25,000 to $29,999
- 34$30,000 to $34,999
- 22$35,000 to $39,999
- 78$50,000 to $59,999
- 8$60,000 to $69,999
- 97$70,000 to $79,999
- 349$80,000 to $89,999
- 61$90,000 to $99,999
- 458$100,000 to $124,999
- 497$125,000 to $149,999
- 685$150,000 to $174,999
- 1,006$175,000 to $199,999
- 3,054$200,000 to $249,999
- 3,328$250,000 to $299,999
- 2,437$300,000 to $399,999
- 356$400,000 to $499,999
- 143$500,000 to $749,999
- 118$750,000 to $999,999
- 73$1,000,000 to $1,499,999
- 73$2,000,000 or more
Rent paid by renters in 2022 in Chicopee, MA
-
- 111Less than $100
- 220$100 to $149
- 115$150 to $199
- 141$200 to $249
- 295$250 to $299
- 439$300 to $349
- 86$350 to $399
- 142$400 to $449
- 153$450 to $499
- 206$500 to $549
- 129$550 to $599
- 357$600 to $649
- 131$650 to $699
- 616$700 to $749
- 426$750 to $799
- 1,361$800 to $899
- 895$900 to $999
- 1,806$1,000 to $1,249
- 944$1,250 to $1,499
- 707$1,500 to $1,999
- 148$2,000 to $2,499
- 340No cash rent


Percentage of workers working in this county: 83.4%
Number of people working at home: 1,997 (7.6% of all workers)
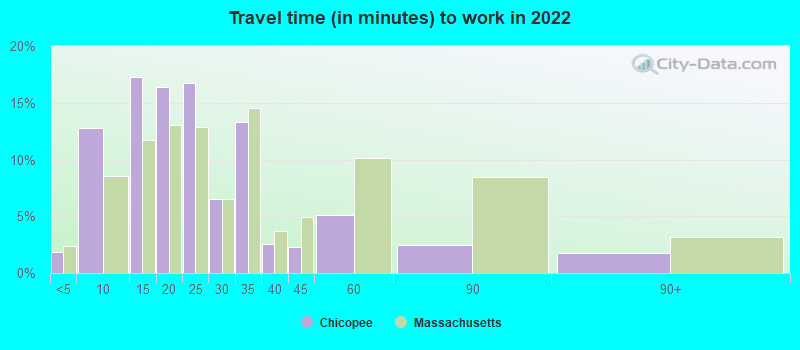
Travel time to work (commute)
- Less than 5 minutes: 410
- 5 to 9 minutes: 3,350
- 10 to 14 minutes: 4,771
- 15 to 19 minutes: 4,891
- 20 to 24 minutes: 4,256
- 25 to 29 minutes: 1,476
- 30 to 34 minutes: 2,823
- 35 to 39 minutes: 553
- 40 to 44 minutes: 352
- 45 to 59 minutes: 556
- 60 to 89 minutes: 419
- 90 or more minutes: 261
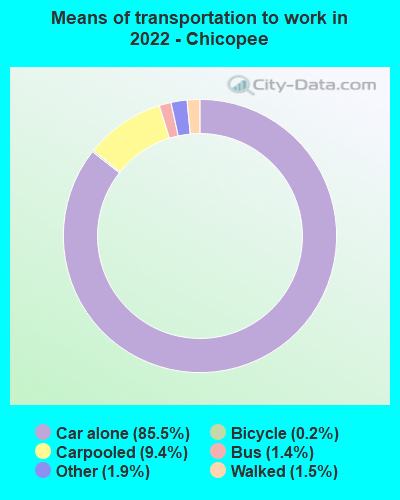
Means of transportation to work:
- Drove a car alone: 15,948 (74.6%)
- Carpooled: 2,421 (11.3%)
- Bus: 170 (0.8%)
- Taxi: 629 (2.9%)
- Bicycle: 36 (0.2%)
- Walked: 326 (1.5%)
- Worked at home: 1,997 (9.3%)

- Unemployment by race in 2022
- Unemployment rate for White non-Hispanic residents
- 3.2%Males
- 3.2%Females
- Unemployment rate for Black residents
- 2.1%Males
- 10.9%Females
- Unemployment rate for Asian residents
- 3.2%Males
- Unemployment rate for other race residents
- 6.5%Males
- 7.8%Females
- Unemployment rate for two or more race residents
- 1.9%Males
- 31.0%Females
- Unemployment rate for Hispanic or Latino residents
- 5.3%Males
- 14.7%Females

- Year of entry for the foreign-born population in Chicopee, Massachusetts
- 1,1692010 or later
- 9242000 to 2009
- 9221990 to 1999
- 6311980 to 1989
- 6971970 to 1979
- 1,841Before 1970

First ancestries reported:
- Polish: 3,672 (14.2%)
- French Canadian: 2,426 (9.4%)
- French: 1,972 (7.6%)
- Irish: 1,321 (5.1%)
- American: 1,222 (4.7%)
- English: 876 (3.4%)
- Portuguese: 613 (2.4%)
- Russian: 585 (2.3%)
- Italian: 532 (2.1%)
- Canadian: 350 (1.4%)
- German: 344 (1.3%)
- Greek: 158 (0.6%)
- Scottish: 148 (0.6%)
- African: 109 (0.4%)
- Ukrainian: 102 (0.4%)
- U.S. Virgin Islander: 75 (0.3%)
- Finnish: 72 (0.3%)
- Nigerian: 66 (0.3%)
- European: 63 (0.2%)
- Lebanese: 62 (0.2%)
- Jamaican: 61 (0.2%)
- Arab: 54 (0.2%)
- British: 49 (0.2%)
- Welsh: 44 (0.2%)
- Scotch-Irish: 42 (0.2%)
- Haitian: 38 (0.1%)
- Norwegian: 31 (0.1%)
- Danish: 26 (0.1%)
- Turkish: 24 (0.09%)
- Iraqi: 24 (0.09%)
- British West Indian: 22 (0.08%)
- Yugoslavian: 19 (0.07%)
- Eastern European: 13 (0.05%)
- Ghanaian: 13 (0.05%)
- Romanian: 12 (0.05%)
- Dutch: 11 (0.04%)
- Brazilian: 10 (0.04%)
- Lithuanian: 9 (0.03%)
- Cape Verdean: 8 (0.03%)
- Czech: 6 (0.02%)
- Swedish: 6 (0.02%)
- Hungarian: 4 (0.02%)
- Northern European: 2 (0.01%)
Most common places of birth for foreign-born residents (%):
| Chicopee: | 16.5% (842) |
| Massachusetts: | 0.9% (10,915) |
| Chicopee: | 9.5% (486) |
| Massachusetts: | 2.3% (28,158) |
| Chicopee: | 8.3% (421) |
| Massachusetts: | 1.2% (14,305) |
| Chicopee: | 7.1% (362) |
| Massachusetts: | 4.1% (50,360) |
| Chicopee: | 5.2% (267) |
| Massachusetts: | 1.5% (18,278) |
| Chicopee: | 4.2% (214) |
| Massachusetts: | 8.3% (101,767) |
| Chicopee: | 3.9% (201) |
| Massachusetts: | 0.6% (7,555) |
| Chicopee: | 3.5% (178) |
| Massachusetts: | 0.4% (4,735) |
| Chicopee: | 3.2% (162) |
| Massachusetts: | 0.1% (886) |
| Chicopee: | 3.0% (154) |
| Massachusetts: | 2.3% (27,810) |
| Chicopee: | 2.4% (123) |
| Massachusetts: | 8.4% (103,233) |
| Chicopee: | 2.2% (110) |
| Massachusetts: | 3.7% (45,667) |
| Chicopee: | 1.9% (99) |
| Massachusetts: | 0.9% (10,808) |
| Chicopee: | 1.8% (94) |
| Massachusetts: | 0.6% (7,349) |
| Chicopee: | 1.5% (77) |
| Massachusetts: | 0.5% (5,553) |
Place of birth for U.S.-born residents:
- This state: 37,286
- Other state: 8,957
- Northeast: 5,749
- Midwest: 690
- South: 2,009
- West: 484
92.0% of Chicopee residents lived in the same house 1 years ago.
Out of people who lived in different houses, 39.2% lived in this county.
Out of people who lived in different counties, 63.2% lived in Massachusetts.
| Chicopee: | 92.0% |
| State average: | 87.7% |
Education attainment for males 25 years and older:
- No schooling: 510
- Nursery to 4th grade: 168
- 5th and 6th grade: 34
- 7th and 8th grade: 183
- 9th grade: 85
- 10th grade: 411
- 11th grade: 636
- 12th grade, no diploma: 788
- High school graduate (or equivalency): 6,823
- Less than 1 year of college: 1,585
- Some college more than 1 year, no degree: 2,284
- Associate degree: 1,632
- Bachelor's degree: 2,599
- Master's degree: 956
- Professional school degree: 88
- Doctorate degree: 163

Education attainment for females 25 years and older:
- No schooling: 413
- Nursery to 4th grade: 43
- 5th and 6th grade: 41
- 7th and 8th grade: 381
- 9th grade: 268
- 10th grade: 231
- 11th grade: 454
- 12th grade, no diploma: 538
- High school graduate (or equivalency): 5,915
- Less than 1 year of college: 1,709
- Some college more than 1 year, no degree: 2,566
- Associate degree: 2,347
- Bachelor's degree: 3,528
- Master's degree: 1,785
- Professional school degree: 157
- Doctorate degree: 189


Housing units in structures:
- One, detached: 12,195
- One, attached: 1,874
- Two: 3,404
- 3 or 4: 2,901
- 5 to 9: 1,757
- 10 to 19: 471
- 20 to 49: 826
- 50 or more: 1,212
- Mobile homes: 674
Median worth of mobile homes: $84,573
Housing units lacking complete kitchen facilities in 2022: 0.8%
House/condo owner moved in on average 16 years ago
Renter moved in on average 4 years ago

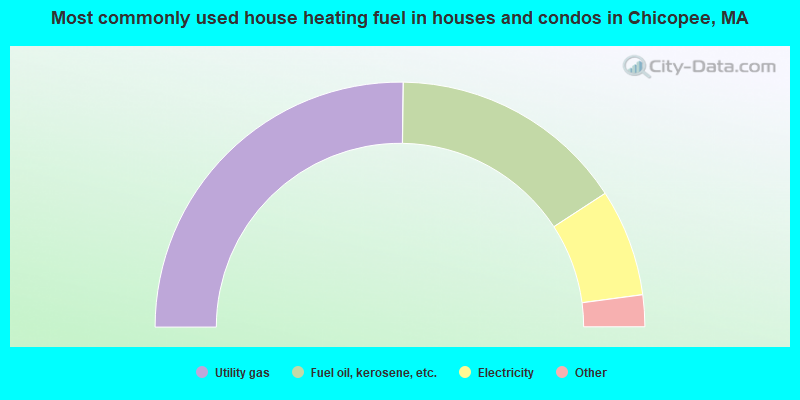
- 50.5%Utility gas
- 31.2%Fuel oil, kerosene, etc.
- 14.2%Electricity
- 1.6%Bottled, tank, or LP gas
- 1.4%Other fuel
- 1.1%Wood
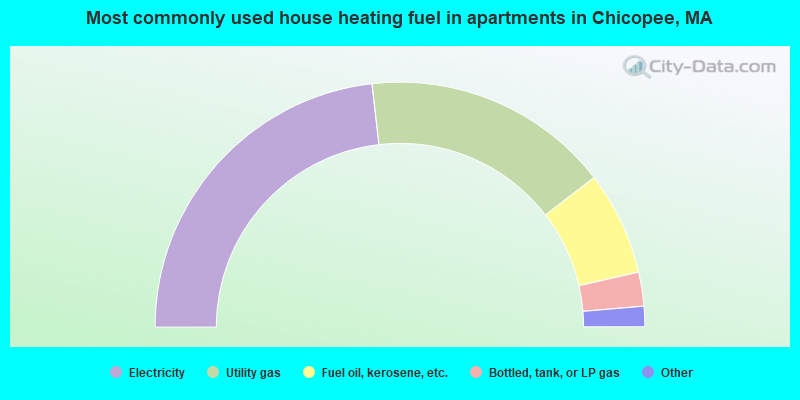
- 46.4%Electricity
- 32.8%Utility gas
- 13.7%Fuel oil, kerosene, etc.
- 4.5%Bottled, tank, or LP gas
- 2.1%No fuel used
- 0.6%Other fuel
Private vs. public school enrollment:
| Here: | 15.6% |
| Massachusetts: | 10.3% |
| Here: | 10.9% |
| Massachusetts: | 12.3% |
| Here: | 45.6% |
| Massachusetts: | 51.2% |


