Cheyenne, WY (Wyoming) Houses and Residents
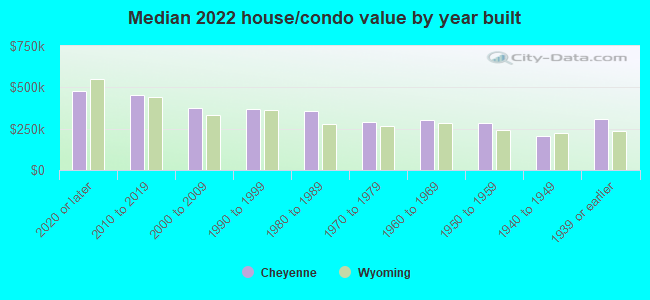
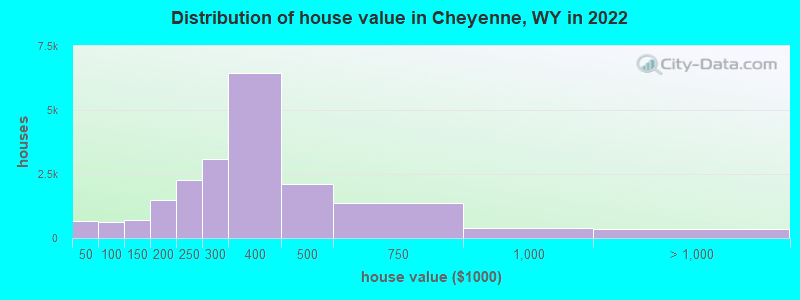
Estimated median house or condo value in 2022: $320,800 (it was $100,400 in 2000 )
Cheyenne:
$320,800Wyoming:
$292,300
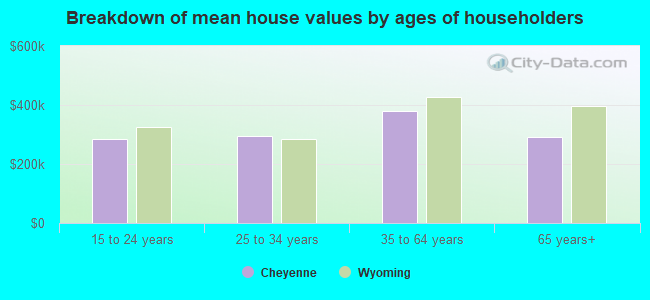
Lower value quartile - upper value quartile: $244,500 - $398,500Mean price in 2022: Detached houses: $330,006 Here:
$330,006State:
$440,428
Townhouses or other attached units: $424,992 Here:
$424,992State:
$366,317
In 2-unit structures: $411,691 Here:
$411,691State:
$506,426
In 3-to-4-unit structures: $383,909 Here:
$383,909State:
$430,152
In 5-or-more-unit structures: $1,091,824 Here:
$1,091,824State:
$417,840
Mobile homes: $102,083 Here:
$102,083State:
$108,030
Total population: 62,845 (Urban population: 52,380, Rural population: 383 (all nonfarm) )
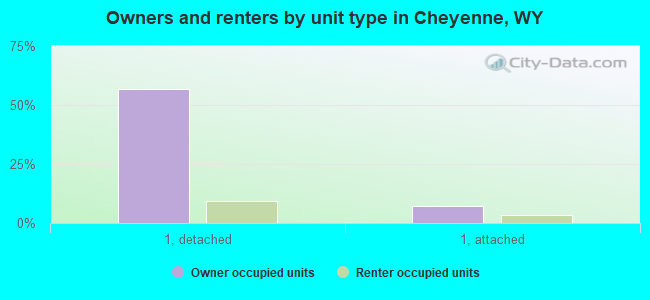
Houses: 30,628 (28,455 occupied: 19,382 owner occupied, 9,073 renter occupied )
% of renters here:
32%State:
27%
Housing density: 1,451 houses/condos per square mile
Median price asked for vacant for-sale houses and condos in 2022: $340,348.
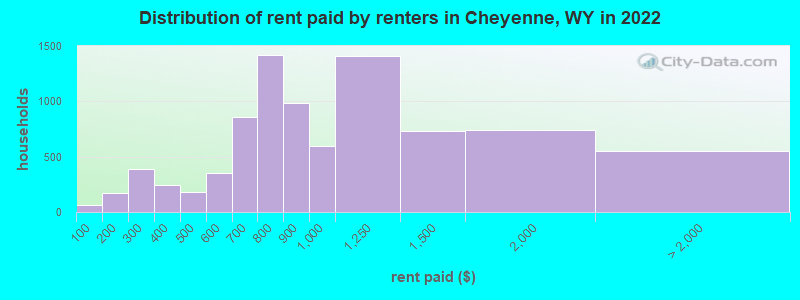
Median contract rent in 2022: $914 (lower quartile is $712, upper quartile is $1,267)
Median rent asked for vacant for-rent units in 2022: $2,704
Median gross rent in Cheyenne, WY in 2022: $1,043
Housing units in Cheyenne with a mortgage: 14,330 (1,315 second mortgage, 43 home equity loan, 621 both second mortgage and home equity loan )Houses without a mortgage: 572
Median household income for houses/condos with a mortgage: $92,045
Median household income for apartments without a mortgage: $62,751
Median monthly housing costs: $1,365
Data:
Median house or condo value ($)
Median house or condo value ($ change since 2000)
Median house or condo value ($) - White
Median house or condo value ($) - Black or African American
Median house or condo value ($) - Asian
Median house or condo value ($) - Hispanic or Latino
Median house or condo value ($) - American Indian and Alaska Native
Median house or condo value ($) - Multirace
Median house or condo value ($) - Other Race
Median price asked for mobile homes ($)
Household density (households per square mile)
Mean house or condo value by units in structure - 1, detached ($)
Mean house or condo value by units in structure - 1, attached ($)
Mean house or condo value by units in structure - 2 ($)
Mean house or condo value by units in structure by units in structure - 3 or 4 ($)
Mean house or condo value by units in structure - 5 or more ($)
Mean house or condo value by units in structure - Boat, RV, van, etc. ($)
Mean house or condo value by units in structure - Mobile home ($)
Median contract rent ($)
Median contract rent - Lower quartile ($)
Median contract rent - Upper quartile ($)
Median gross rent ($)
Urban houses (%)
Rural houses (%)
Houses occupied (%)
Houses occupied (% change since 2000)
Houses owner occupied (%)
Houses owner occupied (% change since 2000)
Houses renter occupied (%)
Houses renter occupied (% change since 2000)
Vacant housing units - For rent (%)
Vacant housing units - For rent (% change since 2000)
Vacant housing units - For sale only (%)
Vacant housing units - For sale only (% change since 2000)
Vacant housing units - Rented or sold, not occupied (%)
Vacant housing units - Rented or sold, not occupied (% change since 2000)
Vacant housing units - For seasonal, recreational, or occasional use (%)
Vacant housing units - For seasonal, recreational, or occasional use (% change since 2000)
Vacant housing units - For migrant workers (%)
Vacant housing units - For migrant workers (% change since 2000)
Vacant housing units - Other vacant (%)
Vacant housing units - Other vacant (% change since 2000)
Median monthly housing costs ($)
Median household income for houses/condos with a mortgage ($)
Median household income for houses/condos without a mortgage ($)
Median household income ($)
Median household income ($) - White
Median household income ($) - Black or African American
Median household income ($) - Asian
Median household income ($) - Hispanic or Latino
Median household income ($) - American Indian and Alaska Native
Median household income ($) - Multirace
Median household income ($) - Other Race
Mortgage status - with mortgage (%)
Mortgage status - with second mortgage (%)
Mortgage status - with home equity loan (%)
Mortgage status - with both second mortgage and home equity loan (%)
Mortgage status - without a mortgage (%)
Median year house/condo built
Median year apartment built
Household type by relationship - Male householder living alone (%)
Household type by relationship - Male householder not living alone (%)
Household type by relationship - Female householder living alone (%)
Household type by relationship - Female householder not living alone (%)
Household type by relationship - Opposite-Sex spouse (%)
Household type by relationship - Same-Sex spouse (%)
Household type by relationship - Opposite-Sex unmarried partner (%)
Household type by relationship - Same-Sex unmarried partner (%)
Household type by relationship - In group quarters (%)
Size of family households - 2-person household (%)
Size of family households - 3-person household (%)
Size of family households - 4-person household (%)
Size of family households - 5-person household (%)
Size of family households - 6-person household (%)
Size of family households - 7-or-more-person household (%)
Size of nonfamily households - 1-person household (%)
Size of nonfamily households - 2-person household (%)
Size of nonfamily households - 3-person household (%)
Size of nonfamily households - 4-person household (%)
Size of nonfamily households - 5-person household (%)
Size of nonfamily households - 6-person household (%)
Size of nonfamily households - 7-or-moreperson household (%)
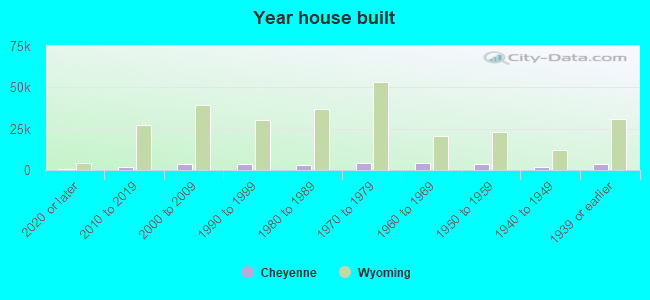
Year house built - Built 2010 or later (%)
Year house built - Built 2000 to 2009 (%)
Year house built - Built 1990 to 1999 (%)
Year house built - Built 1980 to 1989 (%)
Year house built - Built 1970 to 1979 (%)
Year house built - Built 1960 to 1969 (%)
Year house built - Built 1950 to 1959 (%)
Year house built - Built 1940 to 1949 (%)
Year house built - Built 1939 or earlier (%)
Median number of rooms in houses and condos
Median number of rooms in apartments
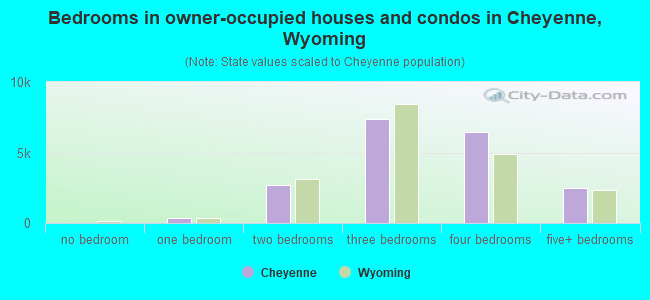
Median number of bedrooms in owner occupied houses
Mean number of bedrooms in owner occupied houses
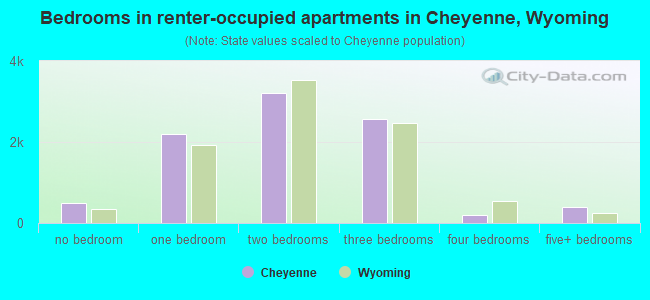
Median number of bedrooms in renter occupied houses
Mean number of bedrooms in renter occupied houses
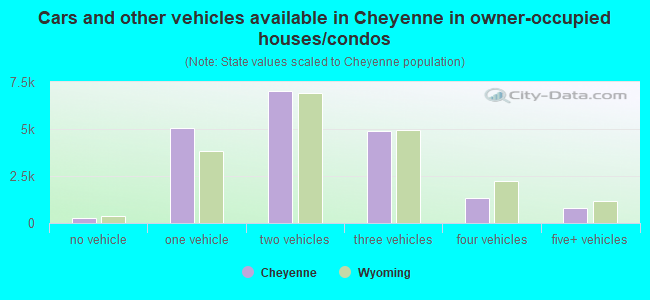
Median number of vehichles in owner occupied houses
Mean number of vehichles in owner occupied houses
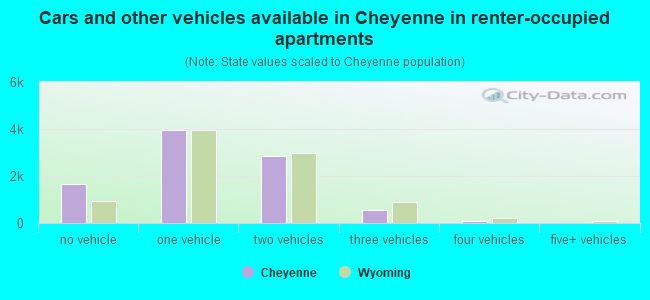
Median number of vehichles in renter occupied houses
Mean number of vehichles in renter occupied houses
Rooms in owner-occupied houses - 1 room (%)
Rooms in owner-occupied houses - 2 rooms (%)
Rooms in owner-occupied houses - 3 rooms (%)
Rooms in owner-occupied houses - 4 rooms (%)
Rooms in owner-occupied houses - 5 rooms (%)
Rooms in owner-occupied houses - 6 rooms (%)
Rooms in owner-occupied houses - 7 rooms (%)
Rooms in owner-occupied houses - 8 rooms (%)
Rooms in owner-occupied houses - 9+ rooms (%)
Rooms in renter-occupied houses - 1 room (%)
Rooms in renter-occupied houses - 2 rooms (%)
Rooms in renter-occupied houses - 3 rooms (%)
Rooms in renter-occupied houses - 4 rooms (%)
Rooms in renter-occupied houses - 5 rooms (%)
Rooms in renter-occupied houses - 6 rooms (%)
Rooms in renter-occupied houses - 7 rooms (%)
Rooms in renter-occupied houses - 8 rooms (%)
Rooms in renter-occupied houses - 9+ rooms (%)
Bedrooms in owner-occupied houses - no bedrooms (%)
Bedrooms in owner-occupied houses - 1 bedroom (%)
Bedrooms in owner-occupied houses - 2 bedrooms (%)
Bedrooms in owner-occupied houses - 3 bedrooms (%)
Bedrooms in owner-occupied houses - 4 bedrooms (%)
Bedrooms in owner-occupied houses - 5+ bedrooms (%)
Bedrooms in renter-occupied houses - no bedrooms (%)
Bedrooms in renter-occupied houses - 1 bedroom (%)
Bedrooms in renter-occupied houses - 2 bedrooms (%)
Bedrooms in renter-occupied houses - 3 bedrooms (%)
Bedrooms in renter-occupied houses - 4 bedrooms (%)
Bedrooms in renter-occupied houses - 5+ bedrooms (%)
Vehicles available in owner-occupied houses - no vehicle available (%)
Vehicles available in owner-occupied houses - 1 vehicle available(%)
Vehicles available in owner-occupied houses - 2 Vehicles available (%)
Vehicles available in owner-occupied houses - 3 Vehicles available (%)
Vehicles available in owner-occupied houses - 4 Vehicles available (%)
Vehicles available in owner-occupied houses - 5+ Vehicles available (%)
Vehicles available in renter-occupied houses - no vehicle available (%)
Vehicles available in renter-occupied houses - 1 vehicle available (%)
Vehicles available in renter-occupied houses - 2 Vehicles available (%)
Vehicles available in renter-occupied houses - 3 Vehicles available (%)
Vehicles available in renter-occupied houses - 4 Vehicles available (%)
Vehicles available in renter-occupied houses - 5+ Vehicles available (%)
Housing units in structures - 1, detached (%)
Housing units in structures - 1, attached (%)
Housing units in structures - 2 (%)
Housing units in structures - 3 or 4 (%)
Housing units in structures - 5 to 9 (%)
Housing units in structures - 10 to 19 (%)
Housing units in structures - 20 to 49 (%)
Housing units in structures - 50 or more (%)
Housing units in structures - Mobile home (%)
Housing units in structures - Boat, RV, van, etc. (%)
Housing units in structures - Owners - 1, detached (%)
Housing units in structures - Owners - 1, attached (%)
Housing units in structures - Owners - 2 (%)
Housing units in structures - Owners - 3 or 4 (%)
Housing units in structures - Owners - 5 to 9 (%)
Housing units in structures - Owners - 10 to 19 (%)
Housing units in structures - Owners - 20 to 49 (%)
Housing units in structures - Owners - 50 or more (%)
Housing units in structures - Owners - Mobile home (%)
Housing units in structures - Owners - Boat, RV, van, etc. (%)
Housing units in structures - Renters - 1, detached (%)
Housing units in structures - Renters - 1, attached (%)
Housing units in structures - Renters - 2 (%)
Housing units in structures - Renters - 3 or 4 (%)
Housing units in structures - Renters - 5 to 9 (%)
Housing units in structures - Renters - 10 to 19 (%)
Housing units in structures - Renters - 20 to 49 (%)
Housing units in structures - Renters - 50 or more (%)
Housing units in structures - Renters - Mobile home (%)
Housing units in structures - Renters - Boat, RV, van, etc. (%)
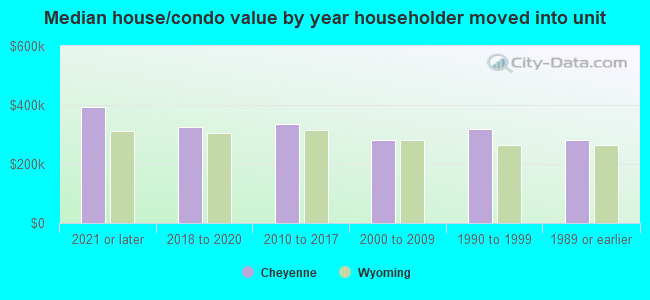
House/condo owner moved in on average (years ago)
Renter moved in on average (years ago)
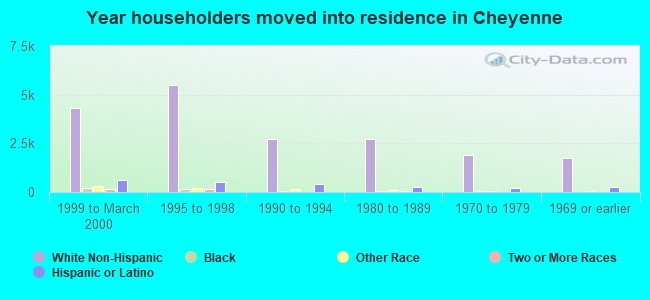
Year householder moved into unit - Moved in 1999 to March 2000 (%)
Year householder moved into unit - Moved in 1999 to March 2000 (%) - White
Year householder moved into unit - Moved in 1999 to March 2000 (%) - Black or African American
Year householder moved into unit - Moved in 1999 to March 2000 (%) - Asian
Year householder moved into unit - Moved in 1999 to March 2000 (%) - Hispanic or Latino
Year householder moved into unit - Moved in 1999 to March 2000 (%) - American Indian and Alaska Native
Year householder moved into unit - Moved in 1999 to March 2000 (%) - Multirace
Year householder moved into unit - Moved in 1999 to March 2000 (%) - Other Race
Year householder moved into unit - Moved in 1995 to 1998 (%)
Year householder moved into unit - Moved in 1995 to 1998 (%) - White
Year householder moved into unit - Moved in 1995 to 1998 (%) - Black or African American
Year householder moved into unit - Moved in 1995 to 1998 (%) - Asian
Year householder moved into unit - Moved in 1995 to 1998 (%) - Hispanic or Latino
Year householder moved into unit - Moved in 1995 to 1998 (%) - American Indian and Alaska Native
Year householder moved into unit - Moved in 1995 to 1998 (%) - Multirace
Year householder moved into unit - Moved in 1995 to 1998 (%) - Other Race
Year householder moved into unit - Moved in 1990 to 1994 (%)
Year householder moved into unit - Moved in 1990 to 1994 (%) - White
Year householder moved into unit - Moved in 1990 to 1994 (%) - Black or African American
Year householder moved into unit - Moved in 1990 to 1994 (%) - Asian
Year householder moved into unit - Moved in 1990 to 1994 (%) - Hispanic or Latino
Year householder moved into unit - Moved in 1990 to 1994 (%) - American Indian and Alaska Native
Year householder moved into unit - Moved in 1990 to 1994 (%) - Multirace
Year householder moved into unit - Moved in 1990 to 1994 (%) - Other Race
Year householder moved into unit - Moved in 1980 to 1989 (%)
Year householder moved into unit - Moved in 1980 to 1989 (%) - White
Year householder moved into unit - Moved in 1980 to 1989 (%) - Black or African American
Year householder moved into unit - Moved in 1980 to 1989 (%) - Asian
Year householder moved into unit - Moved in 1980 to 1989 (%) - Hispanic or Latino
Year householder moved into unit - Moved in 1980 to 1989 (%) - American Indian and Alaska Native
Year householder moved into unit - Moved in 1980 to 1989 (%) - Multirace
Year householder moved into unit - Moved in 1980 to 1989 (%) - Other Race
Year householder moved into unit - Moved in 1970 to 1979 (%)
Year householder moved into unit - Moved in 1970 to 1979 (%) - White
Year householder moved into unit - Moved in 1970 to 1979 (%) - Black or African American
Year householder moved into unit - Moved in 1970 to 1979 (%) - Asian
Year householder moved into unit - Moved in 1970 to 1979 (%) - Hispanic or Latino
Year householder moved into unit - Moved in 1970 to 1979 (%) - American Indian and Alaska Native
Year householder moved into unit - Moved in 1970 to 1979 (%) - Multirace
Year householder moved into unit - Moved in 1970 to 1979 (%) - Other Race
Year householder moved into unit - Moved in 1969 or earlier (%)
Year householder moved into unit - Moved in 1969 or earlier (%) - White
Year householder moved into unit - Moved in 1969 or earlier (%) - Black or African American
Year householder moved into unit - Moved in 1969 or earlier (%) - Asian
Year householder moved into unit - Moved in 1969 or earlier (%) - Hispanic or Latino
Year householder moved into unit - Moved in 1969 or earlier (%) - American Indian and Alaska Native
Year householder moved into unit - Moved in 1969 or earlier (%) - Multirace
Year householder moved into unit - Moved in 1969 or earlier (%) - Other Race
Housing units lacking complete plumbing facilities (%)
Housing units lacking complete kitchen facilities (%)
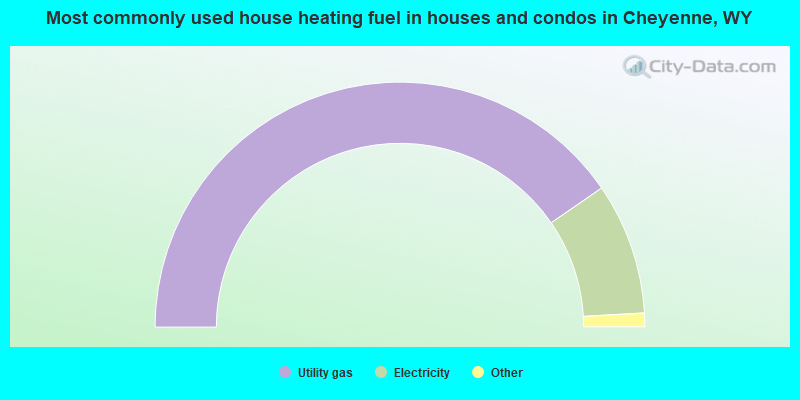
House heating fuel used in houses and condos - Utility gas (%)
House heating fuel used in houses and condos - Bottled, tank, or LP gas (%)
House heating fuel used in houses and condos - Electricity (%)
House heating fuel used in houses and condos - Fuel oil, kerosene, etc. (%)
House heating fuel used in houses and condos - Coal or coke (%)
House heating fuel used in houses and condos - Wood (%)
House heating fuel used in houses and condos - Solar energy (%)
House heating fuel used in houses and condos - Other fuel (%)
House heating fuel used in houses and condos - No fuel used (%)
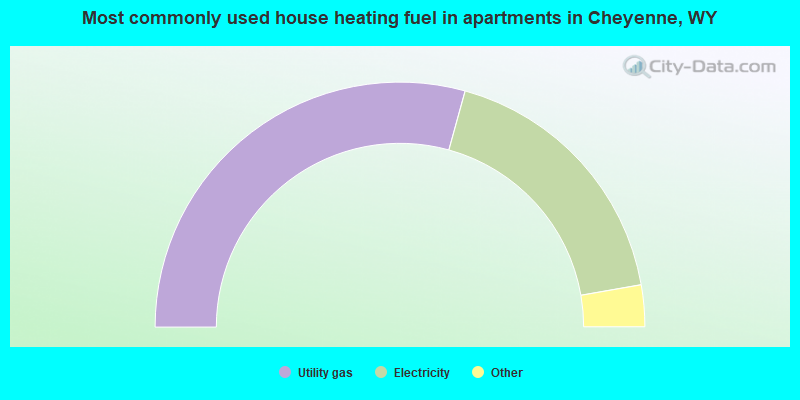
House heating fuel used in apartments - Utility gas (%)
House heating fuel used in apartments - Bottled, tank, or LP gas (%)
House heating fuel used in apartments - Electricity (%)
House heating fuel used in apartments - Fuel oil, kerosene, etc. (%)
House heating fuel used in apartments - Coal or coke (%)
House heating fuel used in apartments - Wood (%)
House heating fuel used in apartments - Solar energy (%)
House heating fuel used in apartments - Other fuel (%)
House heating fuel used in apartments - No fuel used (%)
Latest news about housing in Cheyenne, WY collected exclusively by city-data.com from local newspapers, TV, and radio stations
Median year house/condo built: 1972Median year apartment built: 1986Household type by relationship:
Households: 64,623
Male householders: 14,504 (5,093 living alone ), Female householders: 13,951 (5,278 living alone )12,584 spouses (12,447 opposite-sex spouses ), 2,268 unmarried partners , (2,203 opposite-sex unmarried partners ), 17,910 children (16,092 natural , 365 adopted , 1,453 stepchildren ), 863 grandchildren , 347 brothers or sisters , 335 parents , 28 foster children , 340 other relatives , 876 non-relatives In group quarters: 617
Size of family households: 6,974 2-persons , 4,945 3-persons , 3,665 4-persons , 999 5-persons , 344 6-persons , 303 7-or-more-persons .
Size of nonfamily households: 10,371 1-person , 773 2-persons , 81 3-persons .
8,458 married couples with children. single-parent households (1,901 men , 3,202 women ).
94.0% of residents of Cheyenne speak English at home. of residents speak Spanish at home (77% speak English very well , 11% speak English well , 11% speak English not well , 1% don't speak English at all ).of residents speak other Indo-European language at home (88% speak English very well , 7% speak English well , 5% speak English not well ).of residents speak Asian or Pacific Island language at home (68% speak English very well , 18% speak English well , 14% speak English not well ).of residents speak other language at home (99% speak English very well , 1% speak English well ).
Foreign born population: 1,557 (2.4%)of them are naturalized citizens )
Median number of rooms in houses and condos:
Median number of rooms in apartments
Owner-occupied Renter-occupied
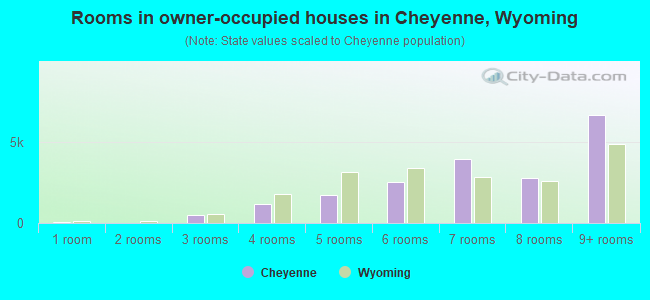
Rooms in owner-occupied houses in Cheyenne, Wyoming
31 1 room 0 2 rooms 491 3 rooms 1,180 4 rooms 1,712 5 rooms 2,557 6 rooms 3,974 7 rooms 2,778 8 rooms 6,659 9+ rooms
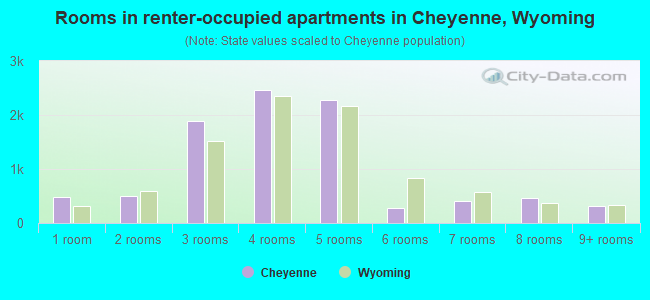
Rooms in renter-occupied apartments in Cheyenne, Wyoming
484 1 room 508 2 rooms 1,883 3 rooms 2,464 4 rooms 2,278 5 rooms 276 6 rooms 401 7 rooms 457 8 rooms 322 9+ rooms
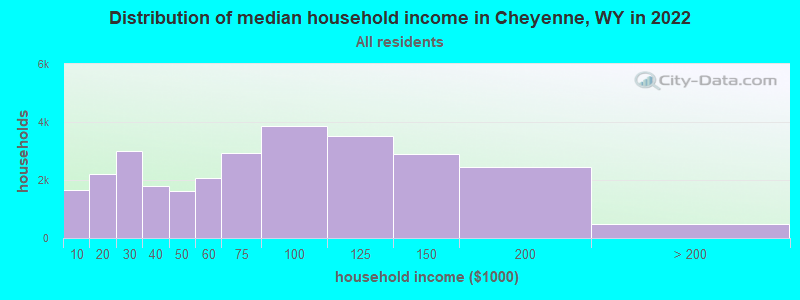
Cheyenne, WY household income distribution 1,667 Less than $10,0002,193 $10,000 to $19,9992,998 $20,000 to $29,9991,781 $30,000 to $39,9991,605 $40,000 to $49,9992,068 $50,000 to $59,9992,938 $60,000 to $74,9993,856 $75,000 to $99,9993,527 $100,000 to $124,9992,889 $125,000 to $149,9992,440 $150,000 to $199,999493 $200,000 or more
Home value of owner - occupied houses in 2022 in Cheyenne, WY 123 Less than $10,000177 $10,000 to $14,99965 $15,000 to $19,99916 $20,000 to $24,999167 $25,000 to $29,999105 $30,000 to $34,99911 $35,000 to $39,9995 $40,000 to $49,999271 $50,000 to $59,999155 $60,000 to $69,99978 $80,000 to $89,999117 $90,000 to $99,999255 $100,000 to $124,999463 $125,000 to $149,999505 $150,000 to $174,999974 $175,000 to $199,9992,271 $200,000 to $249,9993,087 $250,000 to $299,9996,460 $300,000 to $399,9992,126 $400,000 to $499,9991,357 $500,000 to $749,999400 $750,000 to $999,999188 $1,000,000 to $1,499,99940 $1,500,000 to $1,999,999130 $2,000,000 or moreRent paid by renters in 2022 in Cheyenne, WY 63 Less than $10014 $100 to $149159 $150 to $199197 $200 to $249192 $250 to $299145 $300 to $34995 $350 to $399102 $400 to $44977 $450 to $499162 $500 to $549192 $550 to $599521 $600 to $649335 $650 to $699758 $700 to $749659 $750 to $799981 $800 to $899595 $900 to $9991,412 $1,000 to $1,249731 $1,250 to $1,499742 $1,500 to $1,99993 $2,000 to $2,49935 $2,500 to $2,99911 $3,000 to $3,49935 $3,500 or more375 No cash rent
Percentage of workers working in this county: 97.1%Number of people working at home: 2,759 (8.1% of all workers )
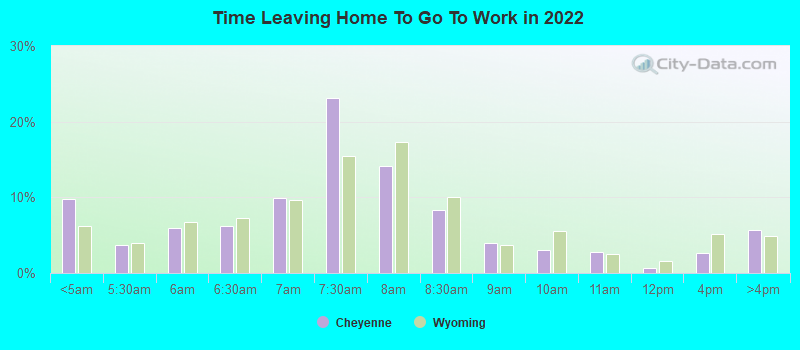
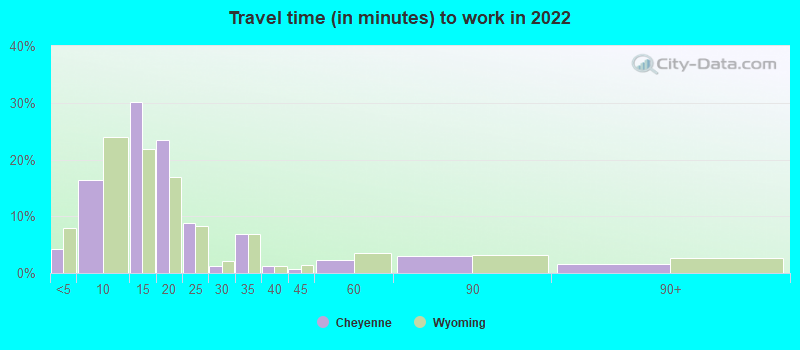
Travel time to work (commute)
Less than 5 minutes: 1,2565 to 9 minutes: 7,02710 to 14 minutes: 10,04115 to 19 minutes: 8,58620 to 24 minutes: 2,57425 to 29 minutes: 9630 to 34 minutes: 1,18735 to 39 minutes: 040 to 44 minutes: 4445 to 59 minutes: 77060 to 89 minutes: 55390 or more minutes: 53
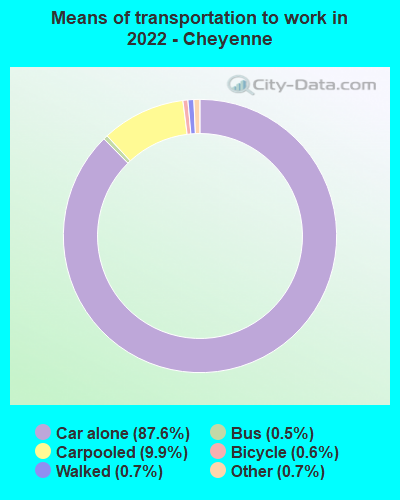
Means of transportation to work:
Drove a car alone: 31,194 (81.9%)Carpooled: 3,018 (7.9%)Bus : 163 (0.4%)Taxi: 328 (0.9%)Bicycle: 233 (0.6%)Walked: 260 (0.7%)Worked at home: 2,759 (7.2%)
Unemployment by race in 2022
Unemployment rate for White non-Hispanic residents 5.2% Males2.4% FemalesUnemployment rate for American Indian and Alaska Native residents 0.8% MalesUnemployment rate for Asian residents 5.3% FemalesUnemployment rate for other race residents 8.9% MalesUnemployment rate for two or more race residents 3.1% Males6.6% FemalesUnemployment rate for Hispanic or Latino residents 5.3% Males2.6% Females
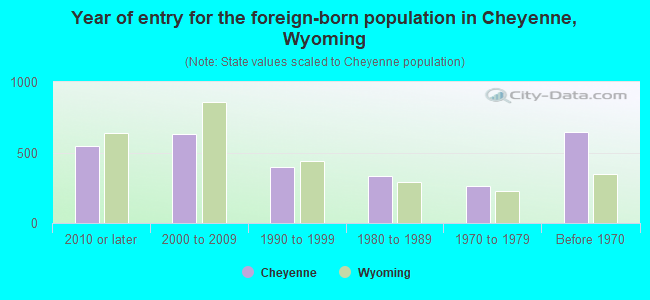
Year of entry for the foreign-born population in Cheyenne, Wyoming
545 2010 or later 630 2000 to 2009 399 1990 to 1999 330 1980 to 1989 262 1970 to 1979 645 Before 1970
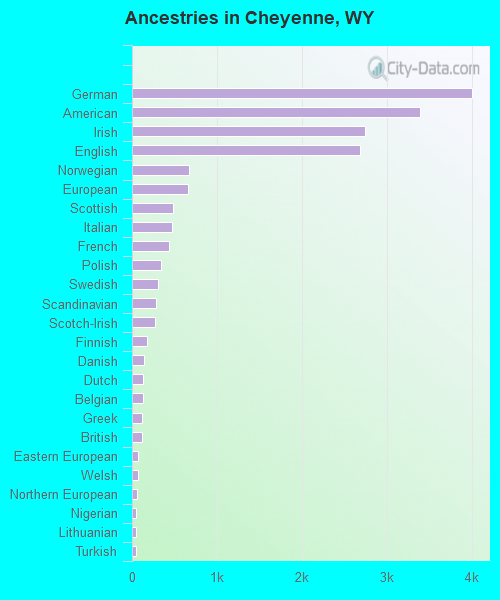
First ancestries reported:
German: 4,002 (14.7%)
American: 3,394 (12.5%)
Irish: 2,739 (10.1%)
English: 2,683 (9.9%)
Norwegian: 673 (2.5%)
European: 664 (2.4%)
Scottish: 485 (1.8%)
Italian: 468 (1.7%)
French: 439 (1.6%)
Polish: 343 (1.3%)
Swedish: 306 (1.1%)
Scandinavian: 286 (1.1%)
Scotch-Irish: 269 (1.0%)
Finnish: 178 (0.7%)
Danish: 136 (0.5%)
Dutch: 132 (0.5%)
Belgian: 124 (0.5%)
Greek: 123 (0.5%)
British: 115 (0.4%)
Eastern European: 68 (0.3%)
Welsh: 67 (0.2%)
Northern European: 60 (0.2%)
Nigerian: 52 (0.2%)
Lithuanian: 52 (0.2%)
Turkish: 49 (0.2%)
Czech: 47 (0.2%)
African: 47 (0.2%)
French Canadian: 41 (0.2%)
Barbadian: 38 (0.1%)
Ghanaian: 37 (0.1%)
Czechoslovakian: 32 (0.1%)
Somali: 25 (0.09%)
Bahamian: 21 (0.08%)
Portuguese: 20 (0.07%)
Russian: 19 (0.07%)
Pennsylvania German: 17 (0.06%)
Romanian: 16 (0.06%)
Slavic: 14 (0.05%)
Iranian: 14 (0.05%)
New Zealander: 13 (0.05%)
Hungarian: 11 (0.04%)
Haitian: 10 (0.04%)
German Russian: 9 (0.03%)
Trinidadian and Tobagonian: 9 (0.03%)
Swiss: 7 (0.03%)
Croatian: 6 (0.02%)
Ukrainian: 2 (0.01%)
Most common places of birth for foreign-born residents (%): Mexico Cheyenne:
22.7% (471)Wyoming:
42.9% (8,470)
Venezuela Cheyenne:
7.7% (160)Wyoming:
1.5% (303)
Philippines Cheyenne:
7.6% (158)Wyoming:
3.6% (712)
Canada Cheyenne:
7.1% (148)Wyoming:
5.8% (1,139)
Germany Cheyenne:
5.3% (110)Wyoming:
3.5% (696)
Korea Cheyenne:
4.2% (88)Wyoming:
1.5% (290)
Chile Cheyenne:
3.2% (66)Wyoming:
0.5% (103)
China, excluding Hong Kong and Taiwan Cheyenne:
3.1% (64)Wyoming:
4.3% (844)
England Cheyenne:
3.0% (63)Wyoming:
2.6% (514)
Uganda Cheyenne:
2.8% (58)Wyoming:
0.6% (114)
Turkey Cheyenne:
2.4% (49)Wyoming:
0.4% (72)
Nigeria Cheyenne:
2.3% (48)Wyoming:
0.7% (132)
India Cheyenne:
2.3% (47)Wyoming:
2.2% (431)
Burma (Myanmar) Cheyenne:
2.3% (47)Wyoming:
0.2% (47)
Nepal Cheyenne:
1.7% (35)Wyoming:
0.5% (96)
Taiwan Cheyenne:
1.6% (33)Wyoming:
0.4% (84)
Peru Cheyenne:
1.5% (32)Wyoming:
1.7% (331)
Poland Cheyenne:
1.5% (32)Wyoming:
0.7% (141)
Place of birth for U.S.-born residents:
This state: 28,771Other state: 33,221Northeast: 2,663Midwest: 9,656South: 7,257West: 13,645 82.3% of Cheyenne residents lived in the same house 1 years ago.
Out of people who lived in different houses, 33.6% lived in this county.
Out of people who lived in different counties, 16.1% lived in Wyoming.
Cheyenne:
82.3%State average:
84.7%
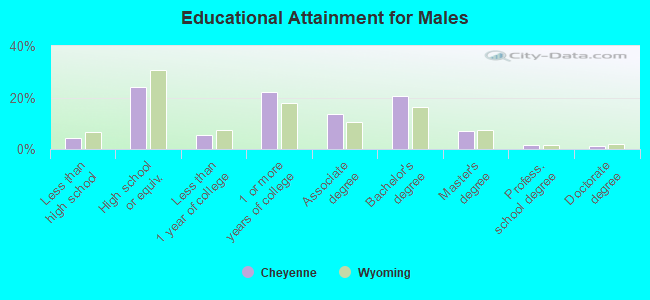
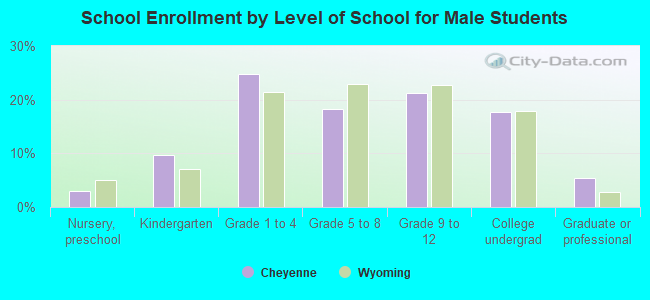
Education attainment for males 25 years and older:
No schooling: 0Nursery to 4th grade: 05th and 6th grade: 1417th and 8th grade: 2429th grade: 6910th grade: 5111th grade: 15812th grade, no diploma: 266High school graduate (or equivalency): 5,491Less than 1 year of college: 1,266Some college more than 1 year, no degree: 4,978Associate degree: 3,103Bachelor's degree: 4,626Master's degree: 1,611Professional school degree: 383Doctorate degree: 247
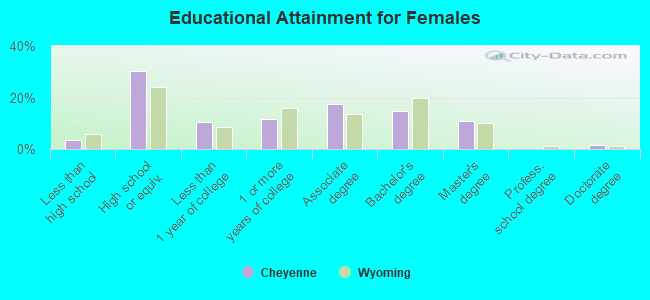
Education attainment for females 25 years and older:
No schooling: 0Nursery to 4th grade: 05th and 6th grade: 697th and 8th grade: 09th grade: 28010th grade: 011th grade: 28112th grade, no diploma: 136High school graduate (or equivalency): 6,479Less than 1 year of college: 2,214Some college more than 1 year, no degree: 2,487Associate degree: 3,714Bachelor's degree: 3,168Master's degree: 2,307Professional school degree: 0Doctorate degree: 297
Housing units in structures:
One, detached: 20,545One, attached: 2,185Two: 8693 or 4: 2,6615 to 9: 1,17510 to 19: 1,27820 to 49: 48850 or more: 797Mobile homes: 630Housing units lacking complete plumbing facilities in 2022: 0.6%Housing units lacking complete kitchen facilities in 2022: 2.0%House/condo owner moved in on average 8 years ago
Renter moved in on average 2 years ago
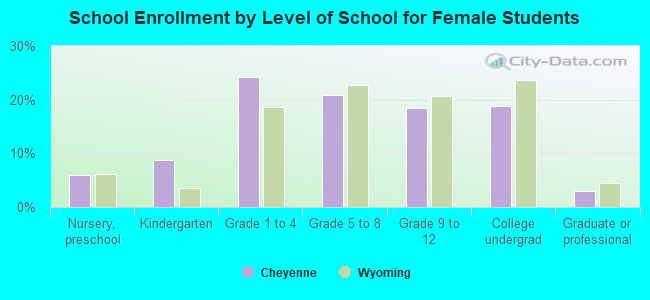
Private vs. public school enrollment:
Students in private schools in grades 1 to 8 (elementary and middle school): 543 Students in private schools in grades 9 to 12 (high school): 508 Students in private undergraduate colleges: 304