Chesapeake, VA (Virginia) Houses and Residents
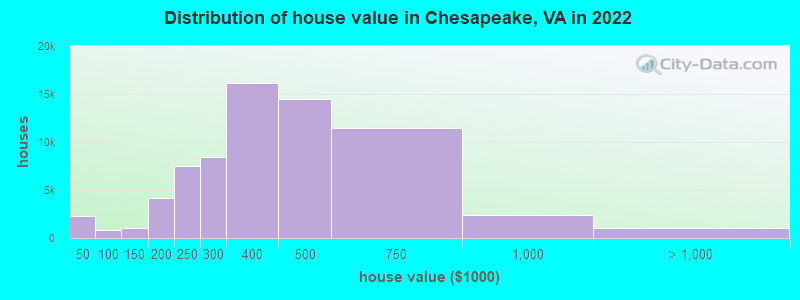
Estimated median house or condo value in 2022: $365,700 (it was $119,700 in 2000 )
Chesapeake:
$365,700Virginia:
$365,700
Lower value quartile - upper value quartile: $259,500 - $482,100Mean price in 2022: Detached houses: $414,973 Here:
$414,973State:
$472,865
Townhouses or other attached units: $288,941 Here:
$288,941State:
$457,437
In 2-unit structures: $457,843 Here:
$457,843State:
$396,289
In 3-to-4-unit structures: $297,809 Here:
$297,809State:
$252,346
In 5-or-more-unit structures: $185,831 Here:
$185,831State:
$382,551
Mobile homes: $63,884 Here:
$63,884State:
$100,736
Total population: 233,371 (Urban population: 179,359, Rural population: 19,825 (529 farm, 19,296 nonfarm ))
Houses: 97,286 (95,073 occupied: 69,722 owner occupied, 25,351 renter occupied )
% of renters here:
27%State:
33%
Housing density: 286 houses/condos per square mile
Median price asked for vacant for-sale houses and condos in 2022: $364,435.
Median contract rent in 2022: $1,219 (lower quartile is $961, upper quartile is $1,557)
Median rent asked for vacant for-rent units in 2022: $565
Median gross rent in Chesapeake, VA in 2022: $1,436
Housing units in Chesapeake with a mortgage: 52,383 (5,467 second mortgage, 64 home equity loan, 4,179 both second mortgage and home equity loan )Houses without a mortgage: 1,421
Median household income for houses/condos with a mortgage: $109,434
Median household income for apartments without a mortgage: $77,795
Median monthly housing costs: $1,575
Data:
Median house or condo value ($)
Median house or condo value ($ change since 2000)
Median house or condo value ($) - White
Median house or condo value ($) - Black or African American
Median house or condo value ($) - Asian
Median house or condo value ($) - Hispanic or Latino
Median house or condo value ($) - American Indian and Alaska Native
Median house or condo value ($) - Multirace
Median house or condo value ($) - Other Race
Median price asked for mobile homes ($)
Household density (households per square mile)
Mean house or condo value by units in structure - 1, detached ($)
Mean house or condo value by units in structure - 1, attached ($)
Mean house or condo value by units in structure - 2 ($)
Mean house or condo value by units in structure by units in structure - 3 or 4 ($)
Mean house or condo value by units in structure - 5 or more ($)
Mean house or condo value by units in structure - Boat, RV, van, etc. ($)
Mean house or condo value by units in structure - Mobile home ($)
Median contract rent ($)
Median contract rent - Lower quartile ($)
Median contract rent - Upper quartile ($)
Median gross rent ($)
Urban houses (%)
Rural houses (%)
Houses occupied (%)
Houses occupied (% change since 2000)
Houses owner occupied (%)
Houses owner occupied (% change since 2000)
Houses renter occupied (%)
Houses renter occupied (% change since 2000)
Vacant housing units - For rent (%)
Vacant housing units - For rent (% change since 2000)
Vacant housing units - For sale only (%)
Vacant housing units - For sale only (% change since 2000)
Vacant housing units - Rented or sold, not occupied (%)
Vacant housing units - Rented or sold, not occupied (% change since 2000)
Vacant housing units - For seasonal, recreational, or occasional use (%)
Vacant housing units - For seasonal, recreational, or occasional use (% change since 2000)
Vacant housing units - For migrant workers (%)
Vacant housing units - For migrant workers (% change since 2000)
Vacant housing units - Other vacant (%)
Vacant housing units - Other vacant (% change since 2000)
Median monthly housing costs ($)
Median household income for houses/condos with a mortgage ($)
Median household income for houses/condos without a mortgage ($)
Median household income ($)
Median household income ($) - White
Median household income ($) - Black or African American
Median household income ($) - Asian
Median household income ($) - Hispanic or Latino
Median household income ($) - American Indian and Alaska Native
Median household income ($) - Multirace
Median household income ($) - Other Race
Mortgage status - with mortgage (%)
Mortgage status - with second mortgage (%)
Mortgage status - with home equity loan (%)
Mortgage status - with both second mortgage and home equity loan (%)
Mortgage status - without a mortgage (%)
Median year house/condo built
Median year apartment built
Household type by relationship - Male householder living alone (%)
Household type by relationship - Male householder not living alone (%)
Household type by relationship - Female householder living alone (%)
Household type by relationship - Female householder not living alone (%)
Household type by relationship - Opposite-Sex spouse (%)
Household type by relationship - Same-Sex spouse (%)
Household type by relationship - Opposite-Sex unmarried partner (%)
Household type by relationship - Same-Sex unmarried partner (%)
Household type by relationship - In group quarters (%)
Size of family households - 2-person household (%)
Size of family households - 3-person household (%)
Size of family households - 4-person household (%)
Size of family households - 5-person household (%)
Size of family households - 6-person household (%)
Size of family households - 7-or-more-person household (%)
Size of nonfamily households - 1-person household (%)
Size of nonfamily households - 2-person household (%)
Size of nonfamily households - 3-person household (%)
Size of nonfamily households - 4-person household (%)
Size of nonfamily households - 5-person household (%)
Size of nonfamily households - 6-person household (%)
Size of nonfamily households - 7-or-moreperson household (%)
Year house built - Built 2010 or later (%)
Year house built - Built 2000 to 2009 (%)
Year house built - Built 1990 to 1999 (%)
Year house built - Built 1980 to 1989 (%)
Year house built - Built 1970 to 1979 (%)
Year house built - Built 1960 to 1969 (%)
Year house built - Built 1950 to 1959 (%)
Year house built - Built 1940 to 1949 (%)
Year house built - Built 1939 or earlier (%)
Median number of rooms in houses and condos
Median number of rooms in apartments
Median number of bedrooms in owner occupied houses
Mean number of bedrooms in owner occupied houses
Median number of bedrooms in renter occupied houses
Mean number of bedrooms in renter occupied houses
Median number of vehichles in owner occupied houses
Mean number of vehichles in owner occupied houses
Median number of vehichles in renter occupied houses
Mean number of vehichles in renter occupied houses
Rooms in owner-occupied houses - 1 room (%)
Rooms in owner-occupied houses - 2 rooms (%)
Rooms in owner-occupied houses - 3 rooms (%)
Rooms in owner-occupied houses - 4 rooms (%)
Rooms in owner-occupied houses - 5 rooms (%)
Rooms in owner-occupied houses - 6 rooms (%)
Rooms in owner-occupied houses - 7 rooms (%)
Rooms in owner-occupied houses - 8 rooms (%)
Rooms in owner-occupied houses - 9+ rooms (%)
Rooms in renter-occupied houses - 1 room (%)
Rooms in renter-occupied houses - 2 rooms (%)
Rooms in renter-occupied houses - 3 rooms (%)
Rooms in renter-occupied houses - 4 rooms (%)
Rooms in renter-occupied houses - 5 rooms (%)
Rooms in renter-occupied houses - 6 rooms (%)
Rooms in renter-occupied houses - 7 rooms (%)
Rooms in renter-occupied houses - 8 rooms (%)
Rooms in renter-occupied houses - 9+ rooms (%)
Bedrooms in owner-occupied houses - no bedrooms (%)
Bedrooms in owner-occupied houses - 1 bedroom (%)
Bedrooms in owner-occupied houses - 2 bedrooms (%)
Bedrooms in owner-occupied houses - 3 bedrooms (%)
Bedrooms in owner-occupied houses - 4 bedrooms (%)
Bedrooms in owner-occupied houses - 5+ bedrooms (%)
Bedrooms in renter-occupied houses - no bedrooms (%)
Bedrooms in renter-occupied houses - 1 bedroom (%)
Bedrooms in renter-occupied houses - 2 bedrooms (%)
Bedrooms in renter-occupied houses - 3 bedrooms (%)
Bedrooms in renter-occupied houses - 4 bedrooms (%)
Bedrooms in renter-occupied houses - 5+ bedrooms (%)
Vehicles available in owner-occupied houses - no vehicle available (%)
Vehicles available in owner-occupied houses - 1 vehicle available(%)
Vehicles available in owner-occupied houses - 2 Vehicles available (%)
Vehicles available in owner-occupied houses - 3 Vehicles available (%)
Vehicles available in owner-occupied houses - 4 Vehicles available (%)
Vehicles available in owner-occupied houses - 5+ Vehicles available (%)
Vehicles available in renter-occupied houses - no vehicle available (%)
Vehicles available in renter-occupied houses - 1 vehicle available (%)
Vehicles available in renter-occupied houses - 2 Vehicles available (%)
Vehicles available in renter-occupied houses - 3 Vehicles available (%)
Vehicles available in renter-occupied houses - 4 Vehicles available (%)
Vehicles available in renter-occupied houses - 5+ Vehicles available (%)
Housing units in structures - 1, detached (%)
Housing units in structures - 1, attached (%)
Housing units in structures - 2 (%)
Housing units in structures - 3 or 4 (%)
Housing units in structures - 5 to 9 (%)
Housing units in structures - 10 to 19 (%)
Housing units in structures - 20 to 49 (%)
Housing units in structures - 50 or more (%)
Housing units in structures - Mobile home (%)
Housing units in structures - Boat, RV, van, etc. (%)
Housing units in structures - Owners - 1, detached (%)
Housing units in structures - Owners - 1, attached (%)
Housing units in structures - Owners - 2 (%)
Housing units in structures - Owners - 3 or 4 (%)
Housing units in structures - Owners - 5 to 9 (%)
Housing units in structures - Owners - 10 to 19 (%)
Housing units in structures - Owners - 20 to 49 (%)
Housing units in structures - Owners - 50 or more (%)
Housing units in structures - Owners - Mobile home (%)
Housing units in structures - Owners - Boat, RV, van, etc. (%)
Housing units in structures - Renters - 1, detached (%)
Housing units in structures - Renters - 1, attached (%)
Housing units in structures - Renters - 2 (%)
Housing units in structures - Renters - 3 or 4 (%)
Housing units in structures - Renters - 5 to 9 (%)
Housing units in structures - Renters - 10 to 19 (%)
Housing units in structures - Renters - 20 to 49 (%)
Housing units in structures - Renters - 50 or more (%)
Housing units in structures - Renters - Mobile home (%)
Housing units in structures - Renters - Boat, RV, van, etc. (%)
House/condo owner moved in on average (years ago)
Renter moved in on average (years ago)
Year householder moved into unit - Moved in 1999 to March 2000 (%)
Year householder moved into unit - Moved in 1999 to March 2000 (%) - White
Year householder moved into unit - Moved in 1999 to March 2000 (%) - Black or African American
Year householder moved into unit - Moved in 1999 to March 2000 (%) - Asian
Year householder moved into unit - Moved in 1999 to March 2000 (%) - Hispanic or Latino
Year householder moved into unit - Moved in 1999 to March 2000 (%) - American Indian and Alaska Native
Year householder moved into unit - Moved in 1999 to March 2000 (%) - Multirace
Year householder moved into unit - Moved in 1999 to March 2000 (%) - Other Race
Year householder moved into unit - Moved in 1995 to 1998 (%)
Year householder moved into unit - Moved in 1995 to 1998 (%) - White
Year householder moved into unit - Moved in 1995 to 1998 (%) - Black or African American
Year householder moved into unit - Moved in 1995 to 1998 (%) - Asian
Year householder moved into unit - Moved in 1995 to 1998 (%) - Hispanic or Latino
Year householder moved into unit - Moved in 1995 to 1998 (%) - American Indian and Alaska Native
Year householder moved into unit - Moved in 1995 to 1998 (%) - Multirace
Year householder moved into unit - Moved in 1995 to 1998 (%) - Other Race
Year householder moved into unit - Moved in 1990 to 1994 (%)
Year householder moved into unit - Moved in 1990 to 1994 (%) - White
Year householder moved into unit - Moved in 1990 to 1994 (%) - Black or African American
Year householder moved into unit - Moved in 1990 to 1994 (%) - Asian
Year householder moved into unit - Moved in 1990 to 1994 (%) - Hispanic or Latino
Year householder moved into unit - Moved in 1990 to 1994 (%) - American Indian and Alaska Native
Year householder moved into unit - Moved in 1990 to 1994 (%) - Multirace
Year householder moved into unit - Moved in 1990 to 1994 (%) - Other Race
Year householder moved into unit - Moved in 1980 to 1989 (%)
Year householder moved into unit - Moved in 1980 to 1989 (%) - White
Year householder moved into unit - Moved in 1980 to 1989 (%) - Black or African American
Year householder moved into unit - Moved in 1980 to 1989 (%) - Asian
Year householder moved into unit - Moved in 1980 to 1989 (%) - Hispanic or Latino
Year householder moved into unit - Moved in 1980 to 1989 (%) - American Indian and Alaska Native
Year householder moved into unit - Moved in 1980 to 1989 (%) - Multirace
Year householder moved into unit - Moved in 1980 to 1989 (%) - Other Race
Year householder moved into unit - Moved in 1970 to 1979 (%)
Year householder moved into unit - Moved in 1970 to 1979 (%) - White
Year householder moved into unit - Moved in 1970 to 1979 (%) - Black or African American
Year householder moved into unit - Moved in 1970 to 1979 (%) - Asian
Year householder moved into unit - Moved in 1970 to 1979 (%) - Hispanic or Latino
Year householder moved into unit - Moved in 1970 to 1979 (%) - American Indian and Alaska Native
Year householder moved into unit - Moved in 1970 to 1979 (%) - Multirace
Year householder moved into unit - Moved in 1970 to 1979 (%) - Other Race
Year householder moved into unit - Moved in 1969 or earlier (%)
Year householder moved into unit - Moved in 1969 or earlier (%) - White
Year householder moved into unit - Moved in 1969 or earlier (%) - Black or African American
Year householder moved into unit - Moved in 1969 or earlier (%) - Asian
Year householder moved into unit - Moved in 1969 or earlier (%) - Hispanic or Latino
Year householder moved into unit - Moved in 1969 or earlier (%) - American Indian and Alaska Native
Year householder moved into unit - Moved in 1969 or earlier (%) - Multirace
Year householder moved into unit - Moved in 1969 or earlier (%) - Other Race
Housing units lacking complete plumbing facilities (%)
Housing units lacking complete kitchen facilities (%)
House heating fuel used in houses and condos - Utility gas (%)
House heating fuel used in houses and condos - Bottled, tank, or LP gas (%)
House heating fuel used in houses and condos - Electricity (%)
House heating fuel used in houses and condos - Fuel oil, kerosene, etc. (%)
House heating fuel used in houses and condos - Coal or coke (%)
House heating fuel used in houses and condos - Wood (%)
House heating fuel used in houses and condos - Solar energy (%)
House heating fuel used in houses and condos - Other fuel (%)
House heating fuel used in houses and condos - No fuel used (%)
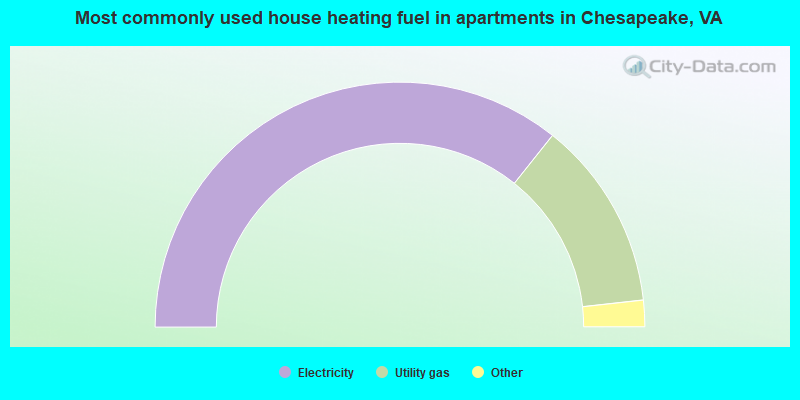
House heating fuel used in apartments - Utility gas (%)
House heating fuel used in apartments - Bottled, tank, or LP gas (%)
House heating fuel used in apartments - Electricity (%)
House heating fuel used in apartments - Fuel oil, kerosene, etc. (%)
House heating fuel used in apartments - Coal or coke (%)
House heating fuel used in apartments - Wood (%)
House heating fuel used in apartments - Solar energy (%)
House heating fuel used in apartments - Other fuel (%)
House heating fuel used in apartments - No fuel used (%)
Latest news about housing in Chesapeake, VA collected exclusively by city-data.com from local newspapers, TV, and radio stations
Median year house/condo built: 1990Median year apartment built: 1992Household type by relationship:
Households: 252,488
Male householders: 44,278 (10,947 living alone ), Female householders: 50,795 (14,381 living alone )49,708 spouses (48,999 opposite-sex spouses ), 3,902 unmarried partners , (3,624 opposite-sex unmarried partners ), 79,954 children (74,656 natural , 1,535 adopted , 3,763 stepchildren ), 7,716 grandchildren , 1,941 brothers or sisters , 2,902 parents , 386 foster children , 2,873 other relatives , 3,947 non-relatives In group quarters: 4,086
Size of family households: 28,115 2-persons , 16,066 3-persons , 13,523 4-persons , 4,464 5-persons , 2,750 6-persons , 1,316 7-or-more-persons .
Size of nonfamily households: 25,328 1-person , 3,090 2-persons , 329 3-persons , 92 6-persons .
37,676 married couples with children. single-parent households (2,240 men , 13,943 women ).
91.0% of residents of Chesapeake speak English at home. of residents speak Spanish at home (64% speak English very well , 15% speak English well , 15% speak English not well , 6% don't speak English at all ).of residents speak other Indo-European language at home (70% speak English very well , 16% speak English well , 11% speak English not well , 3% don't speak English at all ).of residents speak Asian or Pacific Island language at home (59% speak English very well , 27% speak English well , 13% speak English not well , 2% don't speak English at all ).of residents speak other language at home (87% speak English very well , 7% speak English well , 6% speak English not well ).
Foreign born population: 12,536 (5.0%)of them are naturalized citizens )
Median number of rooms in houses and condos:
Median number of rooms in apartments
Owner-occupied Renter-occupied
Bedrooms in owner-occupied houses and condos in Chesapeake, Virginia
143 no bedroom 143 1 bedroom 8,031 2 bedrooms 29,808 3 bedrooms 21,724 4 bedrooms 9,873 5+ bedrooms
Bedrooms in renter-occupied apartments in Chesapeake, Virginia
753 no bedroom 3,570 1 bedroom 11,772 2 bedrooms 6,576 3 bedrooms 1,762 4 bedrooms 918 5+ bedrooms
Owner-occupied Renter-occupied
Cars and other vehicles available in Chesapeake in owner-occupied houses/condos
1,776 no vehicle 15,781 1 vehicle 30,660 2 vehicles 14,560 3 vehicles 4,399 4 vehicles 2,546 5+ vehicles
Cars and other vehicles available in Chesapeake in renter-occupied apartments
2,556 no vehicle 13,216 1 vehicle 7,331 2 vehicles 1,956 3 vehicles 63 4 vehicles 229 5+ vehicles
Owner-occupied Renter-occupied
Rooms in owner-occupied houses in Chesapeake, Virginia
143 1 room 0 2 rooms 746 3 rooms 3,877 4 rooms 9,380 5 rooms 9,978 6 rooms 14,724 7 rooms 13,428 8 rooms 17,446 9+ rooms
Rooms in renter-occupied apartments in Chesapeake, Virginia
753 1 room 799 2 rooms 3,246 3 rooms 6,809 4 rooms 5,875 5 rooms 3,523 6 rooms 1,807 7 rooms 1,811 8 rooms 728 9+ rooms
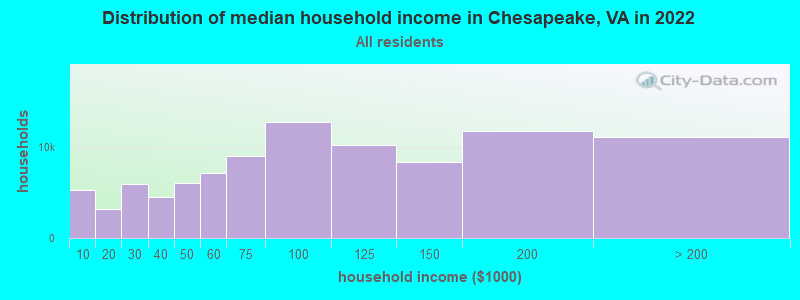
Chesapeake, VA household income distribution 5,218 Less than $10,0003,218 $10,000 to $19,9995,932 $20,000 to $29,9994,539 $30,000 to $39,9996,074 $40,000 to $49,9997,074 $50,000 to $59,9998,974 $60,000 to $74,99912,711 $75,000 to $99,99910,165 $100,000 to $124,9998,357 $125,000 to $149,99911,759 $150,000 to $199,99911,052 $200,000 or more
Home value of owner - occupied houses in 2022 in Chesapeake, VA 1,412 Less than $10,000182 $15,000 to $19,999103 $20,000 to $24,999244 $25,000 to $29,99922 $30,000 to $34,999312 $35,000 to $39,99948 $40,000 to $49,999221 $50,000 to $59,999411 $80,000 to $89,999166 $90,000 to $99,999510 $100,000 to $124,999517 $125,000 to $149,9992,158 $150,000 to $174,9992,021 $175,000 to $199,9997,511 $200,000 to $249,9998,399 $250,000 to $299,99916,162 $300,000 to $399,99914,485 $400,000 to $499,99911,453 $500,000 to $749,9992,363 $750,000 to $999,999735 $1,000,000 to $1,499,999287 $2,000,000 or moreRent paid by renters in 2022 in Chesapeake, VA 189 Less than $100108 $100 to $149195 $150 to $199246 $200 to $2491 $250 to $299169 $300 to $349191 $350 to $39951 $400 to $449217 $450 to $49988 $500 to $549151 $550 to $599202 $600 to $649150 $650 to $699470 $700 to $749260 $750 to $7991,776 $800 to $8992,103 $900 to $9995,253 $1,000 to $1,2495,246 $1,250 to $1,4994,468 $1,500 to $1,9991,499 $2,000 to $2,499461 $2,500 to $2,999147 $3,000 to $3,49933 $3,500 or more750 No cash rent
Percentage of workers working in this county: 45.8%Number of people working at home: 16,045 (12.8% of all workers )
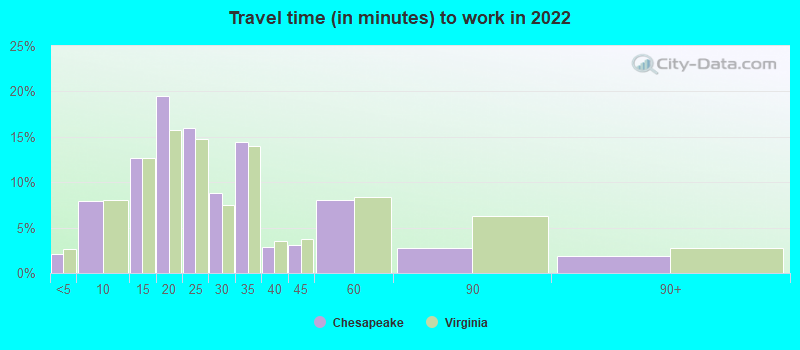
Travel time to work (commute)
Less than 5 minutes: 1,4445 to 9 minutes: 8,27810 to 14 minutes: 12,01015 to 19 minutes: 19,01120 to 24 minutes: 21,39225 to 29 minutes: 10,17530 to 34 minutes: 17,10035 to 39 minutes: 4,97740 to 44 minutes: 4,63745 to 59 minutes: 10,02060 to 89 minutes: 2,64690 or more minutes: 1,611
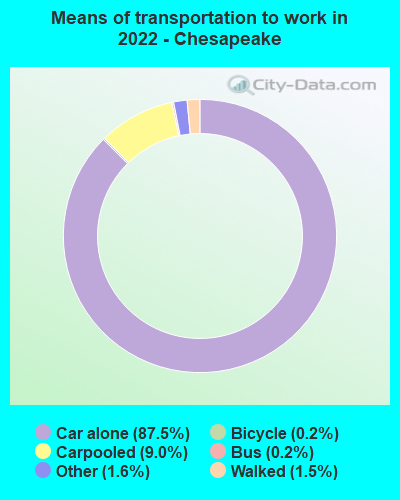
Means of transportation to work:
Drove a car alone: 77,154 (73.5%)Carpooled: 8,018 (7.6%)Bus : 152 (0.1%)Light rail, streetcar or trolley : 4 (0.0%)Ferryboat: 10 (0.0%)Taxi: 1,743 (1.7%)Bicycle: 147 (0.1%)Walked: 1,389 (1.3%)Worked at home: 16,045 (15.3%)
Unemployment by race in 2022
Unemployment rate for White non-Hispanic residents 4.3% Males2.4% FemalesUnemployment rate for Black residents 8.8% Males3.7% FemalesUnemployment rate for Asian residents 1.0% Males1.9% FemalesUnemployment rate for other race residents 7.0% FemalesUnemployment rate for two or more race residents 1.2% Males10.8% FemalesUnemployment rate for Hispanic or Latino residents 18.3% Females
Year of entry for the foreign-born population in Chesapeake, Virginia
5,335 2010 or later 3,837 2000 to 2009 2,236 1990 to 1999 1,776 1980 to 1989 1,115 1970 to 1979 1,325 Before 1970
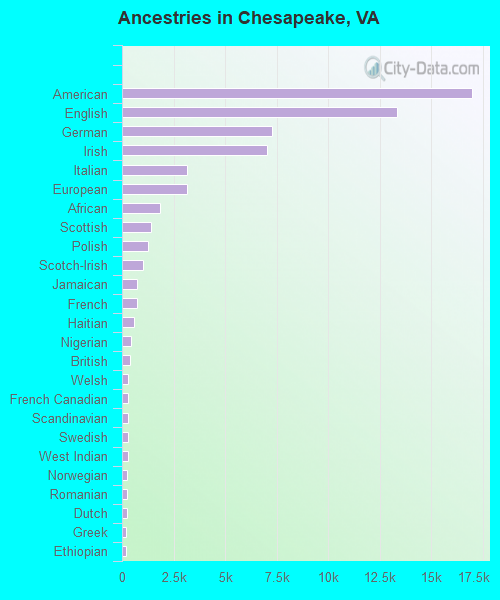
First ancestries reported:
American: 16,947 (13.2%)
English: 13,347 (10.4%)
German: 7,282 (5.7%)
Irish: 7,017 (5.4%)
Italian: 3,143 (2.4%)
European: 3,140 (2.4%)
African: 1,829 (1.4%)
Scottish: 1,416 (1.1%)
Polish: 1,243 (1.0%)
Scotch-Irish: 1,001 (0.8%)
Jamaican: 727 (0.6%)
French: 720 (0.6%)
Haitian: 563 (0.4%)
Nigerian: 424 (0.3%)
British: 398 (0.3%)
Welsh: 296 (0.2%)
French Canadian: 292 (0.2%)
Scandinavian: 291 (0.2%)
Swedish: 273 (0.2%)
West Indian: 267 (0.2%)
Norwegian: 265 (0.2%)
Romanian: 250 (0.2%)
Dutch: 247 (0.2%)
Greek: 216 (0.2%)
Ethiopian: 186 (0.1%)
South African: 160 (0.1%)
Kenyan: 151 (0.1%)
Russian: 142 (0.1%)
Lithuanian: 137 (0.1%)
Portuguese: 132 (0.1%)
Northern European: 130 (0.1%)
Eastern European: 125 (0.10%)
Trinidadian and Tobagonian: 124 (0.10%)
Afghan: 118 (0.09%)
Turkish: 112 (0.09%)
Danish: 107 (0.08%)
Canadian: 105 (0.08%)
Hungarian: 96 (0.07%)
Barbadian: 94 (0.07%)
Ghanaian: 87 (0.07%)
Swiss: 85 (0.07%)
Slovak: 85 (0.07%)
Egyptian: 80 (0.06%)
Lebanese: 77 (0.06%)
Cape Verdean: 76 (0.06%)
Ukrainian: 75 (0.06%)
Czech: 69 (0.05%)
Brazilian: 63 (0.05%)
Iraqi: 57 (0.04%)
Albanian: 54 (0.04%)
Guyanese: 53 (0.04%)
Austrian: 43 (0.03%)
Czechoslovakian: 41 (0.03%)
Zimbabwean: 37 (0.03%)
Bermudan: 36 (0.03%)
Armenian: 30 (0.02%)
Iranian: 23 (0.02%)
Cajun: 22 (0.02%)
Moroccan: 21 (0.02%)
Croatian: 19 (0.01%)
Finnish: 18 (0.01%)
Slavic: 12 (0.01%)
Yugoslavian: 9 (0.01%)
Most common places of birth for foreign-born residents (%): Philippines Chesapeake:
12.7% (1,938)Virginia:
4.8% (52,629)
Korea Chesapeake:
6.0% (909)Virginia:
4.9% (52,857)
India Chesapeake:
4.9% (746)Virginia:
9.0% (97,830)
Vietnam Chesapeake:
4.3% (660)Virginia:
4.2% (45,750)
Haiti Chesapeake:
4.3% (656)Virginia:
0.4% (4,246)
Guatemala Chesapeake:
4.0% (611)Virginia:
3.3% (35,938)
Mexico Chesapeake:
3.9% (587)Virginia:
5.3% (57,498)
Jamaica Chesapeake:
3.5% (530)Virginia:
1.0% (10,734)
China, excluding Hong Kong and Taiwan Chesapeake:
3.1% (478)Virginia:
3.9% (42,989)
Nigeria Chesapeake:
3.1% (477)Virginia:
0.6% (6,956)
El Salvador Chesapeake:
3.0% (459)Virginia:
9.9% (107,534)
Germany Chesapeake:
2.4% (372)Virginia:
1.7% (18,227)
Ghana Chesapeake:
2.1% (320)Virginia:
1.6% (17,346)
Cuba Chesapeake:
2.1% (318)Virginia:
0.5% (5,899)
Panama Chesapeake:
2.0% (301)Virginia:
0.4% (4,196)
Colombia Chesapeake:
1.7% (260)Virginia:
1.3% (14,435)
Pakistan Chesapeake:
1.6% (246)Virginia:
2.3% (24,582)
Italy Chesapeake:
1.5% (233)Virginia:
0.5% (5,147)
Place of birth for U.S.-born residents:
This state: 127,168Other state: 105,897Northeast: 31,322Midwest: 17,376South: 38,968West: 18,231 87.5% of Chesapeake residents lived in the same house 1 years ago.
Out of people who lived in different houses, 28.3% lived in this county.
Out of people who lived in different counties, 53.4% lived in Virginia.
Chesapeake:
87.5%State average:
86.6%
Education attainment for males 25 years and older:
No schooling: 1,756Nursery to 4th grade: 515th and 6th grade: 4397th and 8th grade: 2549th grade: 76710th grade: 74711th grade: 1,33212th grade, no diploma: 2,206High school graduate (or equivalency): 23,127Less than 1 year of college: 7,257Some college more than 1 year, no degree: 12,335Associate degree: 6,159Bachelor's degree: 16,032Master's degree: 8,345Professional school degree: 1,984Doctorate degree: 961
Education attainment for females 25 years and older:
No schooling: 1,602Nursery to 4th grade: 705th and 6th grade: 537th and 8th grade: 1,0949th grade: 35510th grade: 85711th grade: 18612th grade, no diploma: 479High school graduate (or equivalency): 20,254Less than 1 year of college: 7,607Some college more than 1 year, no degree: 12,800Associate degree: 10,260Bachelor's degree: 19,083Master's degree: 10,340Professional school degree: 2,078Doctorate degree: 1,395
Housing units in structures:
One, detached: 65,403One, attached: 13,763Two: 1,0333 or 4: 3,0805 to 9: 4,59110 to 19: 4,27220 to 49: 1,42050 or more: 2,080Mobile homes: 1,587Boats, RVs, vans, etc.: 57Median worth of mobile homes: $9,999
Housing units lacking complete plumbing facilities in 2022: 0.3%Housing units lacking complete kitchen facilities in 2022: 0.8%House/condo owner moved in on average 10 years ago
Renter moved in on average 3 years ago
Private vs. public school enrollment:
Students in private schools in grades 1 to 8 (elementary and middle school): 2,251 Students in private schools in grades 9 to 12 (high school): 1,359 Students in private undergraduate colleges: 1,876