Chesapeake Ranch Estates-Drum Point, MD (Maryland) Houses and Residents
| Chesapeake Ranch Estates-Drum Point: | $324,807 |
| Maryland: | $398,100 |
Total population: 13,485 (Urban population: 11,586 (all inside urban clusters), Rural population: 0)
Houses: 4,269 (3,863 occupied: 3,350 owner occupied, 513 renter occupied)
| % of renters here: | 13% |
| State: | 32% |
Housing density: 707 houses/condos per square mile
Median price asked for vacant for-sale houses and condos in 2022 in this county: $1,076,122.
Median contract rent in 2022: $1,639 (lower quartile is $1,528, upper quartile is over $2,000)
Median rent asked for vacant for-rent units in 2022: $1,717
Median gross rent in Chesapeake Ranch Estates-Drum Point, MD in 2022: $1,999
Housing units in Chesapeake Ranch Estates-Drum Point with a mortgage: 2,903 (366 second mortgage, 338 home equity loan, 7 both second mortgage and home equity loan)
Houses without a mortgage: 318
Compare current foreclosures near Chesapeake Ranch Estates-Drum Point, MD:
| Photo | Address | Area | Beds / Baths | Price | Details |
|---|---|---|---|---|---|

|
#1
Cardinal Ln
Lusby, MD 20657
|
756 sq. feet
|
1 baths 2 beds |
$195,000
|
show details |

|
#2
Baja Ln
Great Mills, MD 20634
|
1,056 sq. feet
|
1 baths 4 beds |
$100,000
|
show details |

|
#3
Hickory Landing Way
Hollywood, MD 20636
|
1,659 sq. feet
|
2 baths 2 beds |
$149,900
|
show details |

|
#4
Brookstone Ct
Lexington Park, MD 20653
|
2,506 sq. feet
|
2 baths 4 beds |
show details | |

|
#5
Lincoln Ave
Lexington Park, MD 20653
|
1,232 sq. feet
|
2 baths 3 beds |
show details | |

|
#6
Michael Dr
Lusby, MD 20657
|
960 sq. feet
|
1 baths 3 beds |
show details | |

|
#7
Yew Ct
Saint Leonard, MD 20685
|
1,891 sq. feet
|
1 baths 4 beds |
show details | |

|
#8
Laurel Way
Lusby, MD 20657
|
1,296 sq. feet
|
2 baths 3 beds |
show details | |

|
#9
Sollers Wharf Rd
Lusby, MD 20657
|
1,028 sq. feet
|
2 baths 3 beds |
show details | |

|
#10
Spike Buck Ln
Port Republic, MD 20676
|
1,904 sq. feet
|
3 baths - beds |
show details |
| Photo | Address | Area | Beds / Baths | Price | Details |
|---|---|---|---|---|---|

|
#11
Calvert Beach Rd
Saint Leonard, MD 20685
|
1,352 sq. feet
|
2 baths - beds |
show details | |

|
#12
Songbird Ln
Broomes Island, MD 20615
|
592 sq. feet
|
1 baths - beds |
show details | |

|
#13
Daniel Ct
California, MD 20619
|
1,832 sq. feet
|
2 baths - beds |
show details | |

|
#14
Parran Rd
Saint Leonard, MD 20685
|
2,092 sq. feet
|
2 baths - beds |
show details | |

|
#15
Parran Rd
Saint Leonard, MD 20685
|
2,092 sq. feet
|
2 baths - beds |
show details | |

|
#16
Evening Primrose Way
California, MD 20619
|
1,990 sq. feet
|
2 baths - beds |
show details | |

|
#17
Ridge Rd
Lusby, MD 20657
|
1,232 sq. feet
|
2 baths - beds |
show details | |

|
#18
Locust Rd
Saint Leonard, MD 20685
|
2,328 sq. feet
|
1 baths - beds |
show details | |

|
#19
Pine Rd
Saint Leonard, MD 20685
|
1,024 sq. feet
|
1 baths - beds |
show details | |

|
#20
Schwartzkopf Dr
Lexington Park, MD 20653
|
1,964 sq. feet
|
3 baths - beds |
show details |
| Photo | Address | Area | Beds / Baths | Price | Details |
|---|---|---|---|---|---|

|
#21
Autumn Leaf Way
California, MD 20619
|
2,112 sq. feet
|
2 baths - beds |
show details | |

|
#22
Silver Rock Rd
Lusby, MD 20657
|
1,410 sq. feet
|
2 baths - beds |
show details | |

|
#23
Kregel Ct
Lexington Park, MD 20653
|
1,984 sq. feet
|
2 baths - beds |
show details | |

|
#24
Warwick Dr
Lexington Park, MD 20653
|
1,594 sq. feet
|
2 baths - beds |
show details | |

|
#25
Warwick Dr
Lexington Park, MD 20653
|
1,210 sq. feet
|
2 baths - beds |
show details | |

|
#26
Gelrud Ct
Lexington Park, MD 20653
|
2,996 sq. feet
|
3 baths - beds |
show details | |

|
#27
Lynn Dr
Lexington Park, MD 20653
|
1,375 sq. feet
|
2 baths - beds |
show details | |

|
#28
Saw Mill Rd
Lusby, MD 20657
|
1,680 sq. feet
|
3 baths - beds |
show details | |

|
#29
Aralia Ave
Saint Leonard, MD 20685
|
960 sq. feet
|
1 baths - beds |
show details | |

|
#30
Bayview Ave
Saint Leonard, MD 20685
|
864 sq. feet
|
1 baths - beds |
show details |
| Photo | Address | Area | Beds / Baths | Price | Details |
|---|---|---|---|---|---|

|
#31
Calla Ln
Lexington Park, MD 20653
|
1,148 sq. feet
|
1 baths - beds |
show details | |

|
#32
Sixes Rd
Prince Frederick, MD 20678
|
1,242 sq. feet
|
2 baths - beds |
show details | |

|
#33
Leon Way
Mechanicsville, MD 20659
|
1,182 sq. feet
|
2 baths - beds |
show details | |

|
#34
Hallowing Point Rd
Prince Frederick, MD 20678
|
1,284 sq. feet
|
1 baths - beds |
show details | |

|
#35
North Ln
Prince Frederick, MD 20678
|
1,996 sq. feet
|
2 baths - beds |
show details | |

|
#36
Terrace Dr
Prince Frederick, MD 20678
|
1,600 sq. feet
|
2 baths - beds |
show details | |

|
#37
Backstretch Way
Prince Frederick, MD 20678
|
1,548 sq. feet
|
3 baths - beds |
show details | |

|
#38
Ada Way
Mechanicsville, MD 20659
|
1,928 sq. feet
|
2 baths - beds |
show details | |

|
#39
Chapel Hills Dr
Prince Frederick, MD 20678
|
1,872 sq. feet
|
2 baths - beds |
show details | |

|
#40
Timberline Ct
Leonardtown, MD 20650
|
1,524 sq. feet
|
2 baths - beds |
show details |
| Photo | Address | Area | Beds / Baths | Price | Details |
|---|---|---|---|---|---|

|
#41
Fred Ln
Mechanicsville, MD 20659
|
2,332 sq. feet
|
4 baths - beds |
show details | |

|
#42
Lakesville Crapo Rd
Church Creek, MD 21622
|
672 sq. feet
|
1 baths - beds |
show details | |

|
#43
Sixes Rd
Prince Frederick, MD 20678
|
1,098 sq. feet
|
2 baths - beds |
show details | |

|
#44
Flour Mill Ct
Great Mills, MD 20634
|
2,278 sq. feet
|
2 baths - beds |
show details | |

|
#45
Reed Ct
Mechanicsville, MD 20659
|
1,813 sq. feet
|
3 baths - beds |
show details | |

|
#46
Jones Rd
Mechanicsville, MD 20659
|
1,656 sq. feet
|
2 baths - beds |
show details | |

|
#47
Holly Ln
Mechanicsville, MD 20659
|
1,656 sq. feet
|
2 baths - beds |
show details | |

|
#48
Mcintosh Rd
Hollywood, MD 20636
|
1,584 sq. feet
|
2 baths - beds |
show details | |

|
#49
Hance Rd
Port Republic, MD 20676
|
776 sq. feet
|
1 baths - beds |
show details | |

|
Check over 1 million property listings on Foreclosure.com!
|
browse all offers | |||


Household type by relationship:
Households: 88,087- In family households: 78,925 (17,428 male householders, 6,304 female householders)
18,701 spouses, 28,627 children (26,427 natural, 628 adopted, 1,572 stepchildren), 2,230 grandchildren, 617 brothers or sisters, 856 parents, foster children, 1,106 other relatives, 2,287 non-relatives
- In nonfamily households: 9,162 (3,482 male householders (2,526 living alone)), 3,659 female householders (3,061 living alone)), 2,021 nonrelatives
- In group quarters: 650 (549 institutionalized population)
16,440 married couples with children.
3,566 single-parent households (1,042 men, 2,524 women).
96.2% of residents of Chesapeake Ranch Estates-Drum Point speak English at home.
2.2% of residents speak Spanish at home (61% speak English very well, 21% speak English well, 15% speak English not well, 3% don't speak English at all).
1.0% of residents speak other Indo-European language at home (62% speak English very well, 27% speak English well, 11% speak English not well).
0.7% of residents speak Asian or Pacific Island language at home (72% speak English very well, 14% speak English well, 14% speak English not well).
Foreign born population: 500 (3.4%)
(73.2% of them are naturalized citizens)
| Here: | 6.8 |
| State: | 7.3 |
| Here: | 6.2 |
| State: | 4.2 |

- Bedrooms in owner-occupied houses and condos in Chesapeake Ranch Estates-Drum Point, Maryland
- 0no bedroom
- 501 bedroom
- 3072 bedrooms
- 2,0923 bedrooms
- 7564 bedrooms
- 1455+ bedrooms

- Bedrooms in renter-occupied apartments in Chesapeake Ranch Estates-Drum Point, Maryland
- 0no bedroom
- 741 bedroom
- 872 bedrooms
- 3193 bedrooms
- 334 bedrooms
- 05+ bedrooms

- Cars and other vehicles available in Chesapeake Ranch Estates-Drum Point in owner-occupied houses/condos
- 41no vehicle
- 7051 vehicle
- 1,8702 vehicles
- 5823 vehicles
- 1344 vehicles
- 185+ vehicles

- Cars and other vehicles available in Chesapeake Ranch Estates-Drum Point in renter-occupied apartments
- 49no vehicle
- 1621 vehicle
- 2112 vehicles
- 833 vehicles
- 84 vehicles
- 05+ vehicles

- Rooms in owner-occupied houses in Chesapeake Ranch Estates-Drum Point, Maryland
- 01 room
- 02 rooms
- 1133 rooms
- 1584 rooms
- 6615 rooms
- 8956 rooms
- 6167 rooms
- 5208 rooms
- 3879+ rooms

- Rooms in renter-occupied apartments in Chesapeake Ranch Estates-Drum Point, Maryland
- 01 room
- 282 rooms
- 423 rooms
- 314 rooms
- 2015 rooms
- 806 rooms
- 807 rooms
- 258 rooms
- 269+ rooms


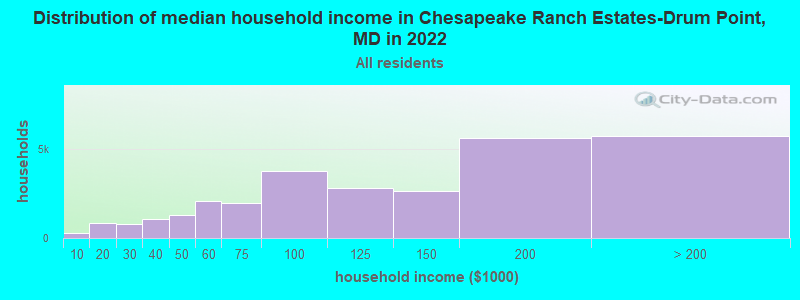
Chesapeake Ranch Estates-Drum Point, MD household income distribution

- 278Less than $10,000
- 869$10,000 to $19,999
- 814$20,000 to $29,999
- 1,084$30,000 to $39,999
- 1,296$40,000 to $49,999
- 2,056$50,000 to $59,999
- 1,987$60,000 to $74,999
- 3,792$75,000 to $99,999
- 2,788$100,000 to $124,999
- 2,619$125,000 to $149,999
- 5,648$150,000 to $199,999
- 5,742$200,000 or more
Percentage of workers working in this county: 43.5%
Number of people working at home: 1,299 (19.4% of all workers)
Travel time to work (commute)
- Less than 5 minutes: 68
- 5 to 9 minutes: 151
- 10 to 14 minutes: 384
- 15 to 19 minutes: 483
- 20 to 24 minutes: 665
- 25 to 29 minutes: 429
- 30 to 34 minutes: 981
- 35 to 39 minutes: 198
- 40 to 44 minutes: 188
- 45 to 59 minutes: 366
- 60 to 89 minutes: 776
- 90 or more minutes: 750
Means of transportation to work:
- Drove a car alone: 4,421 (80.0%)
- Carpooled: 901 (16.3%)
- Bus or trolley bus: 43 (0.8%)
- Walked: 21 (0.4%)
- Other means: 53 (1.0%)
- Worked at home: 86 (1.6%)


- Year of entry for the foreign-born population in Chesapeake Ranch Estates-Drum Point, Maryland
- 241995 to March 2000
- 301990 to 1994
- 521985 to 1989
- 381980 to 1984
- 161975 to 1979
- 111970 to 1974
- 171965 to 1969
- 33Before 1965
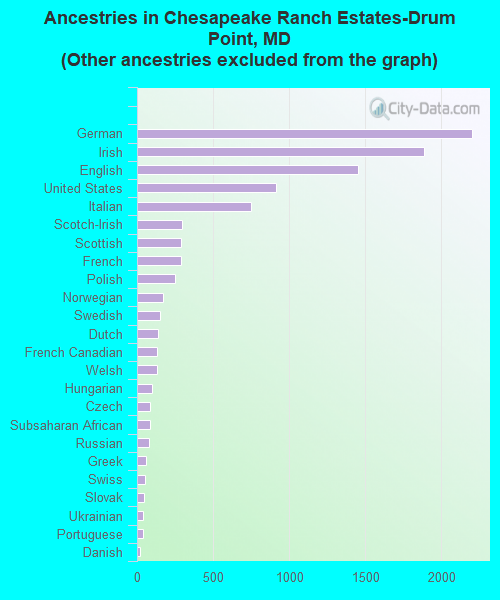
First ancestries reported:
- Other: 2,513 (20.6%)
- German: 2,203 (18.1%)
- Irish: 1,889 (15.5%)
- English: 1,454 (11.9%)
- United States: 913 (7.5%)
- Italian: 748 (6.1%)
- Scotch-Irish: 297 (2.4%)
- Scottish: 289 (2.4%)
- French: 288 (2.4%)
- Polish: 248 (2.0%)
- Norwegian: 168 (1.4%)
- Swedish: 151 (1.2%)
- Dutch: 135 (1.1%)
- French Canadian: 134 (1.1%)
- Welsh: 130 (1.1%)
- Hungarian: 99 (0.8%)
- Czech: 86 (0.7%)
- Subsaharan African: 85 (0.7%)
- Russian: 76 (0.6%)
- Greek: 56 (0.5%)
- Swiss: 50 (0.4%)
- Slovak: 44 (0.4%)
- Ukrainian: 41 (0.3%)
- Portuguese: 39 (0.3%)
- Danish: 22 (0.2%)
- Arab: 20 (0.2%)
- Lithuanian: 18 (0.1%)
Most common places of birth for foreign-born residents (%):
| Chesapeake Ranch Estates-Drum Point: | 11.8% (26) |
| Maryland: | 4.1% (21,007) |
| Chesapeake Ranch Estates-Drum Point: | 10.9% (24) |
| Maryland: | 2.7% (14,206) |
| Chesapeake Ranch Estates-Drum Point: | 9.0% (20) |
| Maryland: | 1.0% (5,354) |
| Chesapeake Ranch Estates-Drum Point: | 8.6% (19) |
| Maryland: | 6.2% (32,276) |
| Chesapeake Ranch Estates-Drum Point: | 8.6% (19) |
| Maryland: | 0.3% (1,541) |
| Chesapeake Ranch Estates-Drum Point: | 7.2% (16) |
| Maryland: | 1.6% (8,407) |
| Chesapeake Ranch Estates-Drum Point: | 5.0% (11) |
| Maryland: | 2.0% (10,309) |
| Chesapeake Ranch Estates-Drum Point: | 4.5% (10) |
| Maryland: | 1.4% (7,047) |
| Chesapeake Ranch Estates-Drum Point: | 4.1% (9) |
| Maryland: | 0.8% (4,199) |
| Chesapeake Ranch Estates-Drum Point: | 4.1% (9) |
| Maryland: | 0.5% (2,850) |
| Chesapeake Ranch Estates-Drum Point: | 4.1% (9) |
| Maryland: | 1.7% (9,019) |
| Chesapeake Ranch Estates-Drum Point: | 3.6% (8) |
| Maryland: | 0.3% (1,679) |
| Chesapeake Ranch Estates-Drum Point: | 3.6% (8) |
| Maryland: | 1.1% (5,630) |
| Chesapeake Ranch Estates-Drum Point: | 3.2% (7) |
| Maryland: | 0.5% (2,477) |
| Chesapeake Ranch Estates-Drum Point: | 3.2% (7) |
| Maryland: | 3.7% (19,287) |
| Chesapeake Ranch Estates-Drum Point: | 3.2% (7) |
| Maryland: | 0.6% (3,146) |
| Chesapeake Ranch Estates-Drum Point: | 3.2% (7) |
| Maryland: | 1.2% (6,190) |
| Chesapeake Ranch Estates-Drum Point: | 2.3% (5) |
| Maryland: | 1.0% (5,419) |
Place of birth for U.S.-born residents:
- This state: 4,693
- Other state: 6,522
- Northeast: 1,886
- Midwest: 786
- South: 3,229
- West: 621
49% of Chesapeake Ranch Estates-Drum Point residents lived in the same house 5 years ago.
Out of people who lived in different houses, 32% lived in this county.
Out of people who lived in different counties, 45% lived in Maryland.
Education attainment for males 25 years and older:
- No schooling: 0
- Nursery to 4th grade: 0
- 5th and 6th grade: 19
- 7th and 8th grade: 46
- 9th grade: 50
- 10th grade: 65
- 11th grade: 97
- 12th grade, no diploma: 84
- High school graduate (or equivalency): 1,046
- Less than 1 year of college: 259
- Some college more than 1 year, no degree: 641
- Associate degree: 245
- Bachelor's degree: 495
- Master's degree: 246
- Professional school degree: 31
- Doctorate degree: 50

Education attainment for females 25 years and older:
- No schooling: 0
- Nursery to 4th grade: 20
- 5th and 6th grade: 17
- 7th and 8th grade: 77
- 9th grade: 21
- 10th grade: 114
- 11th grade: 56
- 12th grade, no diploma: 112
- High school graduate (or equivalency): 1,237
- Less than 1 year of college: 373
- Some college more than 1 year, no degree: 551
- Associate degree: 356
- Bachelor's degree: 416
- Master's degree: 200
- Professional school degree: 28
- Doctorate degree: 20


Housing units in structures:
- One, detached: 4,163
- One, attached: 39
- Two: 27
- 3 or 4: 17
- 5 to 9: 7
- 10 to 19: 8
- Mobile homes: 8
Housing units lacking complete kitchen facilities: 0.2%

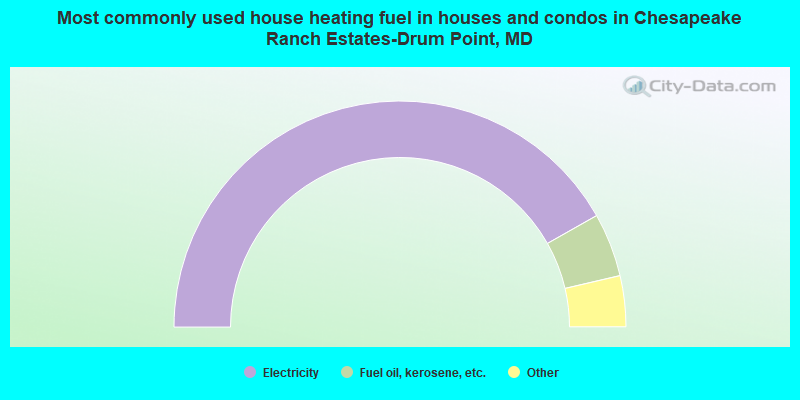
- 83.6%Electricity
- 9.1%Fuel oil, kerosene, etc.
- 3.2%Wood
- 3.0%Bottled, tank, or LP gas
- 0.5%Other fuel
- 0.3%Utility gas
- 0.3%Solar energy
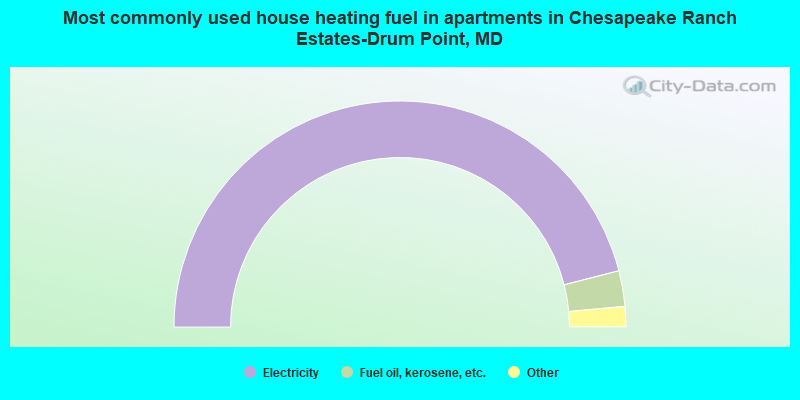
- 92.0%Electricity
- 5.1%Fuel oil, kerosene, etc.
- 1.6%Utility gas
- 1.4%Bottled, tank, or LP gas
Private vs. public school enrollment:
| Here: | 9.2% |
| Maryland: | 14.8% |
| Here: | 10.1% |
| Maryland: | 13.3% |
| Here: | 13.3% |
| Maryland: | 21.7% |


