Charlton, MA (Massachusetts) Houses and Residents
| Charlton: | $423,901 |
| Massachusetts: | $534,700 |
Total population: 12,981 (Urban population: 3,718, Rural population: 7,545 (54 farm, 7,491 nonfarm))
Houses: 4,008 (3,788 occupied: 3,137 owner occupied, 651 renter occupied)
| % of renters here: | 17% |
| State: | 38% |
Housing density: 94 houses/condos per square mile
Median price asked for vacant for-sale houses and condos in 2022 in this county: $182,682.
Median contract rent in 2022: $1,115 (lower quartile is $903, upper quartile is $1,421)
Median rent asked for vacant for-rent units in 2022: $1,093
Median gross rent in Charlton, MA in 2022: $1,284
Housing units in Charlton with a mortgage: 2,224 (151 second mortgage, 288 home equity loan, 39 both second mortgage and home equity loan)
Houses without a mortgage: 471
Compare current foreclosures near Charlton, MA:
| Photo | Address | Area | Beds / Baths | Price | Details |
|---|---|---|---|---|---|

|
#1
Number 10 Schoolhouse Rd
Charlton, MA 01507
|
912 sq. feet
|
1 baths 3 beds |
show details | |

|
#2
Oak Ridge Dr
Charlton, MA 01507
|
1,531 sq. feet
|
1 baths 4 beds |
show details | |

|
#3
Park Rd
Charlton, MA 01507
|
640 sq. feet
|
1 baths 2 beds |
show details | |

|
#4
Southbridge Rd Unit 104
Charlton, MA 01507
|
1,266 sq. feet
|
2 baths 2 beds |
show details | |

|
#5
Lakeview Dr
Charlton, MA 01507
|
1,235 sq. feet
|
1 baths 2 beds |
show details | |

|
#6
Muggett Hill Rd
Charlton, MA 01507
|
2,728 sq. feet
|
2 baths 3 beds |
show details | |

|
#7
Lindsey Ln
Charlton, MA 01507
|
2,784 sq. feet
|
2 baths 4 beds |
show details | |

|
#8
Buffum Rd
Charlton, MA 01507
|
2,578 sq. feet
|
3 baths 4 beds |
show details | |

|
#9
Lindsey Ln
Charlton, MA 01507
|
2,871 sq. feet
|
2 baths 4 beds |
show details | |

|
#10
Southbridge Rd Unit
Charlton, MA 01507
|
- sq. feet
|
- baths - beds |
show details |
| Photo | Address | Area | Beds / Baths | Price | Details |
|---|---|---|---|---|---|

|
#11
J Davis Rd
Charlton, MA 01507
|
- sq. feet
|
- baths - beds |
show details | |

|
#12
Stafford St Apt 46
Charlton, MA 01507
|
- sq. feet
|
- baths - beds |
show details | |

|
#13
Sunset Dr
Charlton, MA 01507
|
- sq. feet
|
- baths - beds |
show details | |

|
#14
Nugget Dr
Charlton, MA 01507
|
- sq. feet
|
- baths - beds |
show details | |

|
#15
Clarence Dr
Oxford, MA 01540
|
3,010 sq. feet
|
3 baths 5 beds |
$569,900
|
show details |

|
#16
Round Lake Dr
Pascoag, RI 02859
|
976 sq. feet
|
2 baths 2 beds |
$179,900
|
show details |

|
#17
Nome St
Worcester, MA 01605
|
960 sq. feet
|
1 baths 4 beds |
$208,000
|
show details |

|
#18
N Brookfield Rd
Oakham, MA 01068
|
1,078 sq. feet
|
1 baths 2 beds |
$439,900
|
show details |

|
#19
W Main St
Ware, MA 01082
|
3,645 sq. feet
|
3 baths 5 beds |
show details | |

|
#20
Old West Brookfield Road
Warren, MA 01083
|
1,760 sq. feet
|
2 baths 4 beds |
show details |
| Photo | Address | Area | Beds / Baths | Price | Details |
|---|---|---|---|---|---|

|
#21
Paine District Rd
Woodstock, CT 06281
|
1,092 sq. feet
|
1 baths 2 beds |
show details | |

|
#22
Leicester St
Auburn, MA 01501
|
912 sq. feet
|
1 baths 2 beds |
show details | |

|
#23
Roberts Park Rd
Holland, MA 01521
|
660 sq. feet
|
1 baths 3 beds |
show details | |

|
#24
Pocasset Ave
Worcester, MA 01606
|
2,090 sq. feet
|
3 baths 3 beds |
show details | |

|
#25
-42 N Main St
Whitinsville, MA 01588
|
2,318 sq. feet
|
4 baths 6 beds |
show details | |

|
#26
Riverlin St
Millbury, MA 01527
|
1,162 sq. feet
|
2 baths 2 beds |
show details | |

|
#27
Redfield Rd
Cherry Valley, MA 01611
|
1,412 sq. feet
|
1 baths 3 beds |
show details | |

|
#28
Hawkins St
Worcester, MA 01604
|
864 sq. feet
|
1 baths 3 beds |
show details | |

|
#29
Pine St
Dudley, MA 01571
|
1,414 sq. feet
|
2 baths 4 beds |
show details | |

|
#30
Wales Rd
Brimfield, MA 01010
|
2,312 sq. feet
|
2 baths 3 beds |
show details |
| Photo | Address | Area | Beds / Baths | Price | Details |
|---|---|---|---|---|---|

|
#31
Marc Ave
Southbridge, MA 01550
|
960 sq. feet
|
1 baths 3 beds |
show details | |

|
#32
Reed St
Warren, MA 01083
|
1,152 sq. feet
|
2 baths 3 beds |
show details | |

|
#33
Nelson Street
Warren, MA 01083
|
- sq. feet
|
2 baths 3 beds |
show details | |

|
#34
Treadwell Ter
Spencer, MA 01562
|
960 sq. feet
|
1 baths 3 beds |
show details | |

|
#35
Brookfield Rd
Brimfield, MA 01010
|
1,482 sq. feet
|
3 baths 3 beds |
show details | |

|
#36
1/2 Putnam Hill Road
Sutton, MA 01590
|
1,415 sq. feet
|
1 baths 3 beds |
show details | |

|
#37
Superior Rd
Worcester, MA 01604
|
1,167 sq. feet
|
1 baths 2 beds |
show details | |

|
#38
Bleeker St
Worcester, MA 01604
|
937 sq. feet
|
1 baths 4 beds |
show details | |

|
#39
Greencourt St
Worcester, MA 01604
|
984 sq. feet
|
1 baths 3 beds |
show details | |

|
#40
Cedar Ave
Millbury, MA 01527
|
2,344 sq. feet
|
2 baths 4 beds |
show details |
| Photo | Address | Area | Beds / Baths | Price | Details |
|---|---|---|---|---|---|

|
#41
Millbury St
Grafton, MA 01519
|
1,840 sq. feet
|
2 baths 3 beds |
show details | |

|
#42
Greenbush Rd
Worcester, MA 01604
|
1,666 sq. feet
|
2 baths 3 beds |
show details | |

|
#43
Dartmouth St
Worcester, MA 01604
|
3,963 sq. feet
|
3 baths 9 beds |
show details | |

|
#44
Pilgrim Ave
Worcester, MA 01604
|
2,000 sq. feet
|
2 baths 4 beds |
show details | |

|
#45
Carter Way
Worcester, MA 01609
|
2,397 sq. feet
|
2 baths 4 beds |
show details | |

|
#46
Stanton St Apt 35
Worcester, MA 01605
|
751 sq. feet
|
1 baths 2 beds |
show details | |

|
#47
Lakeview Rd
Millbury, MA 01527
|
1,523 sq. feet
|
2 baths 3 beds |
show details | |

|
#48
Whitins Rd
Sutton, MA 01590
|
1,755 sq. feet
|
2 baths 3 beds |
show details | |

|
#49
Valley Hill Dr
Worcester, MA 01609
|
1,174 sq. feet
|
1 baths 2 beds |
show details | |

|
Check over 1 million property listings on Foreclosure.com!
|
browse all offers | |||
Latest news about housing in Charlton, MA collected exclusively by city-data.com from local newspapers, TV, and radio stations

 | How Much Massachusetts Households Make Per Year: Census Data (37 replies) |
| jobs and cheap apartments in Leominster or Worcester to move in September 2019 (17 replies) |
| What's the rental market like for single family homes? (15 replies) |
| Tree House Brewing Cape Cod (42 replies) |
| Favorite local breweries and craft beers (171 replies) |
| More Fall River shootings (52 replies) |

Household type by relationship:
Households: 771,507- In family households: 644,137 (138,415 male householders, 64,187 female householders)
151,406 spouses, 234,038 children (220,335 natural, 5,096 adopted, 8,607 stepchildren), 11,080 grandchildren, 6,742 brothers or sisters, 7,870 parents, foster children, 7,297 other relatives, 18,119 non-relatives
- In nonfamily households: 127,370 (47,312 male householders (35,337 living alone)), 53,166 female householders (44,100 living alone)), 26,892 nonrelatives
- In group quarters: 27,045 (11,315 institutionalized population)
135,695 married couples with children.
42,745 single-parent households (8,218 men, 34,527 women).
95.5% of residents of Charlton speak English at home.
0.9% of residents speak Spanish at home (78% speak English very well, 14% speak English not well, 8% don't speak English at all).
3.1% of residents speak other Indo-European language at home (84% speak English very well, 14% speak English well, 2% speak English not well).
0.1% of residents speak Asian or Pacific Island language at home (100% speak English well).
0.4% of residents speak other language at home (85% speak English very well, 15% speak English well).
Foreign born population: 360 (2.8%)
(110.0% of them are naturalized citizens)
| Here: | 6.4 |
| State: | 6.5 |
| Here: | 4.3 |
| State: | 4.0 |

- Bedrooms in owner-occupied houses and condos in Charlton, Massachusetts
- 15no bedroom
- 821 bedroom
- 4912 bedrooms
- 1,8803 bedrooms
- 6064 bedrooms
- 635+ bedrooms

- Bedrooms in renter-occupied apartments in Charlton, Massachusetts
- 35no bedroom
- 1241 bedroom
- 3412 bedrooms
- 1423 bedrooms
- 94 bedrooms
- 05+ bedrooms

- Cars and other vehicles available in Charlton in owner-occupied houses/condos
- 77no vehicle
- 6171 vehicle
- 1,6092 vehicles
- 6303 vehicles
- 1334 vehicles
- 715+ vehicles

- Cars and other vehicles available in Charlton in renter-occupied apartments
- 25no vehicle
- 3021 vehicle
- 2942 vehicles
- 243 vehicles
- 64 vehicles
- 05+ vehicles

- Rooms in owner-occupied houses in Charlton, Massachusetts
- 01 room
- 82 rooms
- 443 rooms
- 1974 rooms
- 6115 rooms
- 7996 rooms
- 6707 rooms
- 4538 rooms
- 3559+ rooms

- Rooms in renter-occupied apartments in Charlton, Massachusetts
- 201 room
- 222 rooms
- 1083 rooms
- 2834 rooms
- 1285 rooms
- 376 rooms
- 187 rooms
- 268 rooms
- 99+ rooms


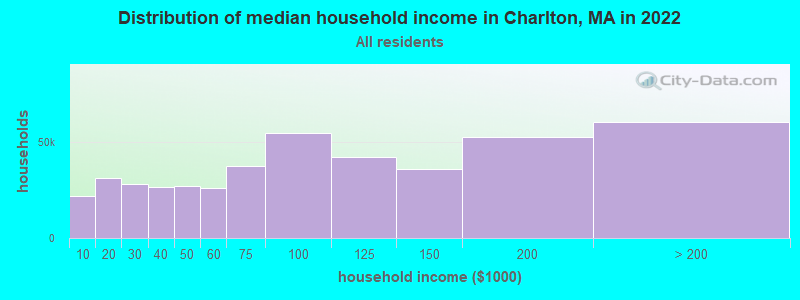
Charlton, MA household income distribution

- 21,847Less than $10,000
- 31,171$10,000 to $19,999
- 28,388$20,000 to $29,999
- 26,423$30,000 to $39,999
- 27,057$40,000 to $49,999
- 25,906$50,000 to $59,999
- 37,594$60,000 to $74,999
- 54,679$75,000 to $99,999
- 42,442$100,000 to $124,999
- 36,267$125,000 to $149,999
- 52,821$150,000 to $199,999
- 60,546$200,000 or more
Percentage of workers working in this county: 87.7%
Number of people working at home: 1,124 (16.0% of all workers)
Travel time to work (commute)
- Less than 5 minutes: 141
- 5 to 9 minutes: 306
- 10 to 14 minutes: 621
- 15 to 19 minutes: 656
- 20 to 24 minutes: 955
- 25 to 29 minutes: 543
- 30 to 34 minutes: 888
- 35 to 39 minutes: 143
- 40 to 44 minutes: 351
- 45 to 59 minutes: 450
- 60 to 89 minutes: 451
- 90 or more minutes: 112
Means of transportation to work:
- Drove a car alone: 4,993 (86.2%)
- Carpooled: 461 (8.0%)
- Bus or trolley bus: 20 (0.3%)
- Streetcar or trolley car: 9 (0.2%)
- Railroad: 20 (0.3%)
- Bicycle: 8 (0.1%)
- Walked: 100 (1.7%)
- Other means: 6 (0.1%)
- Worked at home: 173 (3.0%)


- Year of entry for the foreign-born population in Charlton, Massachusetts
- 181995 to March 2000
- 151990 to 1994
- 161985 to 1989
- 121980 to 1984
- 81975 to 1979
- 101970 to 1974
- 361965 to 1969
- 62Before 1965

First ancestries reported:
- French: 2,520 (18.1%)
- Irish: 2,180 (15.7%)
- English: 1,987 (14.3%)
- Polish: 1,248 (9.0%)
- Italian: 1,171 (8.4%)
- French Canadian: 811 (5.8%)
- United States: 735 (5.3%)
- Other: 707 (5.1%)
- German: 693 (5.0%)
- Swedish: 487 (3.5%)
- Scottish: 386 (2.8%)
- Lithuanian: 229 (1.6%)
- Scotch-Irish: 133 (1.0%)
- Greek: 124 (0.9%)
- Norwegian: 108 (0.8%)
- Dutch: 83 (0.6%)
- Portuguese: 63 (0.5%)
- Subsaharan African: 42 (0.3%)
- Welsh: 40 (0.3%)
- Russian: 28 (0.2%)
- Arab: 27 (0.2%)
- Ukrainian: 26 (0.2%)
- Danish: 19 (0.1%)
- Swiss: 18 (0.1%)
- Czech: 13 (0.09%)
- Hungarian: 11 (0.08%)
Most common places of birth for foreign-born residents (%):
| Charlton: | 23.2% (41) |
| Massachusetts: | 3.3% (25,403) |
| Charlton: | 15.3% (27) |
| Massachusetts: | 0.4% (2,985) |
| Charlton: | 14.1% (25) |
| Massachusetts: | 5.2% (40,247) |
| Charlton: | 11.9% (21) |
| Massachusetts: | 1.9% (14,883) |
| Charlton: | 9.6% (17) |
| Massachusetts: | 0.8% (5,895) |
| Charlton: | 7.3% (13) |
| Massachusetts: | 4.7% (36,669) |
| Charlton: | 6.8% (12) |
| Massachusetts: | 0.4% (3,051) |
| Charlton: | 4.5% (8) |
| Massachusetts: | 1.7% (12,975) |
| Charlton: | 4.5% (8) |
| Massachusetts: | 2.6% (20,299) |
| Charlton: | 2.8% (5) |
| Massachusetts: | 2.3% (17,987) |
Place of birth for U.S.-born residents:
- This state: 8,950
- Other state: 2,071
- Northeast: 1,431
- Midwest: 249
- South: 277
- West: 114
71% of Charlton residents lived in the same house 5 years ago.
Out of people who lived in different houses, 72% lived in this county.
Out of people who lived in different counties, 24% lived in Massachusetts.
Education attainment for males 25 years and older:
- No schooling: 0
- Nursery to 4th grade: 6
- 5th and 6th grade: 28
- 7th and 8th grade: 129
- 9th grade: 64
- 10th grade: 70
- 11th grade: 95
- 12th grade, no diploma: 91
- High school graduate (or equivalency): 1,102
- Less than 1 year of college: 162
- Some college more than 1 year, no degree: 460
- Associate degree: 363
- Bachelor's degree: 540
- Master's degree: 274
- Professional school degree: 61
- Doctorate degree: 48

Education attainment for females 25 years and older:
- No schooling: 0
- Nursery to 4th grade: 21
- 5th and 6th grade: 33
- 7th and 8th grade: 124
- 9th grade: 23
- 10th grade: 108
- 11th grade: 45
- 12th grade, no diploma: 122
- High school graduate (or equivalency): 1,255
- Less than 1 year of college: 366
- Some college more than 1 year, no degree: 391
- Associate degree: 294
- Bachelor's degree: 620
- Master's degree: 320
- Professional school degree: 49
- Doctorate degree: 11


Housing units in structures:
- One, detached: 3,145
- One, attached: 192
- Two: 188
- 3 or 4: 286
- 5 to 9: 147
- 10 to 19: 9
- 50 or more: 11
- Mobile homes: 30
Median worth of mobile homes: $187,327
Housing units lacking complete kitchen facilities: 0.2%

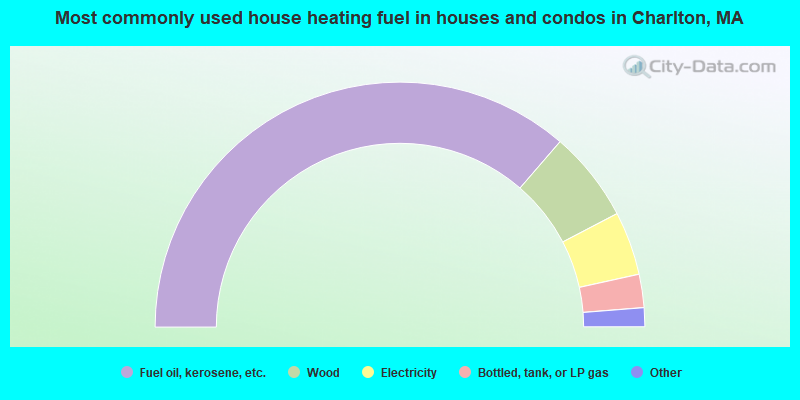
- 72.7%Fuel oil, kerosene, etc.
- 12.0%Wood
- 8.4%Electricity
- 4.4%Bottled, tank, or LP gas
- 1.0%Coal or coke
- 0.9%Utility gas
- 0.5%Other fuel
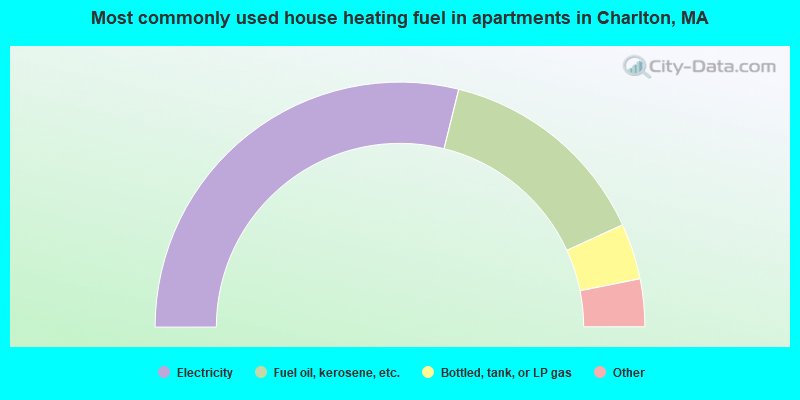
- 57.8%Electricity
- 28.6%Fuel oil, kerosene, etc.
- 7.4%Bottled, tank, or LP gas
- 3.2%Utility gas
- 1.5%Wood
- 1.5%Other fuel
Private vs. public school enrollment:
| Here: | 10.6% |
| Massachusetts: | 10.8% |
| Here: | 4.8% |
| Massachusetts: | 12.2% |
| Here: | 30.6% |
| Massachusetts: | 48.2% |


