Charlotte Harbor, FL (Florida) Houses and Residents
| Charlotte Harbor: | $227,951 |
| Florida: | $354,100 |
Mean price in 2022:
Detached houses: $451,324
Here: $451,324 State: $500,941 Townhouses or other attached units: $110,093
Here: $110,093 State: $370,869 In 3-to-4-unit structures: $115,598
Here: $115,598 State: $309,944 In 5-or-more-unit structures: $163,858
Here: $163,858 State: $447,145 Mobile homes: $78,431
Here: $78,431 State: $113,202
Total population: 3,714 (Urban population: 3,674, Rural population: 0)
Houses: 3,119 (2,254 occupied: 965 owner occupied, 1,302 renter occupied)
| % of renters here: | 57% |
| State: | 33% |
Housing density: 1,430 houses/condos per square mile
Median price asked for vacant for-sale houses and condos in 2022: $219,897.
Median contract rent in 2022: $1,076 (lower quartile is $827, upper quartile is $1,326)
Median rent asked for vacant for-rent units in 2022: $1,163
Median gross rent in Charlotte Harbor, FL in 2022: $1,161
Housing units in Charlotte Harbor with a mortgage: 320 (8 second mortgage, 0 home equity loan, 7 both second mortgage and home equity loan)
Houses without a mortgage: 10
Median household income for houses/condos with a mortgage: $67,564
Median household income for apartments without a mortgage: $52,970
Median monthly housing costs: $1,028
Compare current foreclosures near Charlotte Harbor, FL:
| Photo | Address | Area | Beds / Baths | Price | Details |
|---|---|---|---|---|---|

|
#1
Foote Ave
Port Charlotte, FL 33952
|
1,316 sq. feet
|
2 baths 3 beds |
$190,000
|
show details |

|
#2
W Tarpon Blvd NW
Port Charlotte, FL 33952
|
1,167 sq. feet
|
2 baths 3 beds |
$460,000
|
show details |

|
#3
S San Mateo Dr
North Port, FL 34288
|
1,857 sq. feet
|
2 baths 3 beds |
$266,000
|
show details |

|
#4
Commonwealth Ave
Port Charlotte, FL 33981
|
1,851 sq. feet
|
2 baths 4 beds |
show details | |

|
#5
Tevesine Ct
Punta Gorda, FL 33983
|
2,116 sq. feet
|
4 baths 3 beds |
show details | |

|
#6
Madagascar Ave
North Port, FL 34286
|
1,336 sq. feet
|
2 baths 3 beds |
show details | |

|
#7
Yarmouth St
Port Charlotte, FL 33952
|
878 sq. feet
|
2 baths 2 beds |
show details | |

|
#8
Talbrook Rd
North Port, FL 34287
|
1,176 sq. feet
|
2 baths 2 beds |
show details | |

|
#9
Ackerman Ave
Port Charlotte, FL 33948
|
1,764 sq. feet
|
2 baths 3 beds |
show details | |

|
#10
Congress St
Port Charlotte, FL 33952
|
925 sq. feet
|
2 baths 3 beds |
show details |
| Photo | Address | Area | Beds / Baths | Price | Details |
|---|---|---|---|---|---|

|
#11
Xita Ave
Port Charlotte, FL 33952
|
1,681 sq. feet
|
2 baths 3 beds |
show details | |

|
#12
Forrest Nelson Blvd Apt C8
Port Charlotte, FL 33952
|
- sq. feet
|
2 baths 2 beds |
show details | |

|
#13
Lambert St
Port Charlotte, FL 33948
|
1,333 sq. feet
|
2 baths 3 beds |
show details | |

|
#14
Forrest Nelson Blvd # B#b2
Port Charlotte, FL 33952
|
1,218 sq. feet
|
2 baths 2 beds |
show details | |

|
#15
Verona St
Port Charlotte, FL 33948
|
1,774 sq. feet
|
2 baths 3 beds |
show details | |

|
#16
Great Falls Ter NW
Port Charlotte, FL 33948
|
1,475 sq. feet
|
2 baths 3 beds |
show details | |

|
#17
Torino St
North Port, FL 34287
|
1,862 sq. feet
|
2 baths 3 beds |
show details | |

|
#18
Kenwood Dr
North Port, FL 34287
|
1,237 sq. feet
|
2 baths 2 beds |
show details | |

|
#19
Broad Ranch Dr
Port Charlotte, FL 33948
|
952 sq. feet
|
2 baths 3 beds |
show details | |

|
#20
Chenille Dr
Port Charlotte, FL 33981
|
1,760 sq. feet
|
2 baths 4 beds |
show details |
| Photo | Address | Area | Beds / Baths | Price | Details |
|---|---|---|---|---|---|

|
#21
Ranger Ave
Port Charlotte, FL 33954
|
2,493 sq. feet
|
2 baths 4 beds |
show details | |

|
#22
Traverse Ave
North Port, FL 34286
|
1,478 sq. feet
|
2 baths 3 beds |
show details | |

|
#23
Morristown Ave
Port Charlotte, FL 33981
|
2,238 sq. feet
|
2 baths 4 beds |
show details | |

|
#24
Briggs Cir
Port Charlotte, FL 33948
|
884 sq. feet
|
2 baths 2 beds |
show details | |

|
#25
S Salford Blvd
North Port, FL 34287
|
1,776 sq. feet
|
2 baths 3 beds |
show details | |

|
#26
Baffin Ave
Port Charlotte, FL 33954
|
936 sq. feet
|
2 baths 3 beds |
show details | |

|
#27
Susan Ave
Port Charlotte, FL 33952
|
1,734 sq. feet
|
2 baths 3 beds |
show details | |

|
#28
Riverton Cir
Port Charlotte, FL 33981
|
1,452 sq. feet
|
2 baths 3 beds |
show details | |

|
#29
Kenova St
Port Charlotte, FL 33954
|
787 sq. feet
|
1 baths 2 beds |
show details | |

|
#30
Ashcroft Cir
Port Charlotte, FL 33948
|
998 sq. feet
|
2 baths 3 beds |
show details |
| Photo | Address | Area | Beds / Baths | Price | Details |
|---|---|---|---|---|---|

|
#31
Darden St
Port Charlotte, FL 33981
|
1,283 sq. feet
|
2 baths 3 beds |
show details | |

|
#32
NW 34th Ter
Cape Coral, FL 33993
|
2,430 sq. feet
|
2 baths 3 beds |
show details | |

|
#33
Richards Ave
Port Charlotte, FL 33981
|
1,564 sq. feet
|
2 baths 3 beds |
show details | |

|
#34
Bolander Ter
North Port, FL 34287
|
2,308 sq. feet
|
3 baths 3 beds |
show details | |

|
#35
Mill Run Ct
North Port, FL 34287
|
1,176 sq. feet
|
2 baths 2 beds |
show details | |

|
#36
Mill Run Ct
North Port, FL 34287
|
912 sq. feet
|
2 baths 2 beds |
show details | |

|
#37
Mill Run Ct
North Port, FL 34287
|
997 sq. feet
|
2 baths 2 beds |
show details | |

|
#38
Allworthy St
Port Charlotte, FL 33954
|
1,737 sq. feet
|
2 baths 3 beds |
show details | |

|
#39
Sylvania Ave
North Port, FL 34291
|
1,443 sq. feet
|
2 baths 3 beds |
show details | |

|
#40
Lion Ter
Port Charlotte, FL 33952
|
1,360 sq. feet
|
2 baths 3 beds |
show details |
| Photo | Address | Area | Beds / Baths | Price | Details |
|---|---|---|---|---|---|

|
#41
Hartley Ave
Port Charlotte, FL 33954
|
2,174 sq. feet
|
2 baths 3 beds |
show details | |

|
#42
Ulman Ave
North Port, FL 34286
|
2,131 sq. feet
|
2 baths 3 beds |
show details | |

|
#43
Dongola St
North Port, FL 34291
|
2,133 sq. feet
|
2 baths 3 beds |
show details | |

|
#44
Knollwood Dr
Punta Gorda, FL 33982
|
850 sq. feet
|
2 baths 1 beds |
show details | |

|
#45
N San Mateo Dr
North Port, FL 34288
|
2,071 sq. feet
|
2 baths 3 beds |
show details | |

|
#46
Stardust Ave
North Port, FL 34287
|
1,176 sq. feet
|
2 baths 3 beds |
show details | |

|
#47
Myrtlewood Rd
North Port, FL 34287
|
904 sq. feet
|
1 baths 2 beds |
show details | |

|
#48
Ambler St
Port Charlotte, FL 33954
|
1,299 sq. feet
|
2 baths 2 beds |
show details | |

|
#49
Palisade Rd
Punta Gorda, FL 33983
|
1,558 sq. feet
|
2 baths 3 beds |
show details | |

|
Check over 1 million property listings on Foreclosure.com!
|
browse all offers | |||


 | PG/PG Waterfront Homes (23 replies) |
| Punta Gorda vs. Cape Coral (quality of life not real estate) (68 replies) |
| Looking for dock to lease / rent (1 reply) |
| So what's the catch with Port Charlotte Canal Homes? (17 replies) |
| Were Punta Gorda waterfront houses flooded from"Charlie" (28 replies) |
| Punta Gorda? Possibly our new home....? Friendly town? (11 replies) |

Median year apartment built: 1985
Household type by relationship:
Households: 4,819- Male householders: 1,266 (545 living alone), Female householders: 998 (498 living alone)
759 spouses (759 opposite-sex spouses), 131 unmarried partners, (131 opposite-sex unmarried partners), 704 children (690 natural, 0 adopted, 13 stepchildren), 100 grandchildren, 0 brothers or sisters, 130 parents, 0 foster children, 0 other relatives, 83 non-relatives
- In group quarters: 644
Size of family households: 704 2-persons, 273 3-persons, 106 4-persons, 16 5-persons.
Size of nonfamily households: 1,005 1-person, 133 2-persons.
161 married couples with children.
273 single-parent households (149 men, 124 women).
92.5% of residents of Charlotte Harbor speak English at home.
3.5% of residents speak Spanish at home (73% speak English very well, 11% speak English well, 11% speak English not well, 5% don't speak English at all).
4.7% of residents speak other Indo-European language at home (78% speak English very well, 11% speak English well, 11% speak English not well).
0.3% of residents speak Asian or Pacific Island language at home (57% speak English very well, 43% speak English well).
Foreign born population: 361 (7.5%)
(48.5% of them are naturalized citizens)
| Here: | 4.7 |
| State: | 5.9 |
| Here: | 3.5 |
| State: | 4.2 |

- Bedrooms in owner-occupied houses and condos in Charlotte Harbor, Florida
- 5no bedroom
- 511 bedroom
- 5732 bedrooms
- 2593 bedrooms
- 784 bedrooms
- 05+ bedrooms

- Bedrooms in renter-occupied apartments in Charlotte Harbor, Florida
- 215no bedroom
- 4101 bedroom
- 5222 bedrooms
- 1423 bedrooms
- 24 bedrooms
- 115+ bedrooms

- Cars and other vehicles available in Charlotte Harbor in owner-occupied houses/condos
- 65no vehicle
- 5521 vehicle
- 2662 vehicles
- 753 vehicles
- 74 vehicles
- 05+ vehicles

- Cars and other vehicles available in Charlotte Harbor in renter-occupied apartments
- 373no vehicle
- 6411 vehicle
- 2882 vehicles
- 03 vehicles
- 04 vehicles
- 05+ vehicles

- Rooms in owner-occupied houses in Charlotte Harbor, Florida
- 51 room
- 02 rooms
- 1783 rooms
- 2804 rooms
- 2205 rooms
- 1016 rooms
- 947 rooms
- 328 rooms
- 549+ rooms

- Rooms in renter-occupied apartments in Charlotte Harbor, Florida
- 2151 room
- 2012 rooms
- 2843 rooms
- 3344 rooms
- 945 rooms
- 876 rooms
- 157 rooms
- 28 rooms
- 719+ rooms


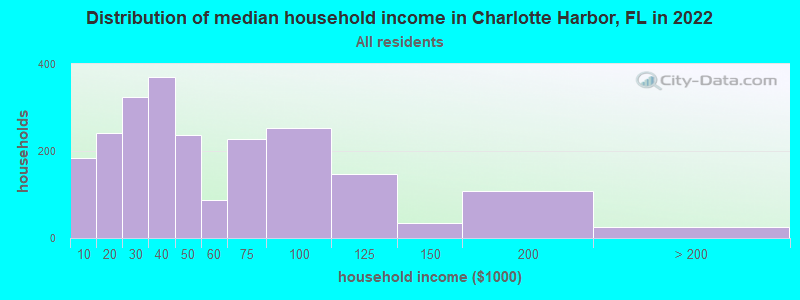
Charlotte Harbor, FL household income distribution

- 183Less than $10,000
- 242$10,000 to $19,999
- 323$20,000 to $29,999
- 371$30,000 to $39,999
- 237$40,000 to $49,999
- 87$50,000 to $59,999
- 227$60,000 to $74,999
- 254$75,000 to $99,999
- 148$100,000 to $124,999
- 34$125,000 to $149,999
- 108$150,000 to $199,999
- 26$200,000 or more
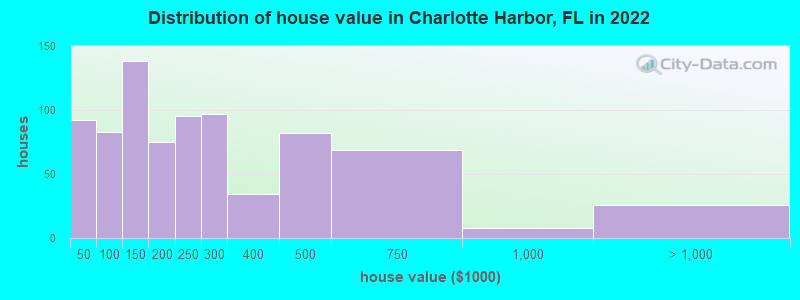
Home value of owner - occupied houses in 2022 in Charlotte Harbor, FL
-
- 9$10,000 to $14,999
- 14$15,000 to $19,999
- 13$25,000 to $29,999
- 54$30,000 to $34,999
- 27$50,000 to $59,999
- 12$60,000 to $69,999
- 11$70,000 to $79,999
- 20$80,000 to $89,999
- 10$90,000 to $99,999
- 94$100,000 to $124,999
- 43$125,000 to $149,999
- 10$150,000 to $174,999
- 64$175,000 to $199,999
- 94$200,000 to $249,999
- 96$250,000 to $299,999
- 34$300,000 to $399,999
- 82$400,000 to $499,999
- 68$500,000 to $749,999
- 8$750,000 to $999,999
- 25$1,000,000 to $1,499,999
Rent paid by renters in 2022 in Charlotte Harbor, FL
-
- 17$150 to $199
- 9$200 to $249
- 60$400 to $449
- 5$550 to $599
- 149$600 to $649
- 42$650 to $699
- 10$700 to $749
- 116$800 to $899
- 120$900 to $999
- 329$1,000 to $1,249
- 18$1,250 to $1,499
- 22$1,500 to $1,999
- 121$2,000 to $2,499
- 76$2,500 to $2,999
- 11$3,000 to $3,499
- 77$3,500 or more
- 89No cash rent


Percentage of workers working in this county: 86.6%
Number of people working at home: 86 (7.3% of all workers)

Travel time to work (commute)
- Less than 5 minutes: 88
- 5 to 9 minutes: 149
- 10 to 14 minutes: 174
- 15 to 19 minutes: 260
- 20 to 24 minutes: 127
- 25 to 29 minutes: 66
- 30 to 34 minutes: 42
- 35 to 39 minutes: 0
- 40 to 44 minutes: 18
- 45 to 59 minutes: 75
- 60 to 89 minutes: 55
- 90 or more minutes: 0
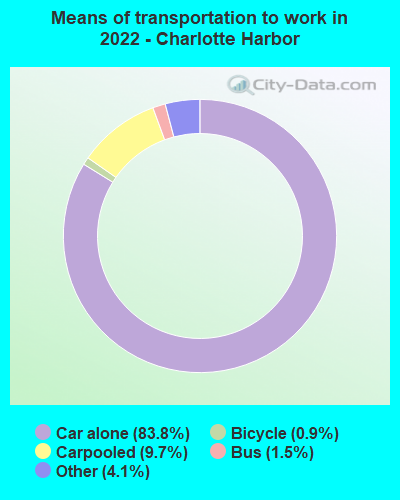
Means of transportation to work:
- Drove a car alone: 2,701 (77.3%)
- Carpooled: 331 (9.5%)
- Bus: 44 (1.3%)
- Taxi: 148 (4.2%)
- Bicycle: 30 (0.9%)
- Worked at home: 86 (2.5%)

- Unemployment by race in 2022
- Unemployment rate for White non-Hispanic residents
- 3.5%Males
- Unemployment rate for two or more race residents
- 23.2%Males
- 5.3%Females

- Year of entry for the foreign-born population in Charlotte Harbor, Florida
- 1412010 or later
- 162000 to 2009
- 161990 to 1999
- 211980 to 1989
- 81970 to 1979
- 118Before 1970

First ancestries reported:
- American: 596 (24.2%)
- English: 309 (12.6%)
- Italian: 309 (12.6%)
- Irish: 249 (10.1%)
- German: 215 (8.7%)
- Ukrainian: 63 (2.6%)
- French: 54 (2.2%)
- Dutch: 33 (1.3%)
- Eastern European: 27 (1.1%)
- Scotch-Irish: 24 (1.0%)
- Scottish: 24 (1.0%)
- Polish: 20 (0.8%)
- Haitian: 17 (0.7%)
- Lebanese: 12 (0.5%)
- French Canadian: 11 (0.4%)
- Russian: 9 (0.4%)
- Swiss: 9 (0.4%)
- Norwegian: 8 (0.3%)
- Swedish: 8 (0.3%)
- Romanian: 7 (0.3%)
- Armenian: 6 (0.2%)
- European: 6 (0.2%)
- Lithuanian: 6 (0.2%)
- Pennsylvania German: 6 (0.2%)
- British: 5 (0.2%)
- Finnish: 5 (0.2%)
Most common places of birth for foreign-born residents (%):
| Charlotte Harbor: | 25.7% (86) |
| Florida: | 1.2% (54,272) |
| Charlotte Harbor: | 23.7% (79) |
| Florida: | 2.4% (109,132) |
| Charlotte Harbor: | 10.2% (34) |
| Florida: | 22.0% (1,006,576) |
| Charlotte Harbor: | 8.4% (28) |
| Florida: | 0.8% (37,723) |
| Charlotte Harbor: | 6.6% (22) |
| Florida: | 7.5% (342,375) |
| Charlotte Harbor: | 4.2% (14) |
| Florida: | 0.7% (30,755) |
| Charlotte Harbor: | 3.0% (10) |
| Florida: | 0.7% (34,227) |
| Charlotte Harbor: | 2.7% (9) |
| Florida: | 6.5% (298,669) |
| Charlotte Harbor: | 2.1% (7) |
| Florida: | 0.1% (3,914) |
| Charlotte Harbor: | 2.1% (7) |
| Florida: | 0.3% (14,943) |
| Charlotte Harbor: | 2.1% (7) |
| Florida: | 2.1% (94,349) |
| Charlotte Harbor: | 2.1% (7) |
| Florida: | 1.3% (57,263) |
| Charlotte Harbor: | 1.8% (6) |
| Florida: | 0.2% (8,103) |
Place of birth for U.S.-born residents:
- This state: 1,148
- Other state: 3,251
- Northeast: 1,456
- Midwest: 1,043
- South: 510
- West: 240
74.7% of Charlotte Harbor residents lived in the same house 1 years ago.
Out of people who lived in different houses, 26.2% lived in this county.
Out of people who lived in different counties, 42.7% lived in Florida.
| Charlotte Harbor: | 74.7% |
| State average: | 86.3% |
Education attainment for males 25 years and older:
- No schooling: 17
- Nursery to 4th grade: 0
- 5th and 6th grade: 0
- 7th and 8th grade: 7
- 9th grade: 5
- 10th grade: 43
- 11th grade: 17
- 12th grade, no diploma: 41
- High school graduate (or equivalency): 723
- Less than 1 year of college: 149
- Some college more than 1 year, no degree: 299
- Associate degree: 82
- Bachelor's degree: 261
- Master's degree: 99
- Professional school degree: 54
- Doctorate degree: 0

Education attainment for females 25 years and older:
- No schooling: 8
- Nursery to 4th grade: 0
- 5th and 6th grade: 15
- 7th and 8th grade: 25
- 9th grade: 1
- 10th grade: 24
- 11th grade: 22
- 12th grade, no diploma: 25
- High school graduate (or equivalency): 880
- Less than 1 year of college: 122
- Some college more than 1 year, no degree: 325
- Associate degree: 199
- Bachelor's degree: 361
- Master's degree: 139
- Professional school degree: 40
- Doctorate degree: 44


Housing units in structures:
- One, detached: 684
- One, attached: 48
- Two: 100
- 3 or 4: 422
- 5 to 9: 345
- 10 to 19: 349
- 20 to 49: 134
- 50 or more: 725
- Mobile homes: 306
Median worth of mobile homes: $156,845
House/condo owner moved in on average 5 years ago
Renter moved in on average 1 years ago

- 90.3%Electricity
- 6.1%Utility gas
- 2.5%No fuel used
- 1.1%Bottled, tank, or LP gas
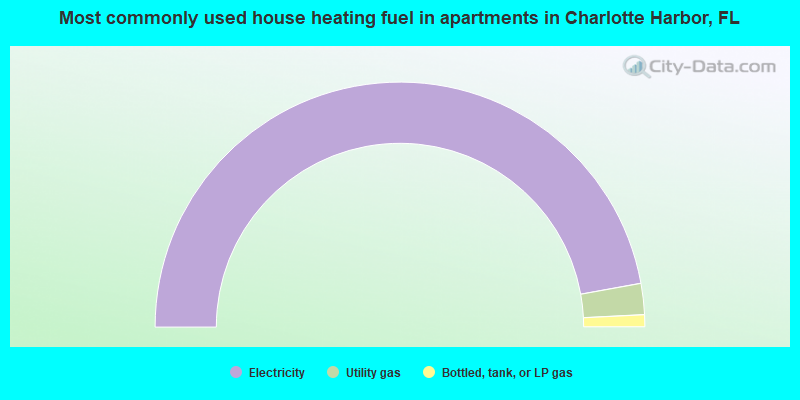
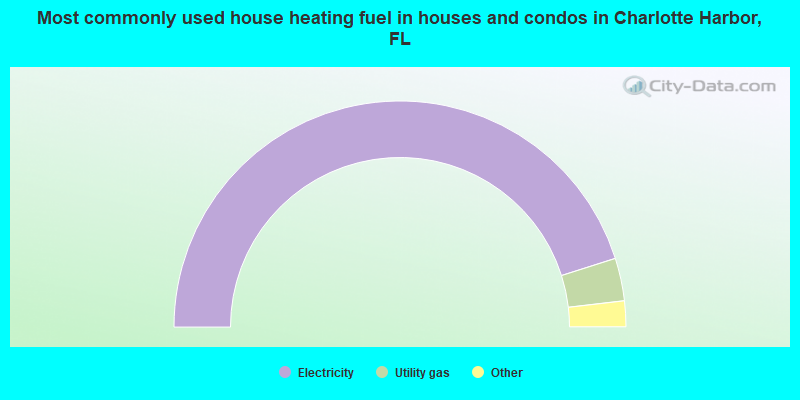
- 94.3%Electricity
- 4.1%Utility gas
- 1.6%Bottled, tank, or LP gas
Private vs. public school enrollment:
| Here: | 26.8% |
| Florida: | 15.8% |
| Here: | 0.0% |
| Florida: | 12.9% |
| Here: | 0.0% |
| Florida: | 23.6% |


