Charleston, AR (Arkansas) Houses and Residents
| Charleston: | $132,414 |
| Arkansas: | $179,800 |
Mean price in 2022:
Detached houses: $143,514
Here: $143,514 State: $243,881
Total population: 2,500 (Urban population: 0, Rural population: 2,990 (31 farm, 2,959 nonfarm))
Houses: 1,089 (1,023 occupied: 779 owner occupied, 264 renter occupied)
| % of renters here: | 25% |
| State: | 34% |
Housing density: 259 houses/condos per square mile
Median price asked for vacant for-sale houses and condos in 2022 in this county: $175,568.
Median contract rent in 2022: $522 (lower quartile is $377, upper quartile is $735)
Median rent asked for vacant for-rent units in 2022: $2,603
Median gross rent in Charleston, AR in 2022: $718
Housing units in Charleston with a mortgage: 458 (4 second mortgage, 0 home equity loan, 3 both second mortgage and home equity loan)
Houses without a mortgage: 0
Median household income for houses/condos with a mortgage: $90,311
Median household income for apartments without a mortgage: $60,518
Median monthly housing costs: $741
Compare current foreclosures near Charleston, AR:
| Photo | Address | Area | Beds / Baths | Price | Details |
|---|---|---|---|---|---|

|
#1
N Greenwood St
Charleston, AR 72933
|
1,232 sq. feet
|
1 baths 2 beds |
$27,900
|
show details |

|
#2
Lincoln Dr
Charleston, AR 72933
|
2,103 sq. feet
|
2 baths 3 beds |
show details | |

|
#3
Highway 22
Charleston, AR 72933
|
936 sq. feet
|
1 baths - beds |
show details | |

|
#4
S Hancock St
Charleston, AR 72933
|
1,450 sq. feet
|
1 baths - beds |
show details | |

|
#5
N Logan St
Charleston, AR 72933
|
2,085 sq. feet
|
1 baths - beds |
show details | |

|
#6
Ursula Rd
Charleston, AR 72933
|
- sq. feet
|
- baths - beds |
show details | |

|
#7
S 37th
Ozark, AR 72949
|
- sq. feet
|
2 baths 3 beds |
$88,800
|
show details |

|
#8
E 7th St
Booneville, AR 72927
|
1,124 sq. feet
|
1 baths 3 beds |
$99,900
|
show details |

|
#9
Dave Ann St
Booneville, AR 72927
|
1,092 sq. feet
|
1 baths 3 beds |
show details | |

|
#10
N Ulmer St
Greenwood, AR 72936
|
- sq. feet
|
2 baths 4 beds |
show details |
| Photo | Address | Area | Beds / Baths | Price | Details |
|---|---|---|---|---|---|

|
#11
Georgia Ridge Dr
Mulberry, AR 72947
|
1,260 sq. feet
|
2 baths 3 beds |
show details | |

|
#12
S Highway 23
Ozark, AR 72949
|
2,631 sq. feet
|
2 baths 4 beds |
show details | |

|
#13
Hidden Valley Way
Greenwood, AR 72936
|
- sq. feet
|
2 baths 4 beds |
show details | |

|
#14
Pecan Ln
Greenwood, AR 72936
|
1,568 sq. feet
|
2 baths - beds |
show details | |

|
#15
J St
Barling, AR 72923
|
1,633 sq. feet
|
2 baths - beds |
show details | |

|
#16
Easley Loop
Greenwood, AR 72936
|
1,074 sq. feet
|
1 baths - beds |
show details | |

|
#17
Daybreak Ln
Alma, AR 72921
|
1,823 sq. feet
|
2 baths - beds |
show details | |

|
#18
Short 10th St
Barling, AR 72923
|
2,203 sq. feet
|
2 baths - beds |
show details | |

|
#19
13th St
Barling, AR 72923
|
1,791 sq. feet
|
2 baths - beds |
show details | |

|
#20
Horizon Ln
Alma, AR 72921
|
1,772 sq. feet
|
2 baths - beds |
show details |
| Photo | Address | Area | Beds / Baths | Price | Details |
|---|---|---|---|---|---|

|
#21
Strozier Ln
Barling, AR 72923
|
1,750 sq. feet
|
2 baths - beds |
show details | |

|
#22
W State Highway 288
Ozark, AR 72949
|
1,720 sq. feet
|
1 baths - beds |
show details | |

|
#23
Grand Brook Dr
Greenwood, AR 72936
|
1,154 sq. feet
|
1 baths - beds |
show details | |

|
#24
River Vista Dr
Alma, AR 72921
|
2,307 sq. feet
|
2 baths - beds |
show details | |

|
#25
Old Harbor Rd
Fort Smith, AR 72903
|
1,920 sq. feet
|
2 baths - beds |
show details | |

|
#26
Hunters Point Rd
Fort Smith, AR 72903
|
2,615 sq. feet
|
3 baths - beds |
show details | |

|
#27
Angela Cir
Barling, AR 72923
|
1,458 sq. feet
|
1 baths - beds |
show details | |

|
#28
Eagle Crest Dr
Alma, AR 72921
|
2,947 sq. feet
|
3 baths - beds |
show details | |

|
#29
Wilder Ln
Alma, AR 72921
|
1,364 sq. feet
|
2 baths - beds |
show details | |

|
#30
Skypark Dr
Fort Smith, AR 72903
|
1,961 sq. feet
|
2 baths - beds |
show details |
| Photo | Address | Area | Beds / Baths | Price | Details |
|---|---|---|---|---|---|

|
#31
Ironwood Ln
Fort Smith, AR 72916
|
1,435 sq. feet
|
2 baths - beds |
show details | |

|
#32
Lee Cir
Fort Smith, AR 72903
|
1,429 sq. feet
|
2 baths - beds |
show details | |

|
#33
Beneux Bottom Rd
Mulberry, AR 72947
|
1,520 sq. feet
|
1 baths - beds |
show details | |

|
#34
Dayton Rd
Huntington, AR 72940
|
1,242 sq. feet
|
1 baths - beds |
show details | |

|
#35
Oak Hollow Ln
Fort Smith, AR 72903
|
3,856 sq. feet
|
5 baths - beds |
show details | |

|
#36
W Walnut St
Paris, AR 72855
|
1,232 sq. feet
|
1 baths - beds |
show details | |

|
#37
Rosewood Cir
Fort Smith, AR 72903
|
1,890 sq. feet
|
2 baths - beds |
show details | |

|
#38
Angela Cir
Barling, AR 72923
|
1,166 sq. feet
|
1 baths - beds |
show details | |

|
#39
Gary St
Fort Smith, AR 72903
|
1,534 sq. feet
|
1 baths - beds |
show details | |

|
#40
Woodland W
Ozark, AR 72949
|
2,220 sq. feet
|
2 baths - beds |
show details |
| Photo | Address | Area | Beds / Baths | Price | Details |
|---|---|---|---|---|---|

|
#41
S 96th St
Fort Smith, AR 72903
|
1,681 sq. feet
|
2 baths - beds |
show details | |

|
#42
Bushtown Rd
Alma, AR 72921
|
1,560 sq. feet
|
2 baths - beds |
show details | |

|
#43
S 99th St
Fort Smith, AR 72903
|
1,646 sq. feet
|
2 baths - beds |
show details | |

|
#44
Chippewa Trl
Greenwood, AR 72936
|
1,195 sq. feet
|
1 baths - beds |
show details | |

|
#45
Village Rd
Fort Smith, AR 72903
|
2,454 sq. feet
|
3 baths - beds |
show details | |

|
#46
Dogwood Loop
Alma, AR 72921
|
2,264 sq. feet
|
1 baths - beds |
show details | |

|
#47
6th Ter
Barling, AR 72923
|
1,312 sq. feet
|
1 baths - beds |
show details | |

|
#48
High Meadow Ln
Alma, AR 72921
|
2,128 sq. feet
|
2 baths - beds |
show details | |

|
#49
E Center St
Greenwood, AR 72936
|
1,075 sq. feet
|
1 baths - beds |
show details | |

|
Check over 1 million property listings on Foreclosure.com!
|
browse all offers | |||

Latest news about housing in Charleston, AR collected exclusively by city-data.com from local newspapers, TV, and radio stations

 | Possibly Relocating to Bentonville, AR (8 replies) |
| Berryville, Arkansas?? (13 replies) |
| Good eats (33 replies) |
| How welcoming are Arkansas residents to people wishing to relocate there? (95 replies) |
| Best place to live in Arkansas? (476 replies) |
| Rebel Flags, Gun Racks, Primer-Painted Camaros? (75 replies) |

Median year apartment built: 1993
Household type by relationship:
Households: 2,608- Male householders: 452 (122 living alone), Female householders: 562 (164 living alone)
469 spouses (463 opposite-sex spouses), 68 unmarried partners, (68 opposite-sex unmarried partners), 793 children (704 natural, 73 adopted, 15 stepchildren), 81 grandchildren, 0 brothers or sisters, 29 parents, 0 foster children, 19 other relatives, 24 non-relatives
- In group quarters: 107
Size of family households: 310 2-persons, 173 3-persons, 109 4-persons, 26 5-persons, 35 6-persons, 24 7-or-more-persons.
Size of nonfamily households: 310 1-person, 54 2-persons.
331 married couples with children.
136 single-parent households (14 men, 122 women).
98.7% of residents of Charleston speak English at home.
0.5% of residents speak other Indo-European language at home (100% speak English very well).
0.4% of residents speak Asian or Pacific Island language at home (100% speak English well).
Foreign born population: 30 (1.2%)
(33.3% of them are naturalized citizens)
| Here: | 6.1 |
| State: | 6.1 |
| Here: | 4.0 |
| State: | 4.3 |

- Bedrooms in owner-occupied houses and condos in Charleston, Arkansas
- 0no bedroom
- 71 bedroom
- 1252 bedrooms
- 5173 bedrooms
- 1154 bedrooms
- 165+ bedrooms

- Bedrooms in renter-occupied apartments in Charleston, Arkansas
- 17no bedroom
- 721 bedroom
- 1332 bedrooms
- 443 bedrooms
- 04 bedrooms
- 05+ bedrooms

- Cars and other vehicles available in Charleston in owner-occupied houses/condos
- 11no vehicle
- 1791 vehicle
- 4182 vehicles
- 1533 vehicles
- 104 vehicles
- 85+ vehicles

- Cars and other vehicles available in Charleston in renter-occupied apartments
- 7no vehicle
- 1461 vehicle
- 852 vehicles
- 163 vehicles
- 104 vehicles
- 05+ vehicles

- Rooms in owner-occupied houses in Charleston, Arkansas
- 01 room
- 02 rooms
- 233 rooms
- 344 rooms
- 1805 rooms
- 2476 rooms
- 997 rooms
- 1268 rooms
- 729+ rooms

- Rooms in renter-occupied apartments in Charleston, Arkansas
- 171 room
- 82 rooms
- 503 rooms
- 944 rooms
- 455 rooms
- 446 rooms
- 07 rooms
- 78 rooms
- 09+ rooms


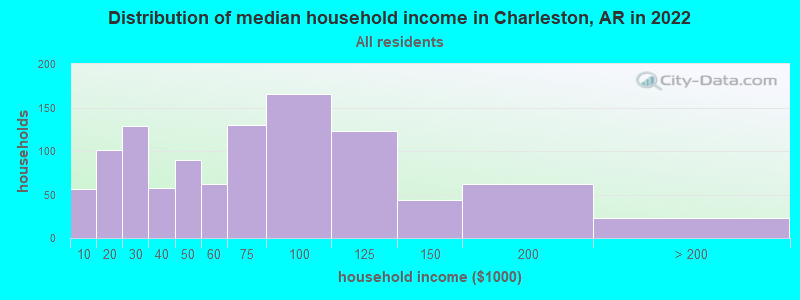
Charleston, AR household income distribution

- 56Less than $10,000
- 101$10,000 to $19,999
- 129$20,000 to $29,999
- 58$30,000 to $39,999
- 90$40,000 to $49,999
- 62$50,000 to $59,999
- 130$60,000 to $74,999
- 166$75,000 to $99,999
- 123$100,000 to $124,999
- 44$125,000 to $149,999
- 62$150,000 to $199,999
- 23$200,000 or more
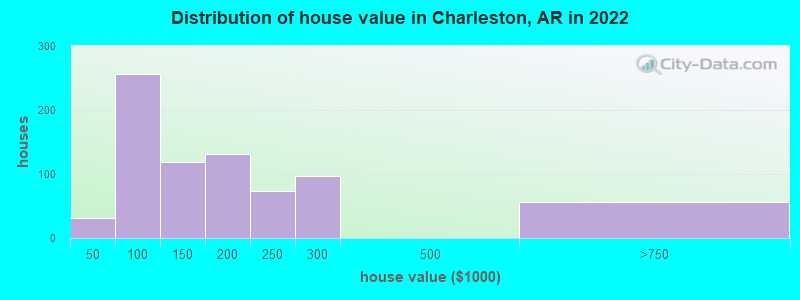
Home value of owner - occupied houses in 2022 in Charleston, AR
-
- 9Less than $10,000
- 2$15,000 to $19,999
- 19$40,000 to $49,999
- 51$50,000 to $59,999
- 6$60,000 to $69,999
- 51$70,000 to $79,999
- 84$80,000 to $89,999
- 42$90,000 to $99,999
- 91$100,000 to $124,999
- 27$125,000 to $149,999
- 99$150,000 to $174,999
- 32$175,000 to $199,999
- 73$200,000 to $249,999
- 97$250,000 to $299,999
- 56$500,000 to $749,999
Rent paid by renters in 2022 in Charleston, AR
-
- 1Less than $100
- 5$100 to $149
- 6$150 to $199
- 7$200 to $249
- 18$250 to $299
- 4$300 to $349
- 19$350 to $399
- 3$400 to $449
- 31$450 to $499
- 25$500 to $549
- 1$550 to $599
- 4$600 to $649
- 45$700 to $749
- 15$900 to $999
- 29$1,250 to $1,499
- 32No cash rent


Percentage of workers working in this county: 35.9%
Number of people working at home: 84 (6.9% of all workers)
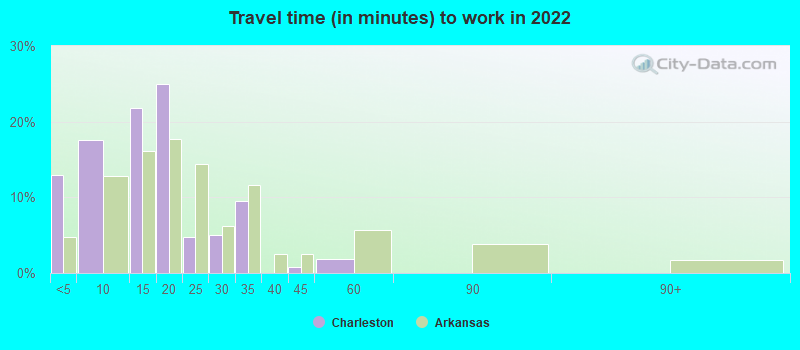
Travel time to work (commute)
- Less than 5 minutes: 102
- 5 to 9 minutes: 98
- 10 to 14 minutes: 85
- 15 to 19 minutes: 64
- 20 to 24 minutes: 74
- 25 to 29 minutes: 54
- 30 to 34 minutes: 227
- 35 to 39 minutes: 74
- 40 to 44 minutes: 148
- 45 to 59 minutes: 135
- 60 to 89 minutes: 18
- 90 or more minutes: 37
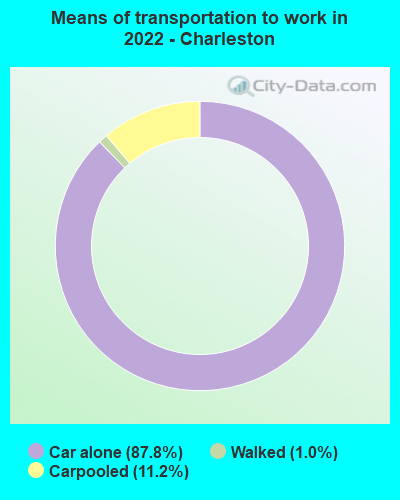
Means of transportation to work:
- Drove a car alone: 540 (78.7%)
- Carpooled: 60 (8.7%)
- Walked: 6 (0.9%)
- Worked at home: 84 (12.2%)

- Unemployment by race in 2022
- Unemployment rate for White non-Hispanic residents
- 3.3%Males
- 3.2%Females
- Unemployment rate for two or more race residents
- 10.4%Males
- 6.8%Females

- Year of entry for the foreign-born population in Charleston, Arkansas
- 152010 or later
- 102000 to 2009
- 01990 to 1999
- 31980 to 1989
- 111970 to 1979
- 6Before 1970

First ancestries reported:
- American: 659 (46.7%)
- German: 157 (11.1%)
- Irish: 109 (7.7%)
- English: 105 (7.4%)
- European: 35 (2.5%)
- Scotch-Irish: 15 (1.1%)
- Canadian: 14 (1.0%)
- Dutch: 13 (0.9%)
- Norwegian: 4 (0.3%)
- Polish: 4 (0.3%)
Most common places of birth for foreign-born residents (%):
| Charleston: | 36.7% (11) |
| Arkansas: | 2.7% (4,128) |
| Charleston: | 20.0% (6) |
| Arkansas: | 0.1% (205) |
| Charleston: | 20.0% (6) |
| Arkansas: | 1.2% (1,813) |
| Charleston: | 13.3% (4) |
| Arkansas: | 1.8% (2,721) |
Place of birth for U.S.-born residents:
- This state: 1,769
- Other state: 794
- Northeast: 98
- Midwest: 90
- South: 335
- West: 276
91.4% of Charleston residents lived in the same house 1 years ago.
Out of people who lived in different houses, 31.4% lived in this county.
Out of people who lived in different counties, 78.3% lived in Arkansas.
| Charleston: | 91.4% |
| State average: | 87.0% |
Education attainment for males 25 years and older:
- No schooling: 11
- Nursery to 4th grade: 0
- 5th and 6th grade: 0
- 7th and 8th grade: 0
- 9th grade: 2
- 10th grade: 4
- 11th grade: 21
- 12th grade, no diploma: 7
- High school graduate (or equivalency): 235
- Less than 1 year of college: 84
- Some college more than 1 year, no degree: 94
- Associate degree: 117
- Bachelor's degree: 140
- Master's degree: 7
- Professional school degree: 14
- Doctorate degree: 0

Education attainment for females 25 years and older:
- No schooling: 8
- Nursery to 4th grade: 0
- 5th and 6th grade: 0
- 7th and 8th grade: 0
- 9th grade: 5
- 10th grade: 23
- 11th grade: 23
- 12th grade, no diploma: 36
- High school graduate (or equivalency): 430
- Less than 1 year of college: 78
- Some college more than 1 year, no degree: 88
- Associate degree: 82
- Bachelor's degree: 180
- Master's degree: 57
- Professional school degree: 7
- Doctorate degree: 24


Housing units in structures:
- One, detached: 886
- One, attached: 32
- Two: 4
- 3 or 4: 89
- 5 to 9: 11
- 10 to 19: 30
- 20 to 49: 6
- Mobile homes: 29
Housing units lacking complete kitchen facilities in 2022: 1.5%
House/condo owner moved in on average 14 years ago
Renter moved in on average 3 years ago

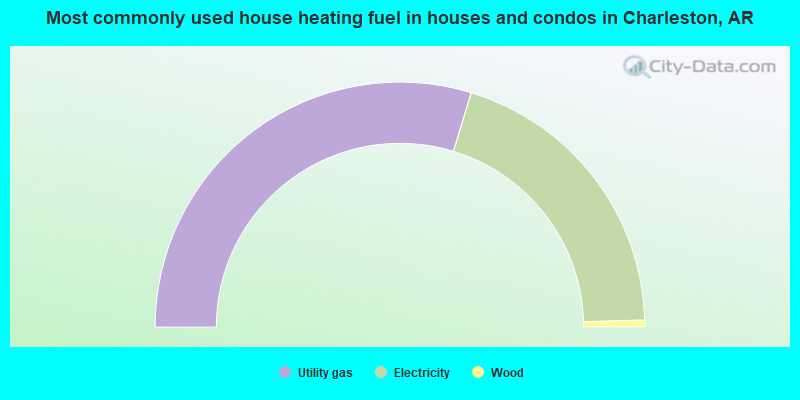
- 59.4%Utility gas
- 39.7%Electricity
- 0.9%Wood
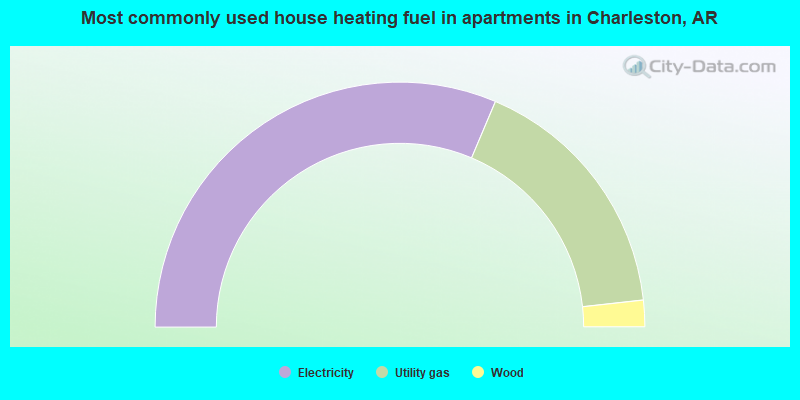
- 62.7%Electricity
- 33.7%Utility gas
- 3.5%Wood
Private vs. public school enrollment:
| Here: | 22.0% |
| Arkansas: | 10.5% |
| Here: | 1.1% |
| Arkansas: | 8.7% |
| Here: | 10.9% |
| Arkansas: | 19.4% |


