Charlemont, MA (Massachusetts) Houses and Residents
| Charlemont: | $282,564 |
| Massachusetts: | $534,700 |
Total population: 1,266 (Urban population: 0, Rural population: 1,391 (12 farm, 1,379 nonfarm))
Houses: 631 (541 occupied: 393 owner occupied, 148 renter occupied)
| % of renters here: | 27% |
| State: | 38% |
Housing density: 24 houses/condos per square mile
Median price asked for vacant for-sale houses and condos in 2022 in this county: $191,319.
Median contract rent in 2022: $776 (lower quartile is $495, upper quartile is $1,140)
Median rent asked for vacant for-rent units in 2022: $734
Median gross rent in Charlemont, MA in 2022: $911
Housing units in Charlemont with a mortgage: 176 (20 second mortgage, 9 home equity loan, 0 both second mortgage and home equity loan)
Houses without a mortgage: 88
Compare current foreclosures near Charlemont, MA:
| Photo | Address | Area | Beds / Baths | Price | Details |
|---|---|---|---|---|---|

|
#1
Tea St
Charlemont, MA 01339
|
2,829 sq. feet
|
2 baths 6 beds |
show details | |

|
#2
Legate Hill Rd
Charlemont, MA 01339
|
2,016 sq. feet
|
2 baths 3 beds |
show details | |

|
#3
N Route 8a
Charlemont, MA 01339
|
- sq. feet
|
- baths - beds |
show details | |

|
#4
Lampblack Rd
Greenfield, MA 01301
|
2,078 sq. feet
|
1 baths 3 beds |
$369,900
|
show details |

|
#5
Elmwood Ave
North Adams, MA 01247
|
2,777 sq. feet
|
3 baths 5 beds |
$215,000
|
show details |

|
#6
J St
Turners Falls, MA 01376
|
3,256 sq. feet
|
2 baths 7 beds |
show details | |

|
#7
Houghton St
North Adams, MA 01247
|
1,614 sq. feet
|
2 baths 4 beds |
show details | |

|
#8
Franklin St
North Adams, MA 01247
|
1,386 sq. feet
|
1 baths 3 beds |
show details | |

|
#9
North St
North Adams, MA 01247
|
1,164 sq. feet
|
1 baths 3 beds |
show details | |

|
#10
Barbour St
North Adams, MA 01247
|
1,224 sq. feet
|
1 baths 2 beds |
show details |
| Photo | Address | Area | Beds / Baths | Price | Details |
|---|---|---|---|---|---|

|
#11
Arnold Ct
Cheshire, MA 01225
|
1,600 sq. feet
|
2 baths 2 beds |
show details | |

|
#12
Sabans Rd
Conway, MA 01341
|
1,246 sq. feet
|
2 baths 3 beds |
show details | |

|
#13
Grove St
Adams, MA 01220
|
2,644 sq. feet
|
2 baths 7 beds |
show details | |

|
#14
Hillcrest Dr
Bernardston, MA 01337
|
1,120 sq. feet
|
1 baths 3 beds |
show details | |

|
#15
Dell St
Turners Falls, MA 01376
|
720 sq. feet
|
1 baths 1 beds |
show details | |

|
#16
Chapman St
Greenfield, MA 01301
|
1,472 sq. feet
|
1 baths 2 beds |
show details | |

|
#17
Houghton St
North Adams, MA 01247
|
3,380 sq. feet
|
3 baths 5 beds |
show details | |

|
#18
N Main St
South Deerfield, MA 01373
|
2,143 sq. feet
|
1 baths 5 beds |
show details | |

|
#19
W Mountain Rd
Adams, MA 01220
|
1,173 sq. feet
|
1 baths 3 beds |
show details | |

|
#20
Grove St
Turners Falls, MA 01376
|
2,273 sq. feet
|
1 baths 4 beds |
show details |
| Photo | Address | Area | Beds / Baths | Price | Details |
|---|---|---|---|---|---|

|
#21
Garfield St
Greenfield, MA 01301
|
2,260 sq. feet
|
2 baths 4 beds |
show details | |

|
#22
Central St
Turners Falls, MA 01376
|
1,506 sq. feet
|
1 baths 3 beds |
show details | |

|
#23
Forest Ave
Greenfield, MA 01301
|
1,764 sq. feet
|
1 baths 4 beds |
show details | |

|
#24
North St
North Adams, MA 01247
|
1,164 sq. feet
|
1 baths 3 beds |
show details | |

|
#25
David Dr
Hinsdale, MA 01235
|
1,664 sq. feet
|
2 baths 3 beds |
show details | |

|
#26
J Street
Montague, MA Array
|
3,255 sq. feet
|
2 baths 7 beds |
show details | |

|
#27
Hope St
Greenfield, MA 01301
|
1,619 sq. feet
|
1 baths 3 beds |
show details | |

|
#28
Deerfield St
Greenfield, MA 01301
|
1,496 sq. feet
|
2 baths 3 beds |
show details | |

|
#29
James St
Greenfield, MA 01301
|
2,176 sq. feet
|
2 baths 4 beds |
show details | |

|
#30
Old North Rd
Worthington, MA 01098
|
2,369 sq. feet
|
3 baths 4 beds |
show details |
| Photo | Address | Area | Beds / Baths | Price | Details |
|---|---|---|---|---|---|

|
#31
Maple St
Greenfield, MA 01301
|
1,216 sq. feet
|
1 baths 3 beds |
show details | |

|
#32
5th St
Turners Falls, MA 01376
|
1,683 sq. feet
|
2 baths 4 beds |
show details | |

|
#33
Log Plain Rd
Greenfield, MA 01301
|
960 sq. feet
|
1 baths 3 beds |
show details | |

|
#34
French King Hwy
Greenfield, MA 01301
|
1,040 sq. feet
|
1 baths 5 beds |
show details | |

|
#35
Meridian St
Greenfield, MA 01301
|
768 sq. feet
|
1 baths 2 beds |
show details | |

|
#36
Braeburn Rd
South Deerfield, MA 01373
|
1,661 sq. feet
|
1 baths 3 beds |
show details | |

|
#37
Jacksonville Rd
Colrain, MA 01340
|
1,108 sq. feet
|
1 baths 2 beds |
show details | |

|
#38
W Shaft Rd
North Adams, MA 01247
|
1,144 sq. feet
|
1 baths 3 beds |
show details | |

|
#39
Anthony St # B
Adams, MA 01220
|
1,622 sq. feet
|
2 baths 3 beds |
show details | |

|
#40
Richmond St
Adams, MA 01220
|
1,920 sq. feet
|
2 baths 4 beds |
show details |
| Photo | Address | Area | Beds / Baths | Price | Details |
|---|---|---|---|---|---|

|
#41
Elm St
Greenfield, MA 01301
|
1,160 sq. feet
|
1 baths 3 beds |
show details | |

|
#42
Church Rd
Drury, MA 01343
|
2,560 sq. feet
|
2 baths 4 beds |
show details | |

|
#43
Mohawk Trl
North Adams, MA 01247
|
1,210 sq. feet
|
1 baths 3 beds |
show details | |

|
#44
Weber St # 12
Adams, MA 01220
|
1,728 sq. feet
|
2 baths 4 beds |
show details | |

|
#45
Phelps Rd
North Adams, MA 01247
|
1,286 sq. feet
|
1 baths 4 beds |
show details | |

|
#46
Rte 9
Windsor, MA 01270
|
1,223 sq. feet
|
1 baths 2 beds |
show details | |

|
#47
Daniels Ct
Adams, MA 01220
|
1,400 sq. feet
|
1 baths 3 beds |
show details | |

|
#48
Franklin St
North Adams, MA 01247
|
1,386 sq. feet
|
1 baths 3 beds |
show details | |

|
#49
Shelburne Rd
Greenfield, MA 01301
|
1,382 sq. feet
|
1 baths 2 beds |
show details | |

|
Check over 1 million property listings on Foreclosure.com!
|
browse all offers | |||
Latest news about housing in Charlemont, MA collected exclusively by city-data.com from local newspapers, TV, and radio stations


Household type by relationship:
Households: 69,891- In family households: 54,236 (12,210 male householders, 6,107 female householders)
13,655 spouses, 17,750 children (16,448 natural, 543 adopted, 759 stepchildren), 917 grandchildren, 418 brothers or sisters, 464 parents, foster children, 409 other relatives, 1,987 non-relatives
- In nonfamily households: 15,655 (5,446 male householders (3,978 living alone)), 6,699 female householders (5,318 living alone)), 3,510 nonrelatives
- In group quarters: 1,481 (665 institutionalized population)
11,122 married couples with children.
4,422 single-parent households (1,025 men, 3,397 women).
94.2% of residents of Charlemont speak English at home.
2.6% of residents speak Spanish at home (56% speak English very well, 24% speak English well, 18% speak English not well, 3% don't speak English at all).
2.5% of residents speak other Indo-European language at home (64% speak English very well, 24% speak English well, 12% speak English not well).
0.5% of residents speak Asian or Pacific Island language at home (100% speak English very well).
0.2% of residents speak other language at home (100% speak English very well).
Foreign born population: 56 (4.1%)
(53.6% of them are naturalized citizens)
| Here: | 6.4 |
| State: | 6.5 |
| Here: | 4.0 |
| State: | 4.0 |

- Bedrooms in owner-occupied houses and condos in Charlemont, Massachusetts
- 0no bedroom
- 121 bedroom
- 892 bedrooms
- 1873 bedrooms
- 604 bedrooms
- 455+ bedrooms

- Bedrooms in renter-occupied apartments in Charlemont, Massachusetts
- 2no bedroom
- 331 bedroom
- 702 bedrooms
- 243 bedrooms
- 124 bedrooms
- 75+ bedrooms

- Cars and other vehicles available in Charlemont in owner-occupied houses/condos
- 7no vehicle
- 1071 vehicle
- 1862 vehicles
- 793 vehicles
- 124 vehicles
- 25+ vehicles

- Cars and other vehicles available in Charlemont in renter-occupied apartments
- 14no vehicle
- 721 vehicle
- 552 vehicles
- 73 vehicles
- 04 vehicles
- 05+ vehicles

- Rooms in owner-occupied houses in Charlemont, Massachusetts
- 01 room
- 22 rooms
- 103 rooms
- 424 rooms
- 805 rooms
- 806 rooms
- 707 rooms
- 438 rooms
- 669+ rooms

- Rooms in renter-occupied apartments in Charlemont, Massachusetts
- 21 room
- 112 rooms
- 203 rooms
- 374 rooms
- 375 rooms
- 256 rooms
- 27 rooms
- 78 rooms
- 79+ rooms


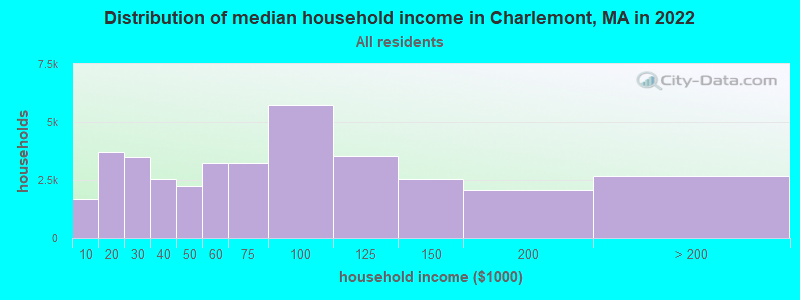
Charlemont, MA household income distribution

- 1,697Less than $10,000
- 3,720$10,000 to $19,999
- 3,482$20,000 to $29,999
- 2,542$30,000 to $39,999
- 2,226$40,000 to $49,999
- 3,252$50,000 to $59,999
- 3,224$60,000 to $74,999
- 5,742$75,000 to $99,999
- 3,538$100,000 to $124,999
- 2,553$125,000 to $149,999
- 2,052$150,000 to $199,999
- 2,672$200,000 or more
Percentage of workers working in this county: 88.2%
Number of people working at home: 151 (18.4% of all workers)
Travel time to work (commute)
- Less than 5 minutes: 70
- 5 to 9 minutes: 82
- 10 to 14 minutes: 45
- 15 to 19 minutes: 61
- 20 to 24 minutes: 58
- 25 to 29 minutes: 40
- 30 to 34 minutes: 131
- 35 to 39 minutes: 17
- 40 to 44 minutes: 33
- 45 to 59 minutes: 83
- 60 to 89 minutes: 38
- 90 or more minutes: 33
Means of transportation to work:
- Drove a car alone: 531 (73.0%)
- Carpooled: 95 (13.1%)
- Bus or trolley bus: 3 (0.4%)
- Walked: 60 (8.3%)
- Other means: 2 (0.3%)
- Worked at home: 36 (5.0%)


- Year of entry for the foreign-born population in Charlemont, Massachusetts
- 131995 to March 2000
- 01990 to 1994
- 01985 to 1989
- 21980 to 1984
- 61975 to 1979
- 21970 to 1974
- 01965 to 1969
- 13Before 1965

First ancestries reported:
- Irish: 261 (14.4%)
- English: 251 (13.9%)
- Other: 191 (10.6%)
- French: 183 (10.1%)
- German: 143 (7.9%)
- Polish: 133 (7.3%)
- United States: 117 (6.5%)
- French Canadian: 88 (4.9%)
- Italian: 87 (4.8%)
- Scottish: 71 (3.9%)
- Scotch-Irish: 45 (2.5%)
- Swedish: 45 (2.5%)
- Portuguese: 36 (2.0%)
- Russian: 29 (1.6%)
- Dutch: 28 (1.5%)
- Norwegian: 16 (0.9%)
- Czech: 15 (0.8%)
- Ukrainian: 15 (0.8%)
- Greek: 14 (0.8%)
- Hungarian: 12 (0.7%)
- Lithuanian: 12 (0.7%)
- Danish: 6 (0.3%)
- Swiss: 5 (0.3%)
- Welsh: 5 (0.3%)
- Subsaharan African: 2 (0.1%)
Most common places of birth for foreign-born residents (%):
| Charlemont: | 16.7% (6) |
| Massachusetts: | 3.3% (25,403) |
| Charlemont: | 16.7% (6) |
| Massachusetts: | 1.8% (13,801) |
| Charlemont: | 16.7% (6) |
| Massachusetts: | 4.7% (36,669) |
| Charlemont: | 8.3% (3) |
| Massachusetts: | 0.2% (1,303) |
| Charlemont: | 8.3% (3) |
| Massachusetts: | 0.6% (4,578) |
| Charlemont: | 8.3% (3) |
| Massachusetts: | 5.2% (40,247) |
| Charlemont: | 5.6% (2) |
| Massachusetts: | 0.2% (1,710) |
| Charlemont: | 5.6% (2) |
| Massachusetts: | 2.3% (17,449) |
| Charlemont: | 5.6% (2) |
| Massachusetts: | 1.1% (8,682) |
| Charlemont: | 5.6% (2) |
| Massachusetts: | 0.4% (2,780) |
Place of birth for U.S.-born residents:
- This state: 989
- Other state: 349
- Northeast: 216
- Midwest: 70
- South: 38
- West: 25
64% of Charlemont residents lived in the same house 5 years ago.
Out of people who lived in different houses, 70% lived in this county.
Out of people who lived in different counties, 57% lived in Massachusetts.
Education attainment for males 25 years and older:
- No schooling: 2
- Nursery to 4th grade: 0
- 5th and 6th grade: 4
- 7th and 8th grade: 7
- 9th grade: 9
- 10th grade: 6
- 11th grade: 5
- 12th grade, no diploma: 15
- High school graduate (or equivalency): 156
- Less than 1 year of college: 23
- Some college more than 1 year, no degree: 55
- Associate degree: 32
- Bachelor's degree: 75
- Master's degree: 40
- Professional school degree: 7
- Doctorate degree: 4

Education attainment for females 25 years and older:
- No schooling: 0
- Nursery to 4th grade: 0
- 5th and 6th grade: 6
- 7th and 8th grade: 7
- 9th grade: 4
- 10th grade: 13
- 11th grade: 8
- 12th grade, no diploma: 9
- High school graduate (or equivalency): 129
- Less than 1 year of college: 50
- Some college more than 1 year, no degree: 77
- Associate degree: 53
- Bachelor's degree: 98
- Master's degree: 42
- Professional school degree: 5
- Doctorate degree: 2


Housing units in structures:
- One, detached: 463
- One, attached: 17
- Two: 41
- 3 or 4: 31
- 5 to 9: 11
- 10 to 19: 15
- 20 to 49: 4
- Mobile homes: 49
Median worth of mobile homes: $38,046
Housing units lacking complete kitchen facilities: 1.1%

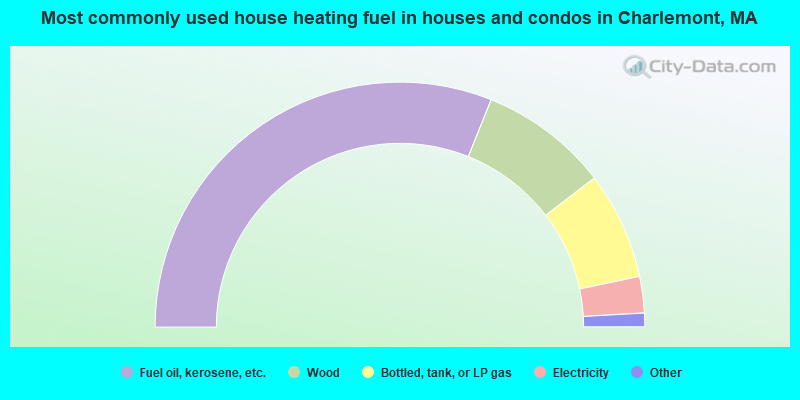
- 62.1%Fuel oil, kerosene, etc.
- 17.0%Wood
- 14.2%Bottled, tank, or LP gas
- 4.8%Electricity
- 0.8%Other fuel
- 0.5%Utility gas
- 0.5%Coal or coke
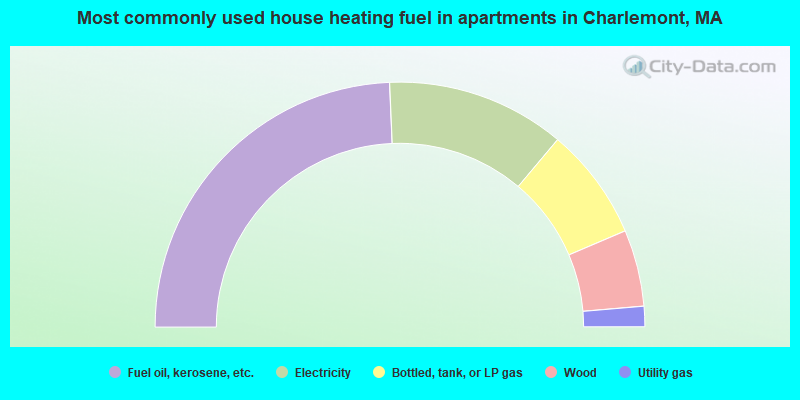
- 48.6%Fuel oil, kerosene, etc.
- 23.6%Electricity
- 14.9%Bottled, tank, or LP gas
- 10.1%Wood
- 2.7%Utility gas
Private vs. public school enrollment:
| Here: | 6.5% |
| Massachusetts: | 10.8% |
| Here: | 12.0% |
| Massachusetts: | 12.2% |
| Here: | 19.6% |
| Massachusetts: | 48.2% |


