Chapel Hill, NC (North Carolina) Houses and Residents
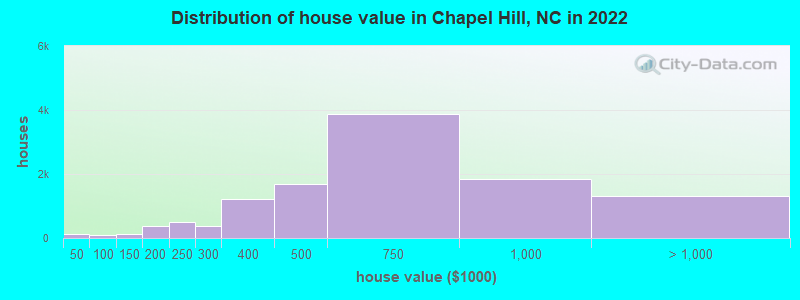
Estimated median house or condo value in 2022: $604,034 (it was $217,300 in 2000 )
Chapel Hill:
$604,034North Carolina:
$280,600
Lower value quartile - upper value quartile: $418,812 - $801,544Mean price in 2022: Detached houses: $702,061 Here:
$702,061State:
$375,326
Townhouses or other attached units: $515,011 Here:
$515,011State:
$317,935
In 2-unit structures: $214,387 Here:
$214,387State:
$250,488
In 3-to-4-unit structures: $326,329 Here:
$326,329State:
$254,939
In 5-or-more-unit structures: $475,097 Here:
$475,097State:
$329,290
Mobile homes: $139,008 Here:
$139,008State:
$124,933
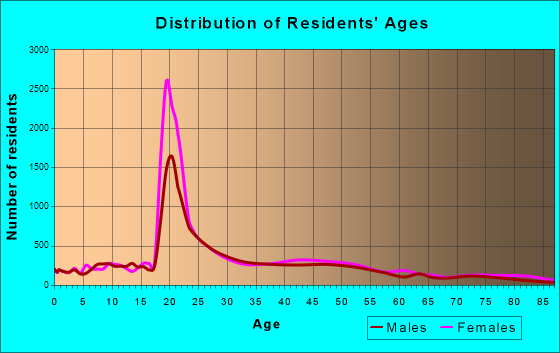
Total population: 59,376 (Urban population: 48,366, Rural population: 430 (all nonfarm) )
Houses: 22,928 (20,439 occupied: 10,430 owner occupied, 10,438 renter occupied )
% of renters here:
50%State:
33%
Housing density: 1,161 houses/condos per square mile
Median price asked for vacant for-sale houses and condos in 2022: $727,333.
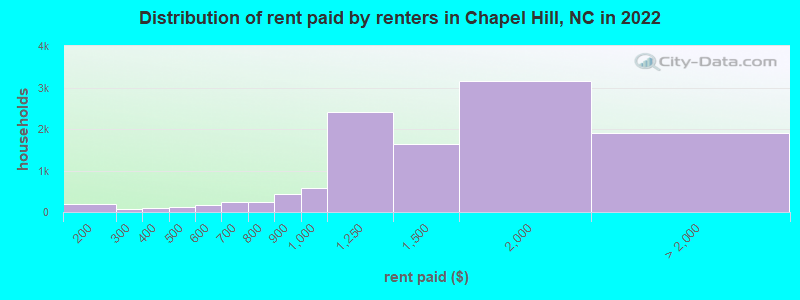
Median contract rent in 2022: $1,391 (lower quartile is $1,152, upper quartile is $1,916)
Median rent asked for vacant for-rent units in 2022: $1,116
Median gross rent in Chapel Hill, NC in 2022: $1,553
Housing units in Chapel Hill with a mortgage: 6,254 (684 second mortgage, 0 home equity loan, 694 both second mortgage and home equity loan )Houses without a mortgage: 175
Median household income for houses/condos with a mortgage: $191,577
Median household income for apartments without a mortgage: $141,727
Median monthly housing costs: $1,498
Data:
Median house or condo value ($)
Median house or condo value ($ change since 2000)
Median house or condo value ($) - White
Median house or condo value ($) - Black or African American
Median house or condo value ($) - Asian
Median house or condo value ($) - Hispanic or Latino
Median house or condo value ($) - American Indian and Alaska Native
Median house or condo value ($) - Multirace
Median house or condo value ($) - Other Race
Median price asked for mobile homes ($)
Household density (households per square mile)
Mean house or condo value by units in structure - 1, detached ($)
Mean house or condo value by units in structure - 1, attached ($)
Mean house or condo value by units in structure - 2 ($)
Mean house or condo value by units in structure by units in structure - 3 or 4 ($)
Mean house or condo value by units in structure - 5 or more ($)
Mean house or condo value by units in structure - Boat, RV, van, etc. ($)
Mean house or condo value by units in structure - Mobile home ($)
Median contract rent ($)
Median contract rent - Lower quartile ($)
Median contract rent - Upper quartile ($)
Median gross rent ($)
Urban houses (%)
Rural houses (%)
Houses occupied (%)
Houses occupied (% change since 2000)
Houses owner occupied (%)
Houses owner occupied (% change since 2000)
Houses renter occupied (%)
Houses renter occupied (% change since 2000)
Vacant housing units - For rent (%)
Vacant housing units - For rent (% change since 2000)
Vacant housing units - For sale only (%)
Vacant housing units - For sale only (% change since 2000)
Vacant housing units - Rented or sold, not occupied (%)
Vacant housing units - Rented or sold, not occupied (% change since 2000)
Vacant housing units - For seasonal, recreational, or occasional use (%)
Vacant housing units - For seasonal, recreational, or occasional use (% change since 2000)
Vacant housing units - For migrant workers (%)
Vacant housing units - For migrant workers (% change since 2000)
Vacant housing units - Other vacant (%)
Vacant housing units - Other vacant (% change since 2000)
Median monthly housing costs ($)
Median household income for houses/condos with a mortgage ($)
Median household income for houses/condos without a mortgage ($)
Median household income ($)
Median household income ($) - White
Median household income ($) - Black or African American
Median household income ($) - Asian
Median household income ($) - Hispanic or Latino
Median household income ($) - American Indian and Alaska Native
Median household income ($) - Multirace
Median household income ($) - Other Race
Mortgage status - with mortgage (%)
Mortgage status - with second mortgage (%)
Mortgage status - with home equity loan (%)
Mortgage status - with both second mortgage and home equity loan (%)
Mortgage status - without a mortgage (%)
Median year house/condo built
Median year apartment built
Household type by relationship - Male householder living alone (%)
Household type by relationship - Male householder not living alone (%)
Household type by relationship - Female householder living alone (%)
Household type by relationship - Female householder not living alone (%)
Household type by relationship - Opposite-Sex spouse (%)
Household type by relationship - Same-Sex spouse (%)
Household type by relationship - Opposite-Sex unmarried partner (%)
Household type by relationship - Same-Sex unmarried partner (%)
Household type by relationship - In group quarters (%)
Size of family households - 2-person household (%)
Size of family households - 3-person household (%)
Size of family households - 4-person household (%)
Size of family households - 5-person household (%)
Size of family households - 6-person household (%)
Size of family households - 7-or-more-person household (%)
Size of nonfamily households - 1-person household (%)
Size of nonfamily households - 2-person household (%)
Size of nonfamily households - 3-person household (%)
Size of nonfamily households - 4-person household (%)
Size of nonfamily households - 5-person household (%)
Size of nonfamily households - 6-person household (%)
Size of nonfamily households - 7-or-moreperson household (%)
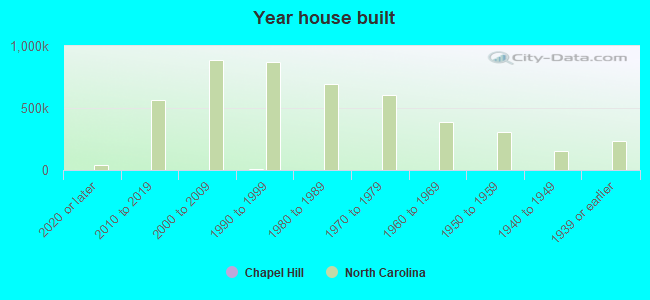
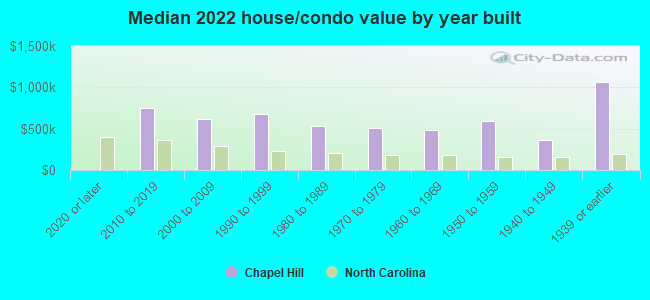
Year house built - Built 2010 or later (%)
Year house built - Built 2000 to 2009 (%)
Year house built - Built 1990 to 1999 (%)
Year house built - Built 1980 to 1989 (%)
Year house built - Built 1970 to 1979 (%)
Year house built - Built 1960 to 1969 (%)
Year house built - Built 1950 to 1959 (%)
Year house built - Built 1940 to 1949 (%)
Year house built - Built 1939 or earlier (%)
Median number of rooms in houses and condos
Median number of rooms in apartments
Median number of bedrooms in owner occupied houses
Mean number of bedrooms in owner occupied houses
Median number of bedrooms in renter occupied houses
Mean number of bedrooms in renter occupied houses
Median number of vehichles in owner occupied houses
Mean number of vehichles in owner occupied houses
Median number of vehichles in renter occupied houses
Mean number of vehichles in renter occupied houses
Rooms in owner-occupied houses - 1 room (%)
Rooms in owner-occupied houses - 2 rooms (%)
Rooms in owner-occupied houses - 3 rooms (%)
Rooms in owner-occupied houses - 4 rooms (%)
Rooms in owner-occupied houses - 5 rooms (%)
Rooms in owner-occupied houses - 6 rooms (%)
Rooms in owner-occupied houses - 7 rooms (%)
Rooms in owner-occupied houses - 8 rooms (%)
Rooms in owner-occupied houses - 9+ rooms (%)
Rooms in renter-occupied houses - 1 room (%)
Rooms in renter-occupied houses - 2 rooms (%)
Rooms in renter-occupied houses - 3 rooms (%)
Rooms in renter-occupied houses - 4 rooms (%)
Rooms in renter-occupied houses - 5 rooms (%)
Rooms in renter-occupied houses - 6 rooms (%)
Rooms in renter-occupied houses - 7 rooms (%)
Rooms in renter-occupied houses - 8 rooms (%)
Rooms in renter-occupied houses - 9+ rooms (%)
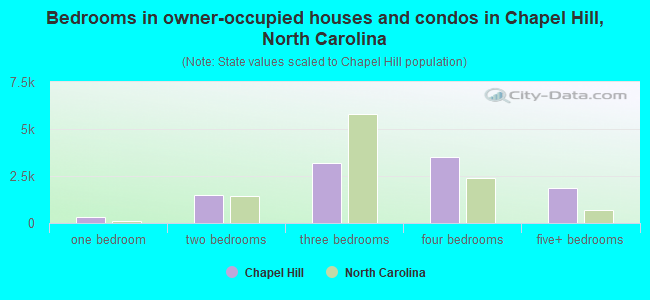
Bedrooms in owner-occupied houses - no bedrooms (%)
Bedrooms in owner-occupied houses - 1 bedroom (%)
Bedrooms in owner-occupied houses - 2 bedrooms (%)
Bedrooms in owner-occupied houses - 3 bedrooms (%)
Bedrooms in owner-occupied houses - 4 bedrooms (%)
Bedrooms in owner-occupied houses - 5+ bedrooms (%)
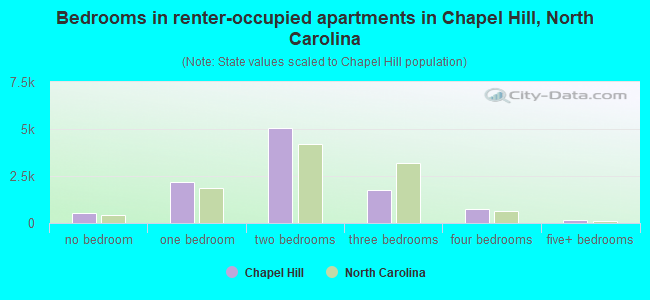
Bedrooms in renter-occupied houses - no bedrooms (%)
Bedrooms in renter-occupied houses - 1 bedroom (%)
Bedrooms in renter-occupied houses - 2 bedrooms (%)
Bedrooms in renter-occupied houses - 3 bedrooms (%)
Bedrooms in renter-occupied houses - 4 bedrooms (%)
Bedrooms in renter-occupied houses - 5+ bedrooms (%)
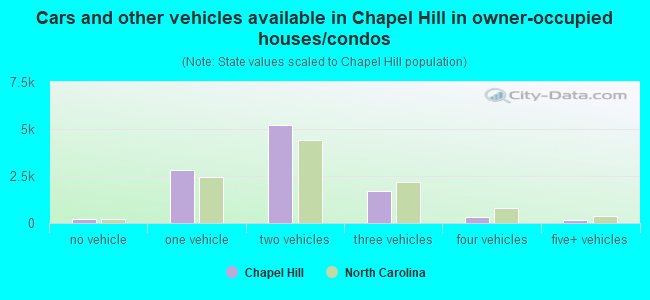
Vehicles available in owner-occupied houses - no vehicle available (%)
Vehicles available in owner-occupied houses - 1 vehicle available(%)
Vehicles available in owner-occupied houses - 2 Vehicles available (%)
Vehicles available in owner-occupied houses - 3 Vehicles available (%)
Vehicles available in owner-occupied houses - 4 Vehicles available (%)
Vehicles available in owner-occupied houses - 5+ Vehicles available (%)
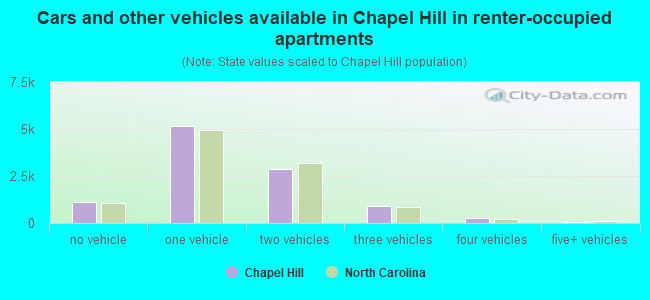
Vehicles available in renter-occupied houses - no vehicle available (%)
Vehicles available in renter-occupied houses - 1 vehicle available (%)
Vehicles available in renter-occupied houses - 2 Vehicles available (%)
Vehicles available in renter-occupied houses - 3 Vehicles available (%)
Vehicles available in renter-occupied houses - 4 Vehicles available (%)
Vehicles available in renter-occupied houses - 5+ Vehicles available (%)
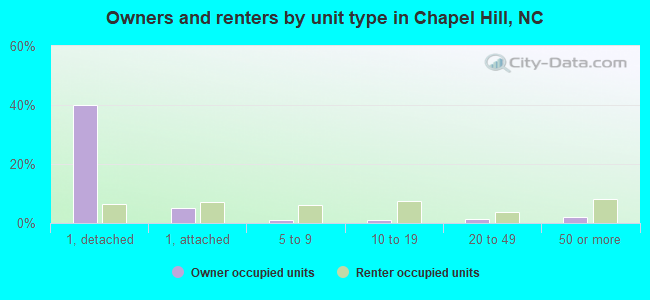
Housing units in structures - 1, detached (%)
Housing units in structures - 1, attached (%)
Housing units in structures - 2 (%)
Housing units in structures - 3 or 4 (%)
Housing units in structures - 5 to 9 (%)
Housing units in structures - 10 to 19 (%)
Housing units in structures - 20 to 49 (%)
Housing units in structures - 50 or more (%)
Housing units in structures - Mobile home (%)
Housing units in structures - Boat, RV, van, etc. (%)
Housing units in structures - Owners - 1, detached (%)
Housing units in structures - Owners - 1, attached (%)
Housing units in structures - Owners - 2 (%)
Housing units in structures - Owners - 3 or 4 (%)
Housing units in structures - Owners - 5 to 9 (%)
Housing units in structures - Owners - 10 to 19 (%)
Housing units in structures - Owners - 20 to 49 (%)
Housing units in structures - Owners - 50 or more (%)
Housing units in structures - Owners - Mobile home (%)
Housing units in structures - Owners - Boat, RV, van, etc. (%)
Housing units in structures - Renters - 1, detached (%)
Housing units in structures - Renters - 1, attached (%)
Housing units in structures - Renters - 2 (%)
Housing units in structures - Renters - 3 or 4 (%)
Housing units in structures - Renters - 5 to 9 (%)
Housing units in structures - Renters - 10 to 19 (%)
Housing units in structures - Renters - 20 to 49 (%)
Housing units in structures - Renters - 50 or more (%)
Housing units in structures - Renters - Mobile home (%)
Housing units in structures - Renters - Boat, RV, van, etc. (%)
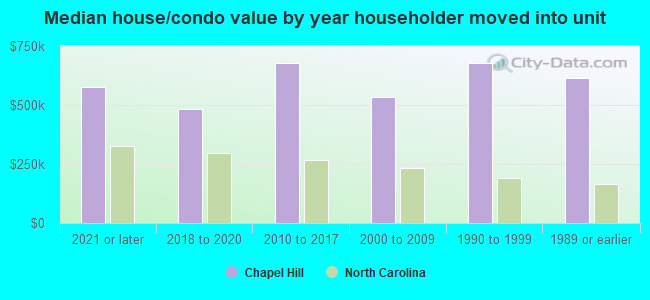
House/condo owner moved in on average (years ago)
Renter moved in on average (years ago)
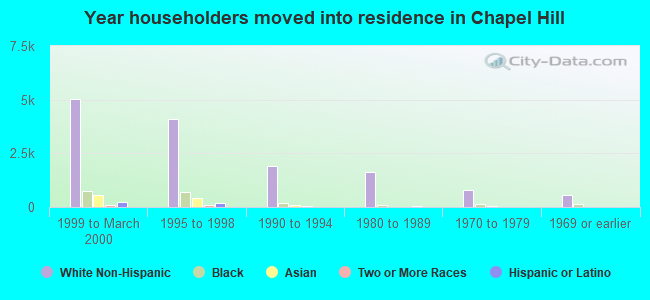
Year householder moved into unit - Moved in 1999 to March 2000 (%)
Year householder moved into unit - Moved in 1999 to March 2000 (%) - White
Year householder moved into unit - Moved in 1999 to March 2000 (%) - Black or African American
Year householder moved into unit - Moved in 1999 to March 2000 (%) - Asian
Year householder moved into unit - Moved in 1999 to March 2000 (%) - Hispanic or Latino
Year householder moved into unit - Moved in 1999 to March 2000 (%) - American Indian and Alaska Native
Year householder moved into unit - Moved in 1999 to March 2000 (%) - Multirace
Year householder moved into unit - Moved in 1999 to March 2000 (%) - Other Race
Year householder moved into unit - Moved in 1995 to 1998 (%)
Year householder moved into unit - Moved in 1995 to 1998 (%) - White
Year householder moved into unit - Moved in 1995 to 1998 (%) - Black or African American
Year householder moved into unit - Moved in 1995 to 1998 (%) - Asian
Year householder moved into unit - Moved in 1995 to 1998 (%) - Hispanic or Latino
Year householder moved into unit - Moved in 1995 to 1998 (%) - American Indian and Alaska Native
Year householder moved into unit - Moved in 1995 to 1998 (%) - Multirace
Year householder moved into unit - Moved in 1995 to 1998 (%) - Other Race
Year householder moved into unit - Moved in 1990 to 1994 (%)
Year householder moved into unit - Moved in 1990 to 1994 (%) - White
Year householder moved into unit - Moved in 1990 to 1994 (%) - Black or African American
Year householder moved into unit - Moved in 1990 to 1994 (%) - Asian
Year householder moved into unit - Moved in 1990 to 1994 (%) - Hispanic or Latino
Year householder moved into unit - Moved in 1990 to 1994 (%) - American Indian and Alaska Native
Year householder moved into unit - Moved in 1990 to 1994 (%) - Multirace
Year householder moved into unit - Moved in 1990 to 1994 (%) - Other Race
Year householder moved into unit - Moved in 1980 to 1989 (%)
Year householder moved into unit - Moved in 1980 to 1989 (%) - White
Year householder moved into unit - Moved in 1980 to 1989 (%) - Black or African American
Year householder moved into unit - Moved in 1980 to 1989 (%) - Asian
Year householder moved into unit - Moved in 1980 to 1989 (%) - Hispanic or Latino
Year householder moved into unit - Moved in 1980 to 1989 (%) - American Indian and Alaska Native
Year householder moved into unit - Moved in 1980 to 1989 (%) - Multirace
Year householder moved into unit - Moved in 1980 to 1989 (%) - Other Race
Year householder moved into unit - Moved in 1970 to 1979 (%)
Year householder moved into unit - Moved in 1970 to 1979 (%) - White
Year householder moved into unit - Moved in 1970 to 1979 (%) - Black or African American
Year householder moved into unit - Moved in 1970 to 1979 (%) - Asian
Year householder moved into unit - Moved in 1970 to 1979 (%) - Hispanic or Latino
Year householder moved into unit - Moved in 1970 to 1979 (%) - American Indian and Alaska Native
Year householder moved into unit - Moved in 1970 to 1979 (%) - Multirace
Year householder moved into unit - Moved in 1970 to 1979 (%) - Other Race
Year householder moved into unit - Moved in 1969 or earlier (%)
Year householder moved into unit - Moved in 1969 or earlier (%) - White
Year householder moved into unit - Moved in 1969 or earlier (%) - Black or African American
Year householder moved into unit - Moved in 1969 or earlier (%) - Asian
Year householder moved into unit - Moved in 1969 or earlier (%) - Hispanic or Latino
Year householder moved into unit - Moved in 1969 or earlier (%) - American Indian and Alaska Native
Year householder moved into unit - Moved in 1969 or earlier (%) - Multirace
Year householder moved into unit - Moved in 1969 or earlier (%) - Other Race
Housing units lacking complete plumbing facilities (%)
Housing units lacking complete kitchen facilities (%)
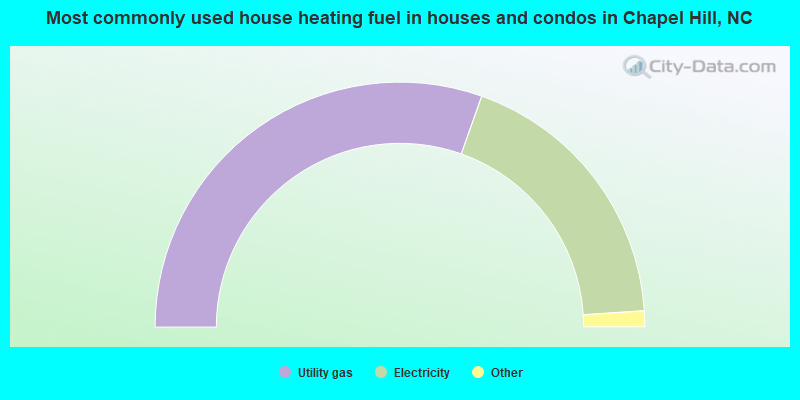
House heating fuel used in houses and condos - Utility gas (%)
House heating fuel used in houses and condos - Bottled, tank, or LP gas (%)
House heating fuel used in houses and condos - Electricity (%)
House heating fuel used in houses and condos - Fuel oil, kerosene, etc. (%)
House heating fuel used in houses and condos - Coal or coke (%)
House heating fuel used in houses and condos - Wood (%)
House heating fuel used in houses and condos - Solar energy (%)
House heating fuel used in houses and condos - Other fuel (%)
House heating fuel used in houses and condos - No fuel used (%)
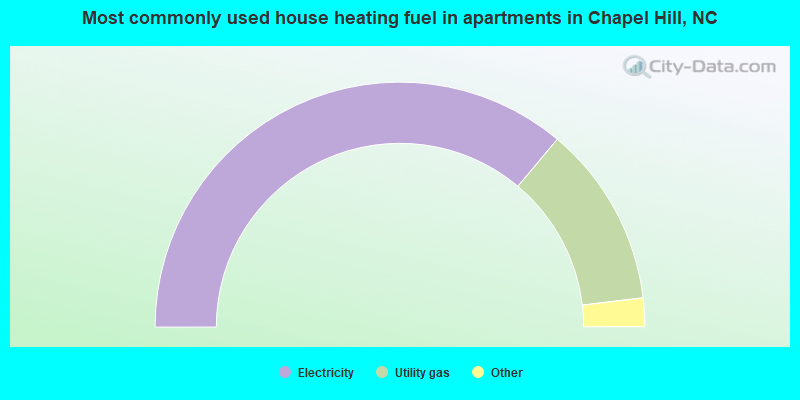
House heating fuel used in apartments - Utility gas (%)
House heating fuel used in apartments - Bottled, tank, or LP gas (%)
House heating fuel used in apartments - Electricity (%)
House heating fuel used in apartments - Fuel oil, kerosene, etc. (%)
House heating fuel used in apartments - Coal or coke (%)
House heating fuel used in apartments - Wood (%)
House heating fuel used in apartments - Solar energy (%)
House heating fuel used in apartments - Other fuel (%)
House heating fuel used in apartments - No fuel used (%)
Median year house/condo built: 1989Median year apartment built: 1988Household type by relationship:
Households: 60,759
Male householders: 9,845 (2,742 living alone ), Female householders: 10,743 (3,655 living alone )8,419 spouses (8,367 opposite-sex spouses ), 1,029 unmarried partners , (868 opposite-sex unmarried partners ), 11,490 children (11,049 natural , 243 adopted , 196 stepchildren ), 457 grandchildren , 391 brothers or sisters , 718 parents , 0 foster children , 192 other relatives , 6,127 non-relatives In group quarters: 11,343
Size of family households: 4,456 2-persons , 2,955 3-persons , 2,046 4-persons , 766 5-persons , 129 6-persons , 50 7-or-more-persons .
Size of nonfamily households: 6,870 1-person , 1,974 2-persons , 750 3-persons , 808 4-persons , 62 5-persons , 17 6-persons , 70 7-or-more-persons .
6,194 married couples with children. single-parent households (359 men , 2,182 women ).
78.6% of residents of Chapel Hill speak English at home. of residents speak Spanish at home (66% speak English very well , 6% speak English well , 7% speak English not well , 21% don't speak English at all ).of residents speak other Indo-European language at home (85% speak English very well , 9% speak English well , 5% speak English not well , 1% don't speak English at all ).of residents speak Asian or Pacific Island language at home (66% speak English very well , 20% speak English well , 11% speak English not well , 2% don't speak English at all ).of residents speak other language at home (84% speak English very well , 12% speak English well , 4% speak English not well ).
Foreign born population: 7,987 (13.1%)of them are naturalized citizens )
Median number of rooms in houses and condos:
Median number of rooms in apartments
Owner-occupied Renter-occupied
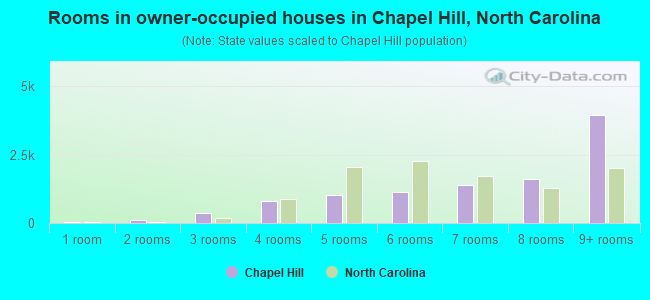
Rooms in owner-occupied houses in Chapel Hill, North Carolina
37 1 room 101 2 rooms 356 3 rooms 812 4 rooms 1,039 5 rooms 1,134 6 rooms 1,386 7 rooms 1,611 8 rooms 3,954 9+ rooms
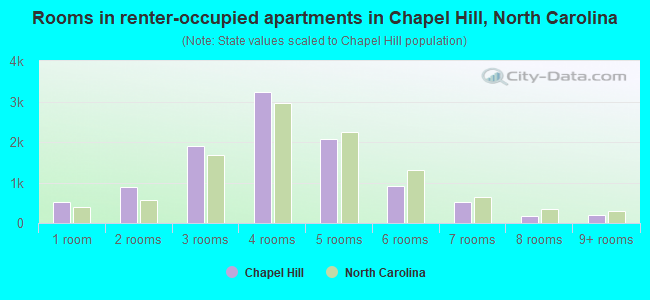
Rooms in renter-occupied apartments in Chapel Hill, North Carolina
529 1 room 877 2 rooms 1,903 3 rooms 3,236 4 rooms 2,065 5 rooms 923 6 rooms 511 7 rooms 185 8 rooms 208 9+ rooms
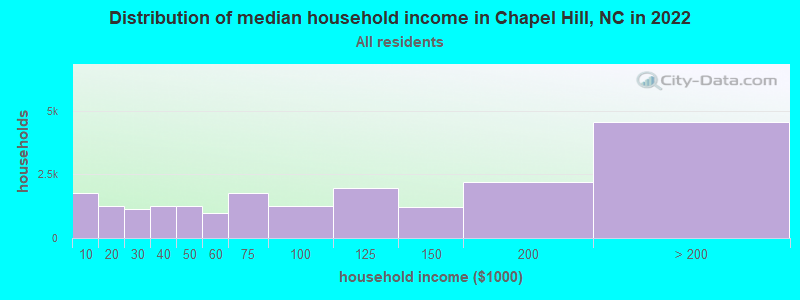
Chapel Hill, NC household income distribution 1,783 Less than $10,0001,250 $10,000 to $19,9991,153 $20,000 to $29,9991,240 $30,000 to $39,9991,273 $40,000 to $49,999981 $50,000 to $59,9991,766 $60,000 to $74,9991,247 $75,000 to $99,9991,967 $100,000 to $124,9991,229 $125,000 to $149,9992,188 $150,000 to $199,9994,550 $200,000 or more
Home value of owner - occupied houses in 2022 in Chapel Hill, NC 56 Less than $10,00019 $10,000 to $14,99917 $20,000 to $24,99917 $35,000 to $39,99949 $50,000 to $59,99911 $60,000 to $69,99921 $70,000 to $79,99910 $80,000 to $89,9995 $90,000 to $99,99927 $100,000 to $124,999111 $125,000 to $149,999260 $150,000 to $174,999118 $175,000 to $199,999510 $200,000 to $249,999382 $250,000 to $299,9991,229 $300,000 to $399,9991,679 $400,000 to $499,9993,885 $500,000 to $749,9991,840 $750,000 to $999,9991,028 $1,000,000 to $1,499,999201 $1,500,000 to $1,999,99976 $2,000,000 or moreRent paid by renters in 2022 in Chapel Hill, NC 13 Less than $10033 $100 to $149148 $150 to $19969 $200 to $2492 $250 to $29947 $300 to $34939 $350 to $39939 $400 to $44975 $450 to $49940 $500 to $549128 $550 to $599114 $600 to $649122 $650 to $699185 $700 to $74953 $750 to $799429 $800 to $899572 $900 to $9992,409 $1,000 to $1,2491,634 $1,250 to $1,4993,151 $1,500 to $1,9991,065 $2,000 to $2,499201 $2,500 to $2,999123 $3,000 to $3,499193 $3,500 or more329 No cash rent
Percentage of workers working in this county: 77.4%Number of people working at home: 8,734 (30.0% of all workers )
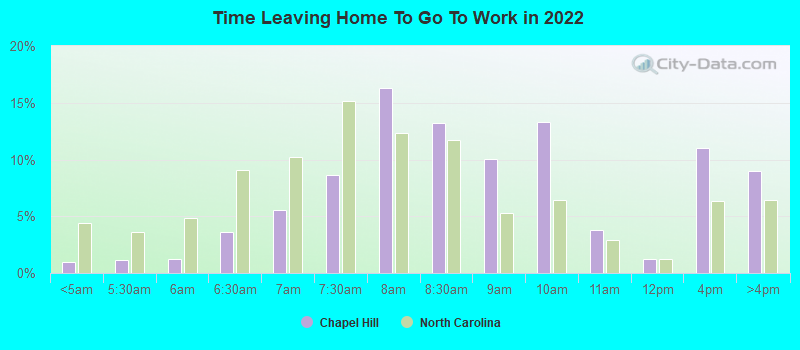
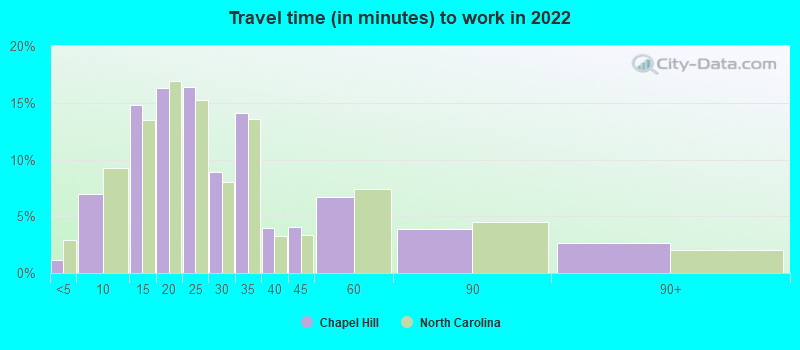
Travel time to work (commute)
Less than 5 minutes: 3245 to 9 minutes: 2,61910 to 14 minutes: 4,41015 to 19 minutes: 4,30920 to 24 minutes: 3,30925 to 29 minutes: 1,84730 to 34 minutes: 1,76635 to 39 minutes: 29340 to 44 minutes: 68345 to 59 minutes: 55460 to 89 minutes: 28290 or more minutes: 328
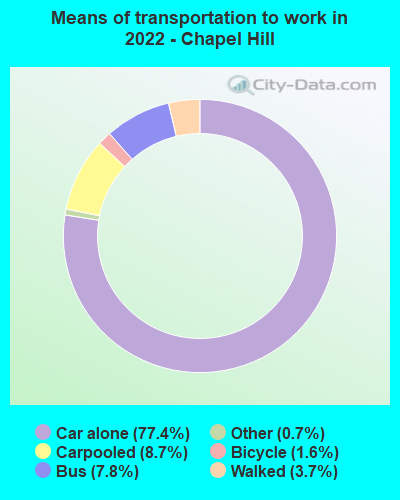
Means of transportation to work:
Drove a car alone: 37,701 (66.4%)Carpooled: 4,034 (7.1%)Bus : 1,953 (3.4%)Subway or elevated rail : 13 (0.0%)Taxi: 196 (0.3%)Bicycle: 964 (1.7%)Walked: 1,704 (3.0%)Worked at home: 8,734 (15.4%)
Unemployment by race in 2022
Unemployment rate for White non-Hispanic residents 2.6% Males3.6% FemalesUnemployment rate for Black residents 12.9% Males4.6% FemalesUnemployment rate for Asian residents 1.2% Males2.1% FemalesUnemployment rate for other race residents 1.4% FemalesUnemployment rate for two or more race residents 6.9% Males1.6% FemalesUnemployment rate for Hispanic or Latino residents 1.7% Males1.5% Females
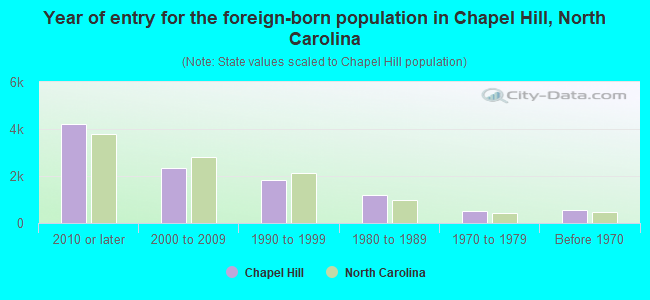
Year of entry for the foreign-born population in Chapel Hill, North Carolina
4,199 2010 or later 2,332 2000 to 2009 1,811 1990 to 1999 1,199 1980 to 1989 490 1970 to 1979 545 Before 1970
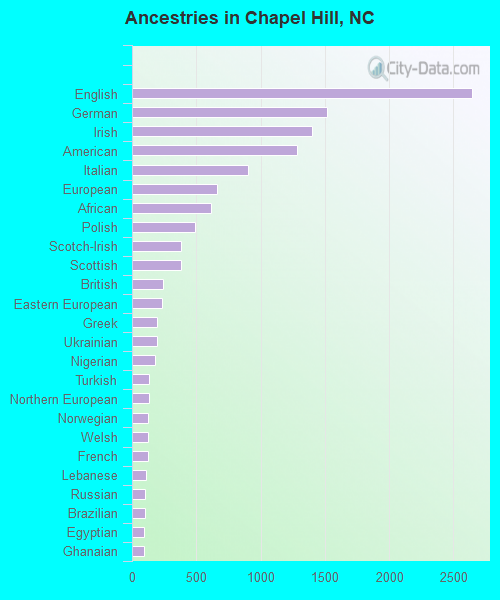
First ancestries reported:
English: 2,644 (7.8%)
German: 1,515 (4.5%)
Irish: 1,397 (4.1%)
American: 1,282 (3.8%)
Italian: 901 (2.7%)
European: 660 (2.0%)
African: 611 (1.8%)
Polish: 488 (1.4%)
Scotch-Irish: 384 (1.1%)
Scottish: 383 (1.1%)
British: 242 (0.7%)
Eastern European: 231 (0.7%)
Greek: 195 (0.6%)
Ukrainian: 194 (0.6%)
Nigerian: 182 (0.5%)
Turkish: 135 (0.4%)
Northern European: 132 (0.4%)
Norwegian: 127 (0.4%)
Welsh: 122 (0.4%)
French: 121 (0.4%)
Lebanese: 105 (0.3%)
Russian: 100 (0.3%)
Brazilian: 99 (0.3%)
Egyptian: 97 (0.3%)
Ghanaian: 95 (0.3%)
Hungarian: 86 (0.3%)
Iranian: 83 (0.2%)
Dutch: 71 (0.2%)
Canadian: 71 (0.2%)
Scandinavian: 66 (0.2%)
Slovak: 58 (0.2%)
Arab: 56 (0.2%)
Finnish: 54 (0.2%)
Kenyan: 51 (0.2%)
British West Indian: 46 (0.1%)
Swedish: 44 (0.1%)
Palestinian: 42 (0.1%)
Lithuanian: 38 (0.1%)
Austrian: 37 (0.1%)
Romanian: 37 (0.1%)
Swiss: 36 (0.1%)
Jamaican: 34 (0.1%)
Armenian: 33 (0.10%)
South African: 31 (0.09%)
Yugoslavian: 26 (0.08%)
Macedonian: 23 (0.07%)
French Canadian: 23 (0.07%)
Bulgarian: 17 (0.05%)
Estonian: 16 (0.05%)
Serbian: 15 (0.04%)
Czechoslovakian: 14 (0.04%)
West Indian: 13 (0.04%)
Slovene: 12 (0.04%)
Assyrian: 11 (0.03%)
Trinidadian and Tobagonian: 9 (0.03%)
Danish: 5 (0.01%)
Czech: 5 (0.01%)
Belgian: 5 (0.01%)
Barbadian: 4 (0.01%)
Ugandan: 2 (0.01%)
Haitian: 2 (0.01%)
Most common places of birth for foreign-born residents (%): China, excluding Hong Kong and Taiwan Chapel Hill:
21.7% (2,158)North Carolina:
3.2% (27,477)
India Chapel Hill:
9.5% (947)North Carolina:
9.3% (80,594)
Guatemala Chapel Hill:
6.9% (688)North Carolina:
2.6% (22,964)
Korea Chapel Hill:
6.2% (614)North Carolina:
1.8% (15,988)
Sierra Leone Chapel Hill:
3.8% (379)North Carolina:
0.2% (1,485)
Mexico Chapel Hill:
3.1% (307)North Carolina:
24.7% (214,776)
Burma (Myanmar) Chapel Hill:
2.7% (267)North Carolina:
0.5% (4,516)
Canada Chapel Hill:
2.5% (253)North Carolina:
2.1% (18,105)
Egypt Chapel Hill:
2.5% (249)North Carolina:
0.6% (4,847)
United Kingdom, excluding England and Scotland Chapel Hill:
2.5% (248)North Carolina:
1.1% (9,831)
Philippines Chapel Hill:
2.1% (210)North Carolina:
2.4% (20,695)
Japan Chapel Hill:
2.0% (200)North Carolina:
0.7% (5,941)
Turkey Chapel Hill:
2.0% (195)North Carolina:
0.3% (2,997)
Other Eastern Europe Chapel Hill:
1.8% (183)North Carolina:
0.2% (1,928)
Taiwan Chapel Hill:
1.7% (165)North Carolina:
0.4% (3,524)
Poland Chapel Hill:
1.6% (159)North Carolina:
0.4% (3,607)
Place of birth for U.S.-born residents:
This state: 26,051Other state: 25,473Northeast: 7,860Midwest: 5,323South: 9,116West: 2,993 73.2% of Chapel Hill residents lived in the same house 1 years ago.
Out of people who lived in different houses, 22.4% lived in this county.
Out of people who lived in different counties, 61.0% lived in North Carolina.
Chapel Hill:
73.2%State average:
87.3%
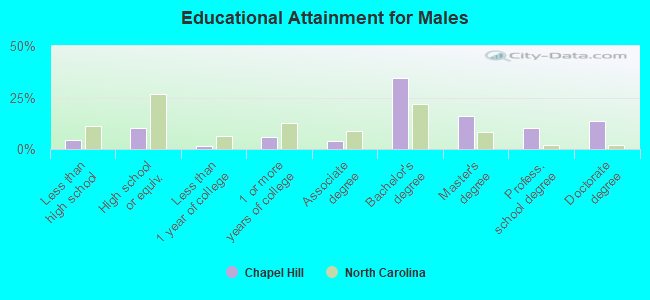
Education attainment for males 25 years and older:
No schooling: 119Nursery to 4th grade: 1715th and 6th grade: 07th and 8th grade: 769th grade: 8310th grade: 411th grade: 6112th grade, no diploma: 73High school graduate (or equivalency): 1,396Less than 1 year of college: 226Some college more than 1 year, no degree: 842Associate degree: 528Bachelor's degree: 4,766Master's degree: 2,194Professional school degree: 1,446Doctorate degree: 1,913
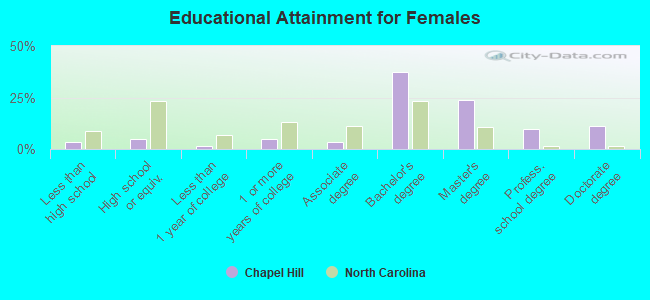
Education attainment for females 25 years and older:
No schooling: 84Nursery to 4th grade: 415th and 6th grade: 127th and 8th grade: 1089th grade: 9010th grade: 5311th grade: 8612th grade, no diploma: 123High school graduate (or equivalency): 805Less than 1 year of college: 255Some college more than 1 year, no degree: 800Associate degree: 548Bachelor's degree: 6,216Master's degree: 3,930Professional school degree: 1,637Doctorate degree: 1,874
Housing units in structures:
One, detached: 9,965One, attached: 2,855Two: 8153 or 4: 1,0825 to 9: 2,28910 to 19: 2,42320 to 49: 1,34050 or more: 2,014Mobile homes: 143Housing units lacking complete plumbing facilities in 2022: 2.7%Housing units lacking complete kitchen facilities in 2022: 2.8%House/condo owner moved in on average 10 years ago
Renter moved in on average 0 years ago
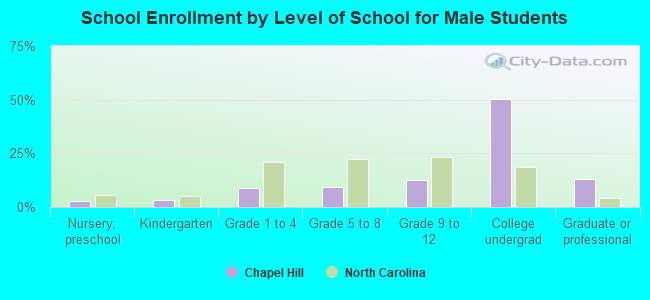
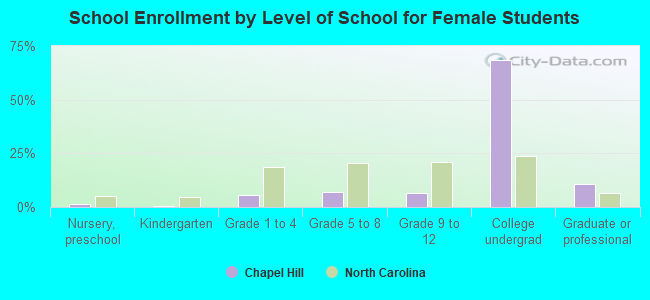
Private vs. public school enrollment:
Students in private schools in grades 1 to 8 (elementary and middle school): 1,186 Here:
25.7%North Carolina:
13.8%
Students in private schools in grades 9 to 12 (high school): 286 Here:
10.3%North Carolina:
11.9%
Students in private undergraduate colleges: 346 Here:
1.9%North Carolina:
19.3%