Chalfont, PA (Pennsylvania) Houses and Residents
| Chalfont: | $445,213 |
| Pennsylvania: | $245,500 |
Mean price in 2022:
Detached houses: $491,320
Here: $491,320 State: $317,202 Townhouses or other attached units: $344,901
Here: $344,901 State: $254,369 In 5-or-more-unit structures: $185,458
Here: $185,458 State: $320,068
Total population: 4,077 (Urban population: 3,900, Rural population: 0)
Houses: 1,718 (1,699 occupied: 1,428 owner occupied, 286 renter occupied)
| % of renters here: | 17% |
| State: | 31% |
Housing density: 1,042 houses/condos per square mile
Median price asked for vacant for-sale houses and condos in 2022 in this county: $426,803.
Median contract rent in 2022: over $2,000 (lower quartile is $1,540, upper quartile is over $2,000)
Median rent asked for vacant for-rent units in 2022: $2,412
Median gross rent in Chalfont, PA in 2022: over $2,000
Housing units in Chalfont with a mortgage: 1,073 (182 second mortgage, 0 home equity loan, 153 both second mortgage and home equity loan)
Houses without a mortgage: 96
Median household income for houses/condos with a mortgage: $167,077
Median household income for apartments without a mortgage: $48,386
Median monthly housing costs: $1,939
Compare current foreclosures near Chalfont, PA:
| Photo | Address | Area | Beds / Baths | Price | Details |
|---|---|---|---|---|---|

|
#1
Statesman Rd
Chalfont, PA 18914
|
3,150 sq. feet
|
2 baths 4 beds |
show details | |

|
#2
Beechwood Dr
Chalfont, PA 18914
|
2,480 sq. feet
|
2 baths 3 beds |
show details | |

|
#3
Inverness Cir
Chalfont, PA 18914
|
2,040 sq. feet
|
2 baths 3 beds |
show details | |

|
#4
Moyer Rd
Chalfont, PA 18914
|
2,220 sq. feet
|
2 baths 4 beds |
show details | |

|
#5
Belle View Way
Chalfont, PA 18914
|
3,602 sq. feet
|
3 baths 3 beds |
show details | |

|
#6
Pennsylvania Ave
Chalfont, PA 18914
|
680 sq. feet
|
1 baths 2 beds |
show details | |

|
#7
New Jersey Ave
Chalfont, PA 18914
|
2,184 sq. feet
|
3 baths 4 beds |
show details | |

|
#8
Upper State Rd
Chalfont, PA 18914
|
2,378 sq. feet
|
2 baths 3 beds |
show details | |

|
#9
Stonyhill Dr
Chalfont, PA 18914
|
2,744 sq. feet
|
2 baths 3 beds |
show details | |

|
#10
Skunk Hollow Rd
Chalfont, PA 18914
|
2,677 sq. feet
|
2 baths 4 beds |
show details |
| Photo | Address | Area | Beds / Baths | Price | Details |
|---|---|---|---|---|---|

|
#11
Hickory Ridge Dr
Chalfont, PA 18914
|
3,498 sq. feet
|
2 baths 4 beds |
show details | |

|
#12
Palace Ct
Chalfont, PA 18914
|
2,450 sq. feet
|
3 baths 4 beds |
show details | |

|
#13
Sellersville Rd
Chalfont, PA 18914
|
2,676 sq. feet
|
1 baths 3 beds |
show details | |

|
#14
Cornwall Dr
Chalfont, PA 18914
|
2,160 sq. feet
|
1 baths - beds |
show details | |

|
#15
Limekiln Pike
Chalfont, PA 18914
|
- sq. feet
|
- baths - beds |
show details | |

|
#16
Manchester Rd
Elkins Park, PA 19027
|
3,444 sq. feet
|
2 baths 3 beds |
$559,900
|
show details |

|
#17
Ashbourne Rd
Elkins Park, PA 19027
|
3,104 sq. feet
|
3 baths 6 beds |
$154,500
|
show details |

|
#18
N Parkview Dr
Norristown, PA 19403
|
2,602 sq. feet
|
2 baths 4 beds |
$240,000
|
show details |

|
#19
Pickering St
Philadelphia, PA 19150
|
1,170 sq. feet
|
1 baths 3 beds |
$169,900
|
show details |

|
#20
Dekalb Pike
Norristown, PA 19401
|
2,583 sq. feet
|
2 baths 4 beds |
$255,189
|
show details |
| Photo | Address | Area | Beds / Baths | Price | Details |
|---|---|---|---|---|---|

|
#21
Keenan St
Elkins Park, PA 19027
|
1,234 sq. feet
|
2 baths 2 beds |
$217,220
|
show details |

|
#22
67th Ave
Philadelphia, PA 19138
|
1,146 sq. feet
|
1 baths 3 beds |
$8,900
|
show details |

|
#23
E Rittenhouse St
Philadelphia, PA 19138
|
1,614 sq. feet
|
1 baths 3 beds |
$114,894
|
show details |

|
#24
Cornelius St
Philadelphia, PA 19138
|
1,166 sq. feet
|
1 baths 3 beds |
$118,648
|
show details |

|
#25
E Gorgas Ln
Philadelphia, PA 19150
|
1,139 sq. feet
|
- baths 3 beds |
$29,368
|
show details |

|
#26
E Johnson St
Philadelphia, PA 19138
|
1,728 sq. feet
|
2 baths 3 beds |
show details | |

|
#27
Township Line Rd
North Wales, PA 19454
|
1,392 sq. feet
|
1 baths 2 beds |
show details | |

|
#28
Middle Holland Rd
Southampton, PA 18966
|
2,216 sq. feet
|
1 baths 3 beds |
show details | |

|
#29
Woolston Ave
Philadelphia, PA 19150
|
1,224 sq. feet
|
1 baths 3 beds |
show details | |

|
#30
Meadowbrook Rd
Feasterville Trevose, PA 19053
|
1,820 sq. feet
|
1 baths 3 beds |
show details |
| Photo | Address | Area | Beds / Baths | Price | Details |
|---|---|---|---|---|---|

|
#31
Woodhaven Rd
Philadelphia, PA 19116
|
2,365 sq. feet
|
- baths - beds |
$242,243
|
show details |

|
#32
Saljon Ct
Ambler, PA 19002
|
3,259 sq. feet
|
2 baths 4 beds |
show details | |

|
#33
Hagey Pl # 2602
Collegeville, PA 19426
|
1,856 sq. feet
|
2 baths 2 beds |
show details | |

|
#34
S Ascot Ct
Newtown, PA 18940
|
2,064 sq. feet
|
1 baths 3 beds |
show details | |

|
#35
Trewellyn Ave
Blue Bell, PA 19422
|
1,686 sq. feet
|
1 baths 3 beds |
show details | |

|
#36
Rugby St
Philadelphia, PA 19150
|
1,224 sq. feet
|
3 baths 3 beds |
show details | |

|
#37
Grant Ave
Philadelphia, PA 19115
|
1,080 sq. feet
|
1 baths 3 beds |
show details | |

|
#38
Old York Rd
Elkins Park, PA 19027
|
3,592 sq. feet
|
4 baths 6 beds |
show details | |

|
#39
Briar Rd
Philadelphia, PA 19138
|
- sq. feet
|
1 baths 3 beds |
show details | |

|
#40
State St
Lansdale, PA 19446
|
1,260 sq. feet
|
1 baths 3 beds |
show details |
| Photo | Address | Area | Beds / Baths | Price | Details |
|---|---|---|---|---|---|

|
#41
N Broad St
Philadelphia, PA 19126
|
1,900 sq. feet
|
1 baths 4 beds |
show details | |

|
#42
S 4th St
Perkasie, PA 18944
|
1,530 sq. feet
|
1 baths 3 beds |
show details | |

|
#43
Sweetbriar Dr
Jamison, PA 18929
|
2,261 sq. feet
|
2 baths 3 beds |
show details | |

|
#44
W Broad St
Telford, PA 18969
|
1,248 sq. feet
|
1 baths 4 beds |
show details | |

|
#45
W Street Rd Apt 627
Warminster, PA 18974
|
1,108 sq. feet
|
2 baths 2 beds |
show details | |

|
#46
Theresa Dr
Philadelphia, PA 19116
|
1,200 sq. feet
|
2 baths 4 beds |
show details | |

|
#47
Poplar Ave
Warrington, PA 18976
|
1,400 sq. feet
|
1 baths 2 beds |
show details | |

|
#48
Mountain Ave
Elkins Park, PA 19027
|
2,454 sq. feet
|
2 baths 4 beds |
show details | |

|
#49
Arboretum Rd
Wyncote, PA 19095
|
2,128 sq. feet
|
2 baths 3 beds |
show details | |

|
Check over 1 million property listings on Foreclosure.com!
|
browse all offers | |||

Latest news about housing in Chalfont, PA collected exclusively by city-data.com from local newspapers, TV, and radio stations

 | SEPTA sucks (162 replies) |
| Please tell me about Hilltown and Chalfont PA... (0 replies) |
| relocating for job in Pymouth Meeting, considering Chalfont? (3 replies) |
| Bad White Neighborhoods in PGH? (67 replies) |
| Location, location, location (16 replies) |
| Family friendly towns outside of Philly (8 replies) |

Median year apartment built: 1974
Household type by relationship:
Households: 4,258- Male householders: 929 (173 living alone), Female householders: 757 (188 living alone)
824 spouses (824 opposite-sex spouses), 116 unmarried partners, (116 opposite-sex unmarried partners), 1,378 children (1,336 natural, 41 adopted, 0 stepchildren), 12 grandchildren, 10 brothers or sisters, 34 parents, 0 foster children, 28 other relatives, 152 non-relatives
- In group quarters: 8
Size of family households: 461 2-persons, 452 3-persons, 252 4-persons, 53 5-persons, 25 6-persons.
Size of nonfamily households: 363 1-person, 119 2-persons.
607 married couples with children.
304 single-parent households (97 men, 207 women).
90.9% of residents of Chalfont speak English at home.
3.0% of residents speak Spanish at home (100% speak English very well).
4.6% of residents speak other Indo-European language at home (96% speak English very well, 4% speak English well).
0.4% of residents speak Asian or Pacific Island language at home (28% speak English very well, 72% speak English well).
Foreign born population: 517 (12.1%)
(82.4% of them are naturalized citizens)
| Here: | 7.7 |
| State: | 6.8 |
| Here: | 6.4 |
| State: | 4.3 |

- Bedrooms in owner-occupied houses and condos in Chalfont, Pennsylvania
- 25no bedroom
- 531 bedroom
- 962 bedrooms
- 6953 bedrooms
- 5254 bedrooms
- 355+ bedrooms

- Bedrooms in renter-occupied apartments in Chalfont, Pennsylvania
- 0no bedroom
- 791 bedroom
- 752 bedrooms
- 1323 bedrooms
- 04 bedrooms
- 05+ bedrooms

- Cars and other vehicles available in Chalfont in owner-occupied houses/condos
- 22no vehicle
- 3831 vehicle
- 6182 vehicles
- 2923 vehicles
- 634 vehicles
- 515+ vehicles

- Cars and other vehicles available in Chalfont in renter-occupied apartments
- 17no vehicle
- 1241 vehicle
- 1452 vehicles
- 03 vehicles
- 04 vehicles
- 05+ vehicles

- Rooms in owner-occupied houses in Chalfont, Pennsylvania
- 01 room
- 02 rooms
- 783 rooms
- 664 rooms
- 805 rooms
- 1826 rooms
- 2257 rooms
- 3548 rooms
- 4449+ rooms

- Rooms in renter-occupied apartments in Chalfont, Pennsylvania
- 01 room
- 292 rooms
- 503 rooms
- 234 rooms
- 155 rooms
- 396 rooms
- 1307 rooms
- 08 rooms
- 09+ rooms


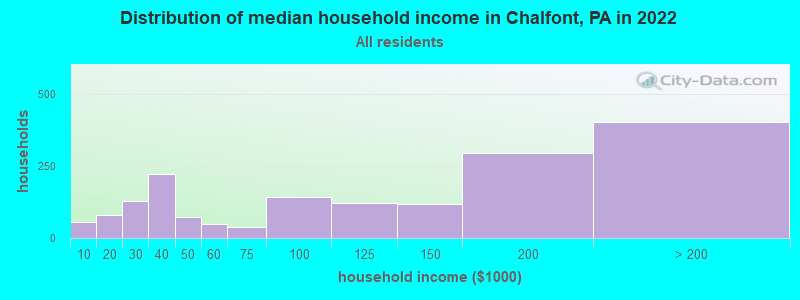
Chalfont, PA household income distribution

- 55Less than $10,000
- 78$10,000 to $19,999
- 128$20,000 to $29,999
- 222$30,000 to $39,999
- 72$40,000 to $49,999
- 49$50,000 to $59,999
- 39$60,000 to $74,999
- 141$75,000 to $99,999
- 121$100,000 to $124,999
- 117$125,000 to $149,999
- 294$150,000 to $199,999
- 402$200,000 or more
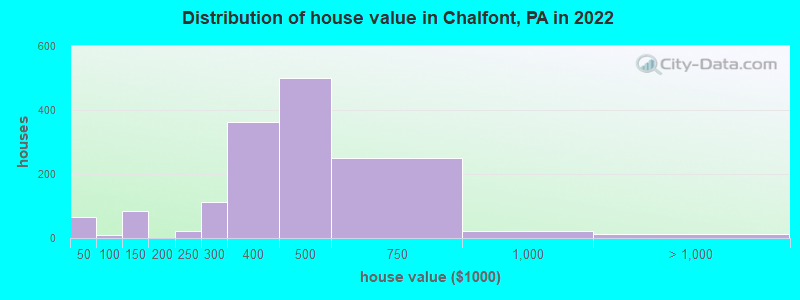
Home value of owner - occupied houses in 2022 in Chalfont, PA
-
- 48$20,000 to $24,999
- 7$35,000 to $39,999
- 8$40,000 to $49,999
- 71$100,000 to $124,999
- 12$125,000 to $149,999
- 22$200,000 to $249,999
- 111$250,000 to $299,999
- 361$300,000 to $399,999
- 498$400,000 to $499,999
- 248$500,000 to $749,999
- 21$750,000 to $999,999
- 11$2,000,000 or more
Rent paid by renters in 2022 in Chalfont, PA
-
- 12$600 to $649
- 31$700 to $749
- 10$800 to $899
- 1$900 to $999
- 8$1,250 to $1,499
- 82$1,500 to $1,999
- 111$2,000 to $2,499


Percentage of workers working in this county: 70.7%
Number of people working at home: 625 (25.5% of all workers)
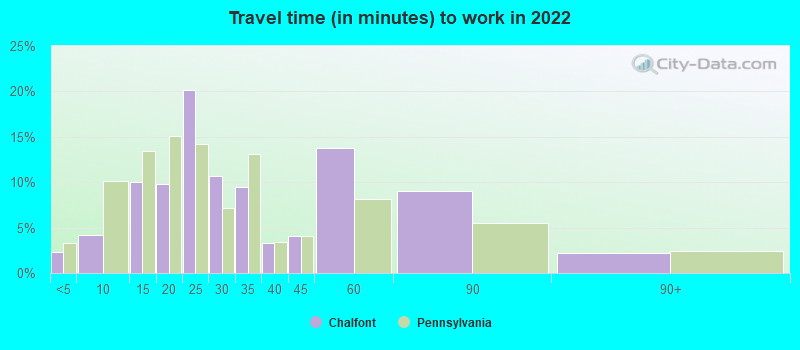
Travel time to work (commute)
- Less than 5 minutes: 32
- 5 to 9 minutes: 128
- 10 to 14 minutes: 198
- 15 to 19 minutes: 321
- 20 to 24 minutes: 287
- 25 to 29 minutes: 120
- 30 to 34 minutes: 143
- 35 to 39 minutes: 95
- 40 to 44 minutes: 23
- 45 to 59 minutes: 284
- 60 to 89 minutes: 176
- 90 or more minutes: 24
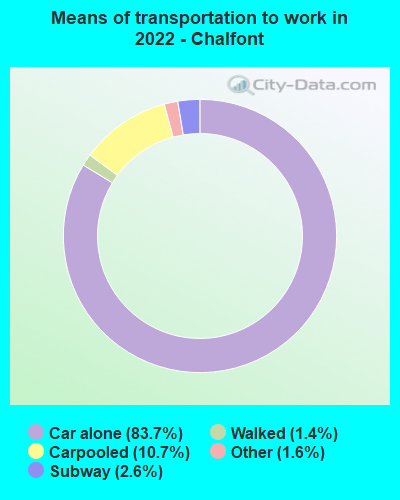
Means of transportation to work:
- Drove a car alone: 909 (55.6%)
- Carpooled: 107 (6.5%)
- Long-distance train or commuter rail: 17 (1.0%)
- Taxi: 25 (1.5%)
- Walked: 13 (0.8%)
- Worked at home: 625 (38.2%)

- Unemployment by race in 2022
- Unemployment rate for White non-Hispanic residents
- 5.2%Males
- 5.9%Females

- Year of entry for the foreign-born population in Chalfont, Pennsylvania
- 2552010 or later
- 592000 to 2009
- 991990 to 1999
- 1121980 to 1989
- 181970 to 1979
- 85Before 1970

First ancestries reported:
- Irish: 271 (17.2%)
- Italian: 271 (17.2%)
- Ethiopian: 191 (12.1%)
- German: 189 (12.0%)
- European: 85 (5.4%)
- Albanian: 70 (4.4%)
- American: 59 (3.7%)
- English: 56 (3.5%)
- Ukrainian: 33 (2.1%)
- Pennsylvania German: 19 (1.2%)
- Russian: 14 (0.9%)
- British: 12 (0.8%)
- Portuguese: 11 (0.7%)
- Dutch: 9 (0.6%)
- Eastern European: 9 (0.6%)
- French: 9 (0.6%)
- Romanian: 8 (0.5%)
- Scottish: 8 (0.5%)
- Croatian: 7 (0.4%)
- Polish: 7 (0.4%)
- Scotch-Irish: 7 (0.4%)
- Yugoslavian: 6 (0.4%)
- African: 1 (0.06%)
Most common places of birth for foreign-born residents (%):
| Chalfont: | 29.6% (154) |
| Pennsylvania: | 0.5% (4,658) |
| Chalfont: | 17.1% (89) |
| Pennsylvania: | 0.5% (4,491) |
| Chalfont: | 15.0% (78) |
| Pennsylvania: | 0.7% (6,351) |
| Chalfont: | 14.2% (74) |
| Pennsylvania: | 0.6% (5,742) |
| Chalfont: | 11.5% (60) |
| Pennsylvania: | 1.2% (11,211) |
| Chalfont: | 6.3% (33) |
| Pennsylvania: | 0.7% (6,855) |
| Chalfont: | 4.8% (25) |
| Pennsylvania: | 1.0% (9,205) |
| Chalfont: | 2.7% (14) |
| Pennsylvania: | 10.7% (100,596) |
| Chalfont: | 2.7% (14) |
| Pennsylvania: | 2.9% (27,433) |
| Chalfont: | 2.3% (12) |
| Pennsylvania: | 1.1% (10,331) |
| Chalfont: | 2.3% (12) |
| Pennsylvania: | 1.5% (13,823) |
| Chalfont: | 1.7% (9) |
| Pennsylvania: | 0.3% (2,533) |
Place of birth for U.S.-born residents:
- This state: 3,000
- Other state: 730
- Northeast: 437
- Midwest: 108
- South: 167
- West: 19
89.5% of Chalfont residents lived in the same house 1 years ago.
Out of people who lived in different houses, 40.2% lived in this county.
Out of people who lived in different counties, 56.9% lived in Pennsylvania.
| Chalfont: | 89.5% |
| State average: | 89.3% |
Education attainment for males 25 years and older:
- No schooling: 0
- Nursery to 4th grade: 0
- 5th and 6th grade: 0
- 7th and 8th grade: 0
- 9th grade: 0
- 10th grade: 15
- 11th grade: 0
- 12th grade, no diploma: 0
- High school graduate (or equivalency): 262
- Less than 1 year of college: 44
- Some college more than 1 year, no degree: 93
- Associate degree: 106
- Bachelor's degree: 513
- Master's degree: 306
- Professional school degree: 8
- Doctorate degree: 61

Education attainment for females 25 years and older:
- No schooling: 0
- Nursery to 4th grade: 0
- 5th and 6th grade: 0
- 7th and 8th grade: 0
- 9th grade: 0
- 10th grade: 6
- 11th grade: 0
- 12th grade, no diploma: 4
- High school graduate (or equivalency): 276
- Less than 1 year of college: 53
- Some college more than 1 year, no degree: 34
- Associate degree: 171
- Bachelor's degree: 598
- Master's degree: 346
- Professional school degree: 0
- Doctorate degree: 21


Housing units in structures:
- One, detached: 1,123
- One, attached: 244
- Two: 128
- 5 to 9: 90
- 10 to 19: 6
- 20 to 49: 72
- 50 or more: 52
House/condo owner moved in on average 17 years ago
Renter moved in on average -1 years ago

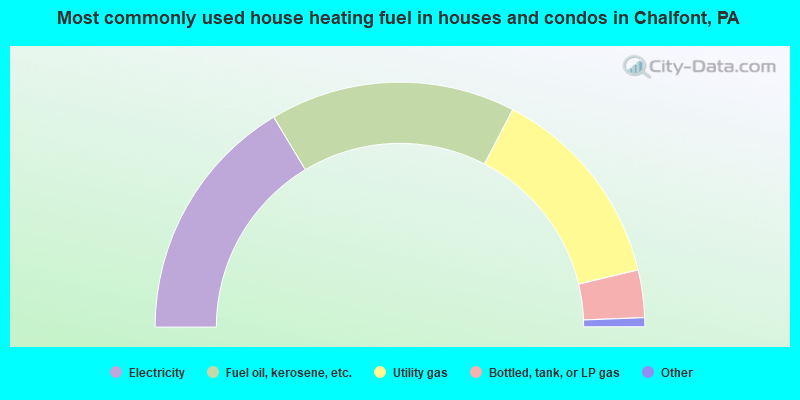
- 32.8%Electricity
- 32.5%Fuel oil, kerosene, etc.
- 27.3%Utility gas
- 6.3%Bottled, tank, or LP gas
- 0.6%Wood
- 0.4%Solar energy
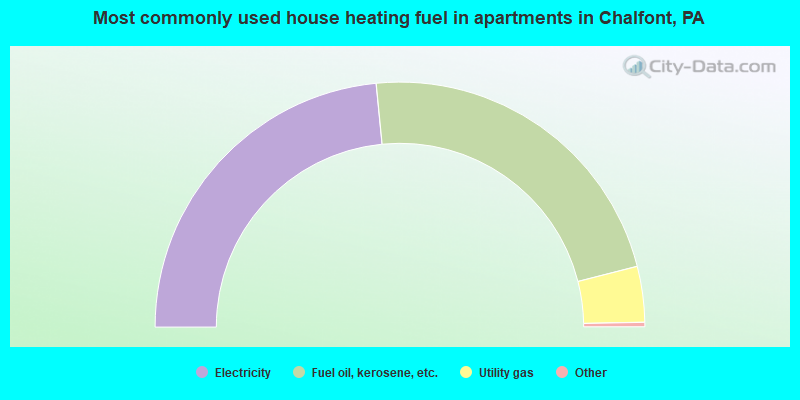
- 47.2%Electricity
- 45.4%Fuel oil, kerosene, etc.
- 7.4%Utility gas
Private vs. public school enrollment:
| Here: | 7.0% |
| Pennsylvania: | 15.7% |
| Here: | 1.9% |
| Pennsylvania: | 13.4% |
| Here: | 31.8% |
| Pennsylvania: | 39.8% |


