Cerulean Springs, KY (Kentucky) Houses and Residents
| Cerulean Springs: | $203,682 |
| Kentucky: | $196,300 |
Total population: 2,751 (Urban population: 0, Rural population: 2,608 (202 farm, 2,406 nonfarm))
Houses: 1,631 (1,058 occupied: 891 owner occupied, 167 renter occupied)
| % of renters here: | 16% |
| State: | 31% |
Housing density: 20 houses/condos per square mile
Median price asked for vacant for-sale houses and condos in 2022 in this county: $151,608.
Median contract rent in 2022: $443 (lower quartile is $344, upper quartile is $574)
Median rent asked for vacant for-rent units in 2022: $410
Median gross rent in Cerulean Springs, KY in 2022: $536
Housing units in Cerulean Springs with a mortgage: 219 (13 second mortgage, 14 home equity loan, 0 both second mortgage and home equity loan)
Houses without a mortgage: 291


Household type by relationship:
Households: 14,261- In family households: 12,294 (3,160 male householders, 1,023 female householders)
3,271 spouses, 3,821 children (3,446 natural, 83 adopted, 292 stepchildren), 353 grandchildren, 93 brothers or sisters, 84 parents, foster children, 137 other relatives, 289 non-relatives
- In nonfamily households: 1,967 (823 male householders (678 living alone)), 877 female householders (792 living alone)), 267 nonrelatives
- In group quarters: 78 (64 institutionalized population)
2,080 married couples with children.
592 single-parent households (145 men, 447 women).
97.1% of residents of Cerulean Springs speak English at home.
0.4% of residents speak Spanish at home (100% speak English very well).
1.6% of residents speak other Indo-European language at home (15% speak English very well, 85% speak English well).
0.9% of residents speak Asian or Pacific Island language at home (36% speak English very well, 32% speak English well, 32% speak English not well).
Foreign born population: 37 (1.4%)
(45.9% of them are naturalized citizens)
| Here: | 6.4 |
| State: | 6.4 |
| Here: | 5.0 |
| State: | 4.4 |

- Bedrooms in owner-occupied houses and condos in Cerulean Springs, Kentucky
- 0no bedroom
- 291 bedroom
- 2482 bedrooms
- 4713 bedrooms
- 1134 bedrooms
- 305+ bedrooms

- Bedrooms in renter-occupied apartments in Cerulean Springs, Kentucky
- 0no bedroom
- 101 bedroom
- 732 bedrooms
- 613 bedrooms
- 234 bedrooms
- 05+ bedrooms

- Cars and other vehicles available in Cerulean Springs in owner-occupied houses/condos
- 45no vehicle
- 1961 vehicle
- 3792 vehicles
- 1903 vehicles
- 674 vehicles
- 145+ vehicles

- Cars and other vehicles available in Cerulean Springs in renter-occupied apartments
- 5no vehicle
- 541 vehicle
- 712 vehicles
- 313 vehicles
- 64 vehicles
- 05+ vehicles

- Rooms in owner-occupied houses in Cerulean Springs, Kentucky
- 01 room
- 62 rooms
- 173 rooms
- 1194 rooms
- 2515 rooms
- 1946 rooms
- 1637 rooms
- 748 rooms
- 679+ rooms

- Rooms in renter-occupied apartments in Cerulean Springs, Kentucky
- 01 room
- 02 rooms
- 53 rooms
- 724 rooms
- 405 rooms
- 256 rooms
- 157 rooms
- 58 rooms
- 59+ rooms


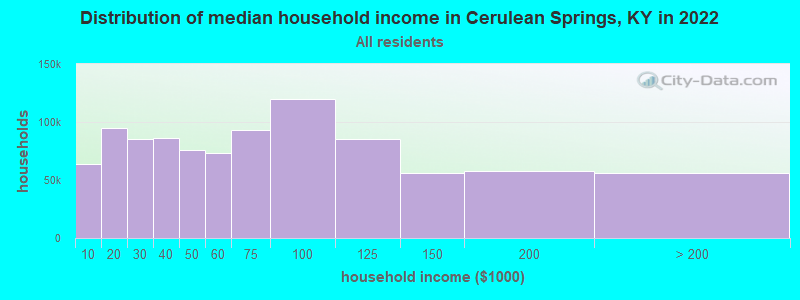
Cerulean Springs, KY household income distribution

- 55,671Less than $10,000
- 90,323$10,000 to $19,999
- 76,110$20,000 to $29,999
- 80,636$30,000 to $39,999
- 61,619$40,000 to $49,999
- 67,699$50,000 to $59,999
- 77,665$60,000 to $74,999
- 107,633$75,000 to $99,999
- 76,916$100,000 to $124,999
- 47,194$125,000 to $149,999
- 46,774$150,000 to $199,999
- 40,210$200,000 or more
Percentage of workers working in this county: 55.9%
Number of people working at home: 101 (8.5% of all workers)
Travel time to work (commute)
- Less than 5 minutes: 4
- 5 to 9 minutes: 51
- 10 to 14 minutes: 103
- 15 to 19 minutes: 212
- 20 to 24 minutes: 208
- 25 to 29 minutes: 29
- 30 to 34 minutes: 204
- 35 to 39 minutes: 5
- 40 to 44 minutes: 4
- 45 to 59 minutes: 149
- 60 to 89 minutes: 48
- 90 or more minutes: 68
Means of transportation to work:
- Drove a car alone: 890 (77.8%)
- Carpooled: 172 (15.0%)
- Bus or trolley bus: 6 (0.5%)
- Walked: 10 (0.9%)
- Other means: 7 (0.6%)
- Worked at home: 59 (5.2%)


- Year of entry for the foreign-born population in Cerulean Springs, Kentucky
- 111995 to March 2000
- 01990 to 1994
- 01985 to 1989
- 01980 to 1984
- 101975 to 1979
- 01970 to 1974
- 01965 to 1969
- 0Before 1965
Most common places of birth for foreign-born residents (%):
| Cerulean Springs: | 66.7% (14) |
| Kentucky: | 8.3% (6,658) |
| Cerulean Springs: | 33.3% (7) |
| Kentucky: | 3.2% (2,532) |
Place of birth for U.S.-born residents:
- This state: 1,784
- Other state: 795
- Northeast: 63
- Midwest: 509
- South: 190
- West: 33
65% of Cerulean Springs residents lived in the same house 5 years ago.
Out of people who lived in different houses, 42% lived in this county.
Out of people who lived in different counties, 40% lived in Kentucky.
Education attainment for males 25 years and older:
- No schooling: 0
- Nursery to 4th grade: 36
- 5th and 6th grade: 12
- 7th and 8th grade: 77
- 9th grade: 5
- 10th grade: 43
- 11th grade: 43
- 12th grade, no diploma: 64
- High school graduate (or equivalency): 311
- Less than 1 year of college: 63
- Some college more than 1 year, no degree: 100
- Associate degree: 16
- Bachelor's degree: 70
- Master's degree: 30
- Professional school degree: 14
- Doctorate degree: 8

Education attainment for females 25 years and older:
- No schooling: 0
- Nursery to 4th grade: 0
- 5th and 6th grade: 15
- 7th and 8th grade: 59
- 9th grade: 46
- 10th grade: 27
- 11th grade: 31
- 12th grade, no diploma: 41
- High school graduate (or equivalency): 366
- Less than 1 year of college: 97
- Some college more than 1 year, no degree: 101
- Associate degree: 64
- Bachelor's degree: 53
- Master's degree: 26
- Professional school degree: 27
- Doctorate degree: 4


Housing units in structures:
- One, detached: 1,105
- One, attached: 6
- Two: 6
- Mobile homes: 508
- Boats, RVs, vans, etc.: 6
Median worth of mobile homes: $91,390
Housing units lacking complete kitchen facilities: 2.5%

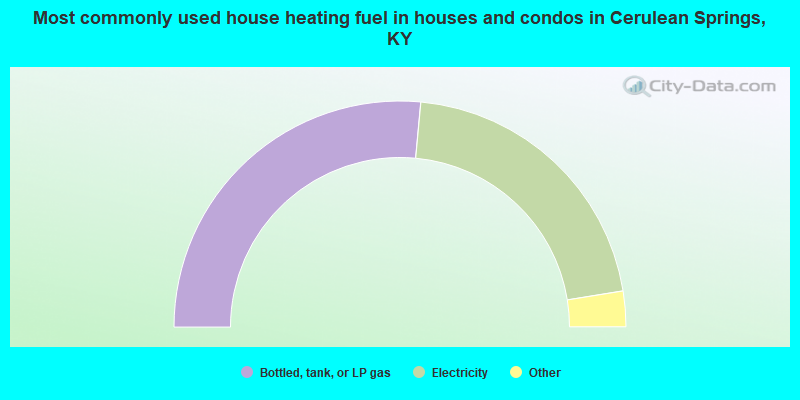
- 53.0%Bottled, tank, or LP gas
- 42.0%Electricity
- 3.3%Wood
- 0.7%Utility gas
- 0.7%Coal or coke
- 0.4%No fuel used
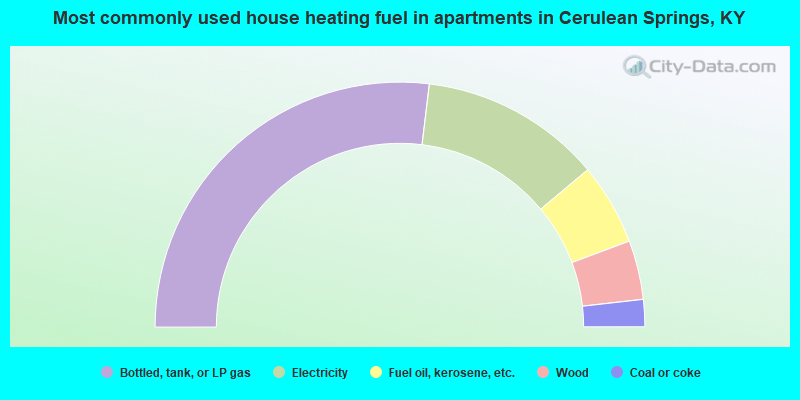
- 53.9%Bottled, tank, or LP gas
- 24.0%Electricity
- 10.8%Fuel oil, kerosene, etc.
- 7.8%Wood
- 3.6%Coal or coke
Private vs. public school enrollment:
| Here: | 2.6% |
| Kentucky: | 11.9% |
| Here: | 0.0% |
| Kentucky: | 10.6% |
| Here: | 15.5% |
| Kentucky: | 18.1% |


