Central Islip, NY (New York) Houses and Residents
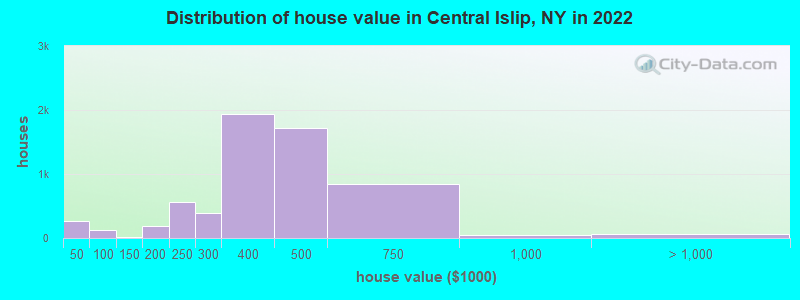
Estimated median house or condo value in 2022: $406,607 (it was $134,500 in 2000 )
Central Islip:
$406,607New York:
$400,400
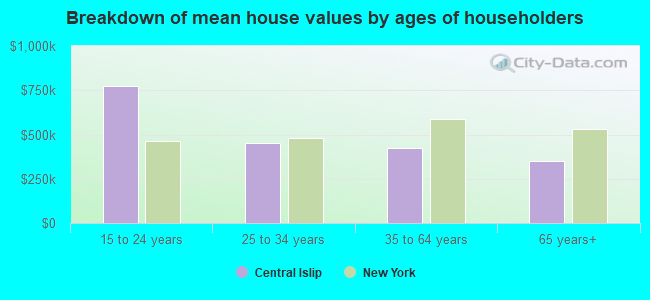
Lower value quartile - upper value quartile: $311,948 - $470,289Mean price in 2022: Detached houses: $387,026 Here:
$387,026State:
$476,719
Townhouses or other attached units: $397,202 Here:
$397,202State:
$699,270
In 2-unit structures: $448,113 Here:
$448,113State:
$713,077
In 3-to-4-unit structures: $391,462 Here:
$391,462State:
$764,568
In 5-or-more-unit structures: $266,180 Here:
$266,180State:
$912,009
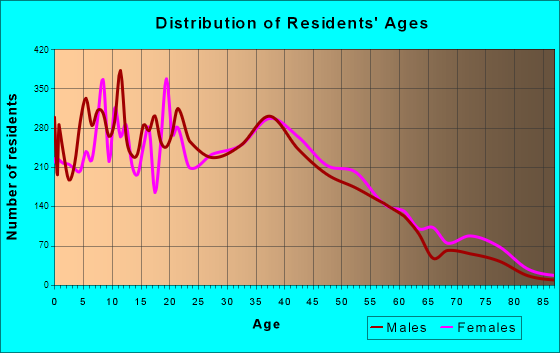
Total population: 34,450 (Urban population: 31,881, Rural population: 0)
Houses: 10,574 (9,777 occupied: 7,270 owner occupied, 2,503 renter occupied )
% of renters here:
26%State:
46%
Housing density: 1,456 houses/condos per square mile
Median price asked for vacant for-sale houses and condos in 2022: $642,568.
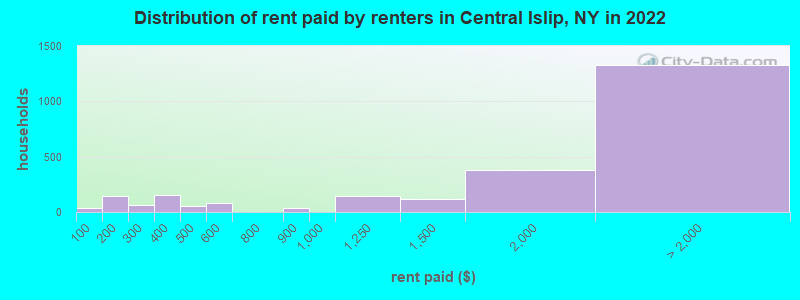
Median contract rent in 2022: $1,988 (lower quartile is $1,047, upper quartile is over $2,000)
Median rent asked for vacant for-rent units in 2022: $2,035
Median gross rent in Central Islip, NY in 2022: over $2,000
Housing units in Central Islip with a mortgage: 5,133 (316 second mortgage, 0 home equity loan, 226 both second mortgage and home equity loan )Houses without a mortgage: 31
Median household income for houses/condos with a mortgage: $124,896
Median household income for apartments without a mortgage: $83,199
Median monthly housing costs: $2,223
Data:
Median house or condo value ($)
Median house or condo value ($ change since 2000)
Median house or condo value ($) - White
Median house or condo value ($) - Black or African American
Median house or condo value ($) - Asian
Median house or condo value ($) - Hispanic or Latino
Median house or condo value ($) - American Indian and Alaska Native
Median house or condo value ($) - Multirace
Median house or condo value ($) - Other Race
Median price asked for mobile homes ($)
Household density (households per square mile)
Mean house or condo value by units in structure - 1, detached ($)
Mean house or condo value by units in structure - 1, attached ($)
Mean house or condo value by units in structure - 2 ($)
Mean house or condo value by units in structure by units in structure - 3 or 4 ($)
Mean house or condo value by units in structure - 5 or more ($)
Mean house or condo value by units in structure - Boat, RV, van, etc. ($)
Mean house or condo value by units in structure - Mobile home ($)
Median contract rent ($)
Median contract rent - Lower quartile ($)
Median contract rent - Upper quartile ($)
Median gross rent ($)
Urban houses (%)
Rural houses (%)
Houses occupied (%)
Houses occupied (% change since 2000)
Houses owner occupied (%)
Houses owner occupied (% change since 2000)
Houses renter occupied (%)
Houses renter occupied (% change since 2000)
Vacant housing units - For rent (%)
Vacant housing units - For rent (% change since 2000)
Vacant housing units - For sale only (%)
Vacant housing units - For sale only (% change since 2000)
Vacant housing units - Rented or sold, not occupied (%)
Vacant housing units - Rented or sold, not occupied (% change since 2000)
Vacant housing units - For seasonal, recreational, or occasional use (%)
Vacant housing units - For seasonal, recreational, or occasional use (% change since 2000)
Vacant housing units - For migrant workers (%)
Vacant housing units - For migrant workers (% change since 2000)
Vacant housing units - Other vacant (%)
Vacant housing units - Other vacant (% change since 2000)
Median monthly housing costs ($)
Median household income for houses/condos with a mortgage ($)
Median household income for houses/condos without a mortgage ($)
Median household income ($)
Median household income ($) - White
Median household income ($) - Black or African American
Median household income ($) - Asian
Median household income ($) - Hispanic or Latino
Median household income ($) - American Indian and Alaska Native
Median household income ($) - Multirace
Median household income ($) - Other Race
Mortgage status - with mortgage (%)
Mortgage status - with second mortgage (%)
Mortgage status - with home equity loan (%)
Mortgage status - with both second mortgage and home equity loan (%)
Mortgage status - without a mortgage (%)
Median year house/condo built
Median year apartment built
Household type by relationship - Male householder living alone (%)
Household type by relationship - Male householder not living alone (%)
Household type by relationship - Female householder living alone (%)
Household type by relationship - Female householder not living alone (%)
Household type by relationship - Opposite-Sex spouse (%)
Household type by relationship - Same-Sex spouse (%)
Household type by relationship - Opposite-Sex unmarried partner (%)
Household type by relationship - Same-Sex unmarried partner (%)
Household type by relationship - In group quarters (%)
Size of family households - 2-person household (%)
Size of family households - 3-person household (%)
Size of family households - 4-person household (%)
Size of family households - 5-person household (%)
Size of family households - 6-person household (%)
Size of family households - 7-or-more-person household (%)
Size of nonfamily households - 1-person household (%)
Size of nonfamily households - 2-person household (%)
Size of nonfamily households - 3-person household (%)
Size of nonfamily households - 4-person household (%)
Size of nonfamily households - 5-person household (%)
Size of nonfamily households - 6-person household (%)
Size of nonfamily households - 7-or-moreperson household (%)
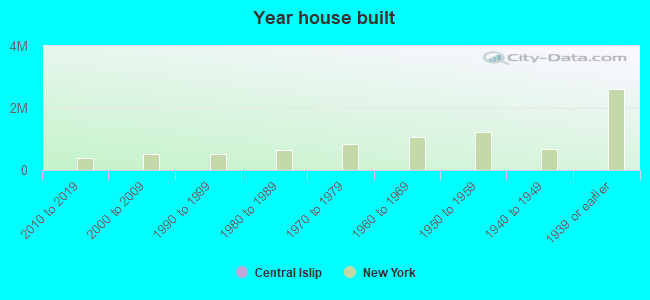
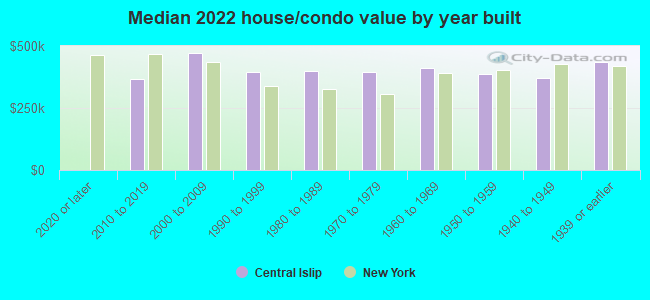
Year house built - Built 2010 or later (%)
Year house built - Built 2000 to 2009 (%)
Year house built - Built 1990 to 1999 (%)
Year house built - Built 1980 to 1989 (%)
Year house built - Built 1970 to 1979 (%)
Year house built - Built 1960 to 1969 (%)
Year house built - Built 1950 to 1959 (%)
Year house built - Built 1940 to 1949 (%)
Year house built - Built 1939 or earlier (%)
Median number of rooms in houses and condos
Median number of rooms in apartments
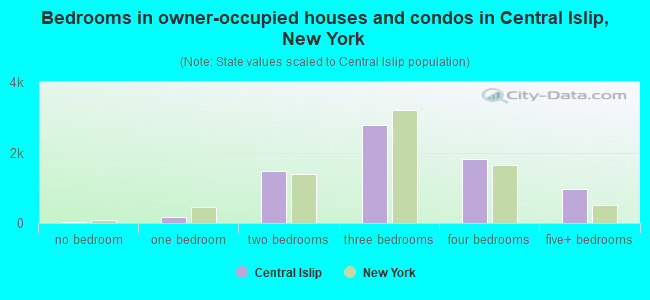
Median number of bedrooms in owner occupied houses
Mean number of bedrooms in owner occupied houses
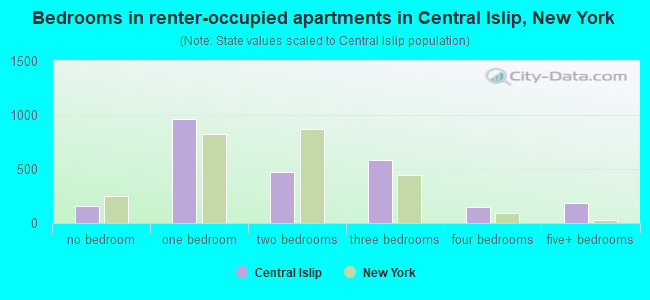
Median number of bedrooms in renter occupied houses
Mean number of bedrooms in renter occupied houses
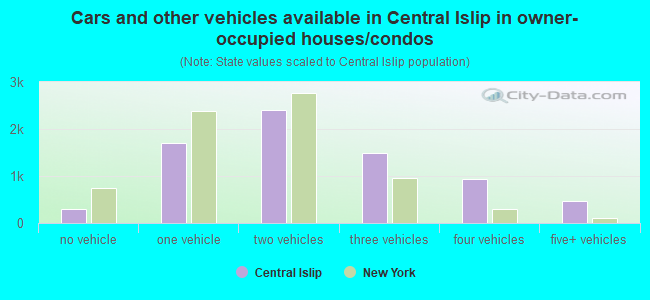
Median number of vehichles in owner occupied houses
Mean number of vehichles in owner occupied houses
Median number of vehichles in renter occupied houses
Mean number of vehichles in renter occupied houses
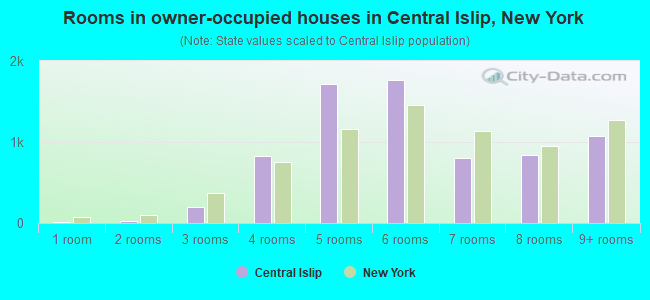
Rooms in owner-occupied houses - 1 room (%)
Rooms in owner-occupied houses - 2 rooms (%)
Rooms in owner-occupied houses - 3 rooms (%)
Rooms in owner-occupied houses - 4 rooms (%)
Rooms in owner-occupied houses - 5 rooms (%)
Rooms in owner-occupied houses - 6 rooms (%)
Rooms in owner-occupied houses - 7 rooms (%)
Rooms in owner-occupied houses - 8 rooms (%)
Rooms in owner-occupied houses - 9+ rooms (%)
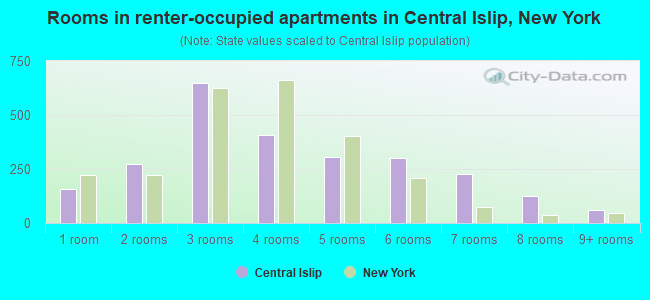
Rooms in renter-occupied houses - 1 room (%)
Rooms in renter-occupied houses - 2 rooms (%)
Rooms in renter-occupied houses - 3 rooms (%)
Rooms in renter-occupied houses - 4 rooms (%)
Rooms in renter-occupied houses - 5 rooms (%)
Rooms in renter-occupied houses - 6 rooms (%)
Rooms in renter-occupied houses - 7 rooms (%)
Rooms in renter-occupied houses - 8 rooms (%)
Rooms in renter-occupied houses - 9+ rooms (%)
Bedrooms in owner-occupied houses - no bedrooms (%)
Bedrooms in owner-occupied houses - 1 bedroom (%)
Bedrooms in owner-occupied houses - 2 bedrooms (%)
Bedrooms in owner-occupied houses - 3 bedrooms (%)
Bedrooms in owner-occupied houses - 4 bedrooms (%)
Bedrooms in owner-occupied houses - 5+ bedrooms (%)
Bedrooms in renter-occupied houses - no bedrooms (%)
Bedrooms in renter-occupied houses - 1 bedroom (%)
Bedrooms in renter-occupied houses - 2 bedrooms (%)
Bedrooms in renter-occupied houses - 3 bedrooms (%)
Bedrooms in renter-occupied houses - 4 bedrooms (%)
Bedrooms in renter-occupied houses - 5+ bedrooms (%)
Vehicles available in owner-occupied houses - no vehicle available (%)
Vehicles available in owner-occupied houses - 1 vehicle available(%)
Vehicles available in owner-occupied houses - 2 Vehicles available (%)
Vehicles available in owner-occupied houses - 3 Vehicles available (%)
Vehicles available in owner-occupied houses - 4 Vehicles available (%)
Vehicles available in owner-occupied houses - 5+ Vehicles available (%)
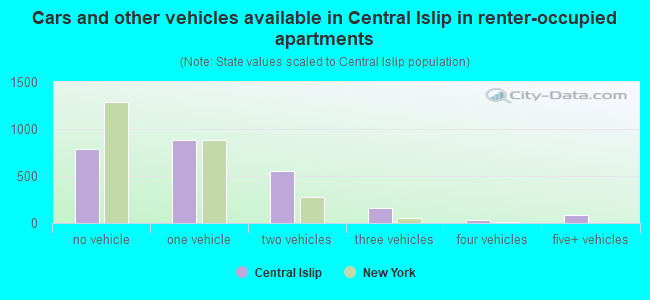
Vehicles available in renter-occupied houses - no vehicle available (%)
Vehicles available in renter-occupied houses - 1 vehicle available (%)
Vehicles available in renter-occupied houses - 2 Vehicles available (%)
Vehicles available in renter-occupied houses - 3 Vehicles available (%)
Vehicles available in renter-occupied houses - 4 Vehicles available (%)
Vehicles available in renter-occupied houses - 5+ Vehicles available (%)
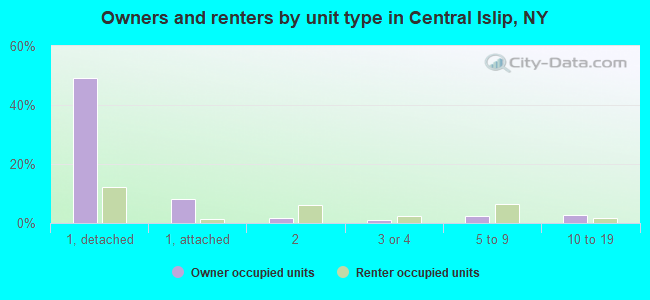
Housing units in structures - 1, detached (%)
Housing units in structures - 1, attached (%)
Housing units in structures - 2 (%)
Housing units in structures - 3 or 4 (%)
Housing units in structures - 5 to 9 (%)
Housing units in structures - 10 to 19 (%)
Housing units in structures - 20 to 49 (%)
Housing units in structures - 50 or more (%)
Housing units in structures - Mobile home (%)
Housing units in structures - Boat, RV, van, etc. (%)
Housing units in structures - Owners - 1, detached (%)
Housing units in structures - Owners - 1, attached (%)
Housing units in structures - Owners - 2 (%)
Housing units in structures - Owners - 3 or 4 (%)
Housing units in structures - Owners - 5 to 9 (%)
Housing units in structures - Owners - 10 to 19 (%)
Housing units in structures - Owners - 20 to 49 (%)
Housing units in structures - Owners - 50 or more (%)
Housing units in structures - Owners - Mobile home (%)
Housing units in structures - Owners - Boat, RV, van, etc. (%)
Housing units in structures - Renters - 1, detached (%)
Housing units in structures - Renters - 1, attached (%)
Housing units in structures - Renters - 2 (%)
Housing units in structures - Renters - 3 or 4 (%)
Housing units in structures - Renters - 5 to 9 (%)
Housing units in structures - Renters - 10 to 19 (%)
Housing units in structures - Renters - 20 to 49 (%)
Housing units in structures - Renters - 50 or more (%)
Housing units in structures - Renters - Mobile home (%)
Housing units in structures - Renters - Boat, RV, van, etc. (%)
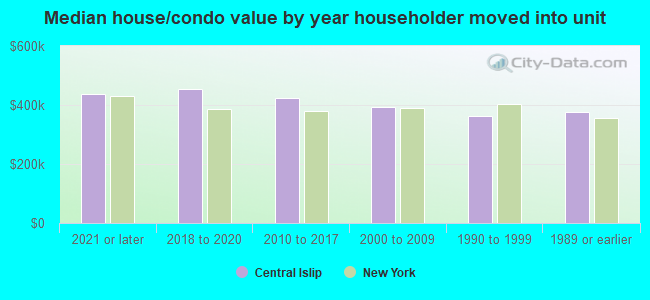
House/condo owner moved in on average (years ago)
Renter moved in on average (years ago)
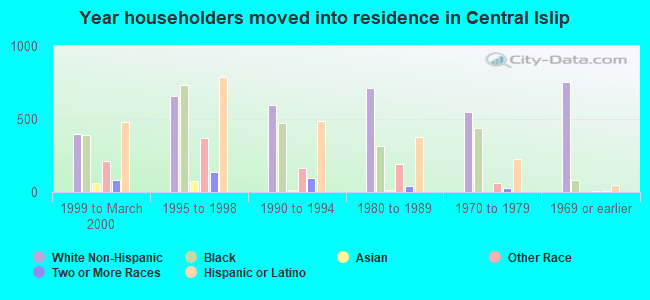
Year householder moved into unit - Moved in 1999 to March 2000 (%)
Year householder moved into unit - Moved in 1999 to March 2000 (%) - White
Year householder moved into unit - Moved in 1999 to March 2000 (%) - Black or African American
Year householder moved into unit - Moved in 1999 to March 2000 (%) - Asian
Year householder moved into unit - Moved in 1999 to March 2000 (%) - Hispanic or Latino
Year householder moved into unit - Moved in 1999 to March 2000 (%) - American Indian and Alaska Native
Year householder moved into unit - Moved in 1999 to March 2000 (%) - Multirace
Year householder moved into unit - Moved in 1999 to March 2000 (%) - Other Race
Year householder moved into unit - Moved in 1995 to 1998 (%)
Year householder moved into unit - Moved in 1995 to 1998 (%) - White
Year householder moved into unit - Moved in 1995 to 1998 (%) - Black or African American
Year householder moved into unit - Moved in 1995 to 1998 (%) - Asian
Year householder moved into unit - Moved in 1995 to 1998 (%) - Hispanic or Latino
Year householder moved into unit - Moved in 1995 to 1998 (%) - American Indian and Alaska Native
Year householder moved into unit - Moved in 1995 to 1998 (%) - Multirace
Year householder moved into unit - Moved in 1995 to 1998 (%) - Other Race
Year householder moved into unit - Moved in 1990 to 1994 (%)
Year householder moved into unit - Moved in 1990 to 1994 (%) - White
Year householder moved into unit - Moved in 1990 to 1994 (%) - Black or African American
Year householder moved into unit - Moved in 1990 to 1994 (%) - Asian
Year householder moved into unit - Moved in 1990 to 1994 (%) - Hispanic or Latino
Year householder moved into unit - Moved in 1990 to 1994 (%) - American Indian and Alaska Native
Year householder moved into unit - Moved in 1990 to 1994 (%) - Multirace
Year householder moved into unit - Moved in 1990 to 1994 (%) - Other Race
Year householder moved into unit - Moved in 1980 to 1989 (%)
Year householder moved into unit - Moved in 1980 to 1989 (%) - White
Year householder moved into unit - Moved in 1980 to 1989 (%) - Black or African American
Year householder moved into unit - Moved in 1980 to 1989 (%) - Asian
Year householder moved into unit - Moved in 1980 to 1989 (%) - Hispanic or Latino
Year householder moved into unit - Moved in 1980 to 1989 (%) - American Indian and Alaska Native
Year householder moved into unit - Moved in 1980 to 1989 (%) - Multirace
Year householder moved into unit - Moved in 1980 to 1989 (%) - Other Race
Year householder moved into unit - Moved in 1970 to 1979 (%)
Year householder moved into unit - Moved in 1970 to 1979 (%) - White
Year householder moved into unit - Moved in 1970 to 1979 (%) - Black or African American
Year householder moved into unit - Moved in 1970 to 1979 (%) - Asian
Year householder moved into unit - Moved in 1970 to 1979 (%) - Hispanic or Latino
Year householder moved into unit - Moved in 1970 to 1979 (%) - American Indian and Alaska Native
Year householder moved into unit - Moved in 1970 to 1979 (%) - Multirace
Year householder moved into unit - Moved in 1970 to 1979 (%) - Other Race
Year householder moved into unit - Moved in 1969 or earlier (%)
Year householder moved into unit - Moved in 1969 or earlier (%) - White
Year householder moved into unit - Moved in 1969 or earlier (%) - Black or African American
Year householder moved into unit - Moved in 1969 or earlier (%) - Asian
Year householder moved into unit - Moved in 1969 or earlier (%) - Hispanic or Latino
Year householder moved into unit - Moved in 1969 or earlier (%) - American Indian and Alaska Native
Year householder moved into unit - Moved in 1969 or earlier (%) - Multirace
Year householder moved into unit - Moved in 1969 or earlier (%) - Other Race
Housing units lacking complete plumbing facilities (%)
Housing units lacking complete kitchen facilities (%)
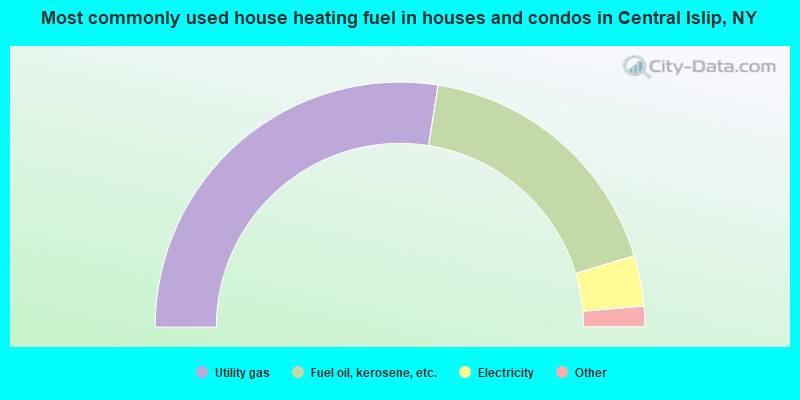
House heating fuel used in houses and condos - Utility gas (%)
House heating fuel used in houses and condos - Bottled, tank, or LP gas (%)
House heating fuel used in houses and condos - Electricity (%)
House heating fuel used in houses and condos - Fuel oil, kerosene, etc. (%)
House heating fuel used in houses and condos - Coal or coke (%)
House heating fuel used in houses and condos - Wood (%)
House heating fuel used in houses and condos - Solar energy (%)
House heating fuel used in houses and condos - Other fuel (%)
House heating fuel used in houses and condos - No fuel used (%)
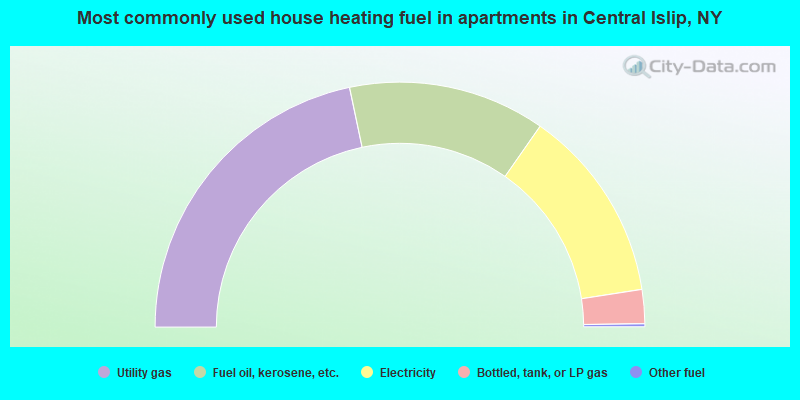
House heating fuel used in apartments - Utility gas (%)
House heating fuel used in apartments - Bottled, tank, or LP gas (%)
House heating fuel used in apartments - Electricity (%)
House heating fuel used in apartments - Fuel oil, kerosene, etc. (%)
House heating fuel used in apartments - Coal or coke (%)
House heating fuel used in apartments - Wood (%)
House heating fuel used in apartments - Solar energy (%)
House heating fuel used in apartments - Other fuel (%)
House heating fuel used in apartments - No fuel used (%)
Median year house/condo built: 1970Median year apartment built: 1968Household type by relationship:
Households: 36,542
Male householders: 4,424 (1,014 living alone ), Female householders: 5,330 (1,281 living alone )3,827 spouses (3,817 opposite-sex spouses ), 1,039 unmarried partners , (1,028 opposite-sex unmarried partners ), 11,641 children (10,925 natural , 139 adopted , 577 stepchildren ), 1,708 grandchildren , 1,043 brothers or sisters , 1,260 parents , 0 foster children , 2,558 other relatives , 3,454 non-relatives In group quarters: 253
Size of family households: 1,692 2-persons , 1,289 3-persons , 1,587 4-persons , 593 5-persons , 457 6-persons , 1,131 7-or-more-persons .
Size of nonfamily households: 2,314 1-person , 427 2-persons , 96 3-persons , 57 4-persons , 45 5-persons , 58 6-persons , 41 7-or-more-persons .
3,356 married couples with children. single-parent households (749 men , 1,930 women ).
41.6% of residents of Central Islip speak English at home. of residents speak Spanish at home (52% speak English very well , 19% speak English well , 22% speak English not well , 7% don't speak English at all ).of residents speak other Indo-European language at home (65% speak English very well , 27% speak English well , 5% speak English not well , 4% don't speak English at all ).of residents speak Asian or Pacific Island language at home (46% speak English very well , 21% speak English well , 33% speak English not well , 1% don't speak English at all ).of residents speak other language at home (69% speak English very well , 31% speak English well ).
Foreign born population: 13,713 (37.5%)of them are naturalized citizens )
Median number of rooms in houses and condos:
Median number of rooms in apartments
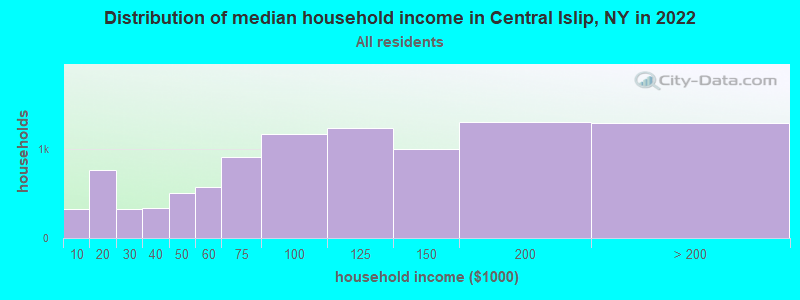
Central Islip, NY household income distribution 326 Less than $10,000762 $10,000 to $19,999330 $20,000 to $29,999336 $30,000 to $39,999507 $40,000 to $49,999573 $50,000 to $59,999912 $60,000 to $74,9991,173 $75,000 to $99,9991,233 $100,000 to $124,9991,005 $125,000 to $149,9991,305 $150,000 to $199,9991,289 $200,000 or more
Home value of owner - occupied houses in 2022 in Central Islip, NY 141 Less than $10,00037 $10,000 to $14,99915 $25,000 to $29,99927 $30,000 to $34,99915 $35,000 to $39,99930 $40,000 to $49,99959 $50,000 to $59,99930 $70,000 to $79,99916 $100,000 to $124,9991 $125,000 to $149,99934 $150,000 to $174,999149 $175,000 to $199,999567 $200,000 to $249,999390 $250,000 to $299,9991,931 $300,000 to $399,9991,724 $400,000 to $499,999843 $500,000 to $749,99949 $750,000 to $999,9997 $1,000,000 to $1,499,99933 $1,500,000 to $1,999,99919 $2,000,000 or moreRent paid by renters in 2022 in Central Islip, NY 34 Less than $10018 $100 to $149129 $150 to $19920 $200 to $24943 $250 to $29994 $300 to $34962 $350 to $39943 $400 to $44914 $450 to $49938 $500 to $54938 $550 to $59938 $800 to $899145 $1,000 to $1,249115 $1,250 to $1,499376 $1,500 to $1,999860 $2,000 to $2,499294 $2,500 to $2,99938 $3,000 to $3,499135 No cash rent
Percentage of workers working in this county: 81.8%Number of people working at home: 1,628 (9.0% of all workers )
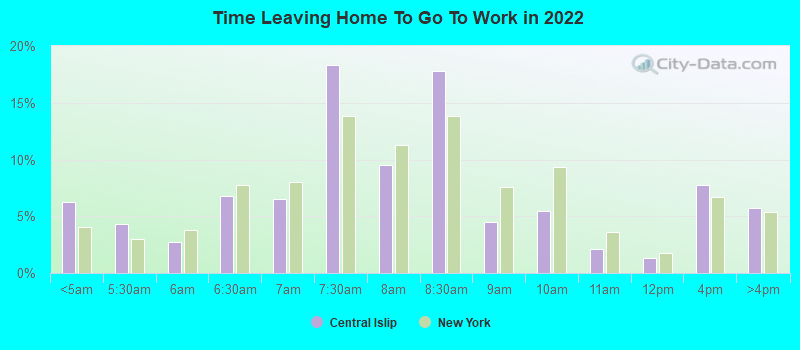
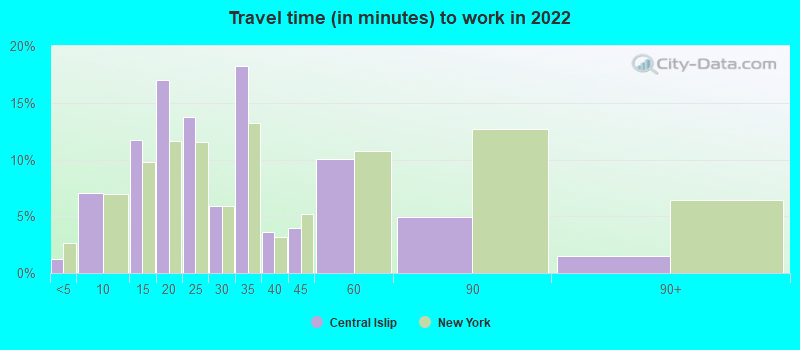
Travel time to work (commute)
Less than 5 minutes: 1495 to 9 minutes: 98010 to 14 minutes: 1,24915 to 19 minutes: 2,58820 to 24 minutes: 2,77025 to 29 minutes: 1,27930 to 34 minutes: 3,51335 to 39 minutes: 51640 to 44 minutes: 56045 to 59 minutes: 1,10360 to 89 minutes: 73990 or more minutes: 586
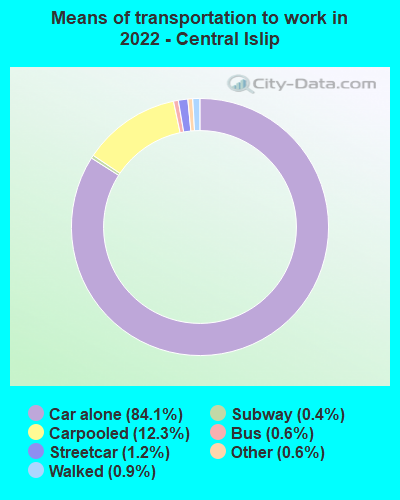
Means of transportation to work:
Drove a car alone: 7,020 (69.8%)Carpooled: 1,179 (11.7%)Bus : 45 (0.4%)Subway or elevated rail : 105 (1.0%)Long-distance train or commuter rail : 33 (0.3%)Taxi: 62 (0.6%)Walked: 76 (0.8%)Worked at home: 1,628 (16.2%)
Unemployment by race in 2022
Unemployment rate for White non-Hispanic residents 2.7% Males2.4% FemalesUnemployment rate for Black residents 5.5% Males1.2% FemalesUnemployment rate for American Indian and Alaska Native residents 12.4% MalesUnemployment rate for Asian residents 9.2% Males2.0% FemalesUnemployment rate for other race residents 1.2% Males2.2% FemalesUnemployment rate for two or more race residents 7.9% Males4.7% FemalesUnemployment rate for Hispanic or Latino residents 4.6% Males3.6% Females
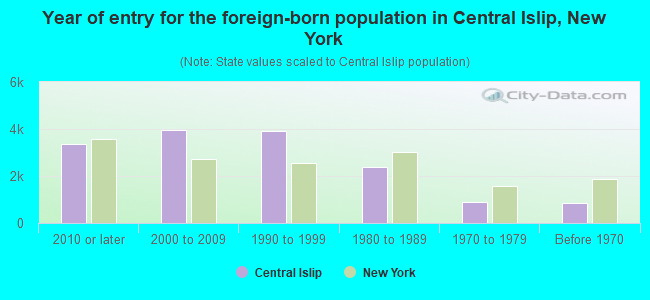
Year of entry for the foreign-born population in Central Islip, New York
3,350 2010 or later 3,976 2000 to 2009 3,895 1990 to 1999 2,373 1980 to 1989 914 1970 to 1979 848 Before 1970
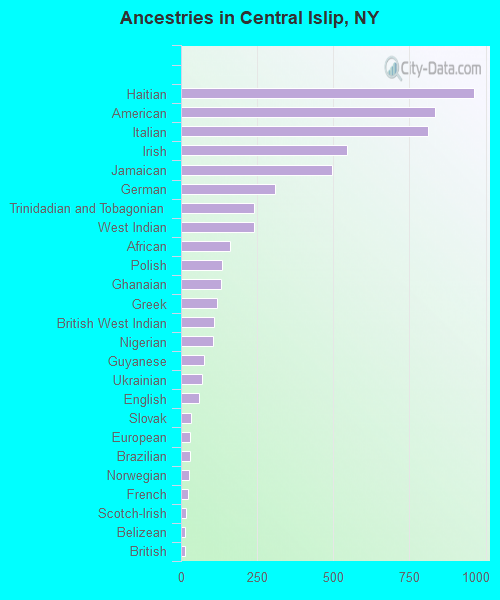
First ancestries reported:
Haitian: 963 (4.2%)
American: 834 (3.6%)
Italian: 811 (3.5%)
Irish: 544 (2.4%)
Jamaican: 496 (2.2%)
German: 308 (1.3%)
Trinidadian and Tobagonian: 241 (1.1%)
West Indian: 240 (1.0%)
African: 161 (0.7%)
Polish: 134 (0.6%)
Ghanaian: 132 (0.6%)
Greek: 118 (0.5%)
British West Indian: 109 (0.5%)
Nigerian: 105 (0.5%)
Guyanese: 77 (0.3%)
Ukrainian: 68 (0.3%)
English: 58 (0.3%)
Slovak: 33 (0.1%)
European: 31 (0.1%)
Brazilian: 28 (0.1%)
Norwegian: 26 (0.1%)
French: 24 (0.1%)
Scotch-Irish: 15 (0.07%)
Belizean: 14 (0.06%)
British: 13 (0.06%)
French Canadian: 11 (0.05%)
Lebanese: 7 (0.03%)
Czech: 7 (0.03%)
Hungarian: 6 (0.03%)
Barbadian: 4 (0.02%) Most common places of birth for foreign-born residents (%): El Salvador Central Islip:
33.4% (4,223)New York:
2.4% (108,067)
Honduras Central Islip:
12.4% (1,572)New York:
1.2% (55,571)
Dominican Republic Central Islip:
9.7% (1,227)New York:
11.1% (501,040)
Haiti Central Islip:
6.3% (802)New York:
2.8% (126,936)
Peru Central Islip:
4.7% (599)New York:
1.2% (54,759)
Ecuador Central Islip:
4.7% (596)New York:
3.9% (177,448)
Guatemala Central Islip:
4.6% (577)New York:
1.4% (61,245)
Colombia Central Islip:
3.9% (488)New York:
2.5% (111,920)
India Central Islip:
2.2% (276)New York:
3.5% (158,432)
Trinidad and Tobago Central Islip:
1.9% (239)New York:
2.0% (91,428)
Jamaica Central Islip:
1.8% (228)New York:
5.0% (227,557)
Place of birth for U.S.-born residents:
This state: 19,656Other state: 2,283Northeast: 567Midwest: 142South: 1,334West: 89 91.5% of Central Islip residents lived in the same house 1 years ago.
Out of people who lived in different houses, 30.2% lived in this county.
Out of people who lived in different counties, 71.9% lived in New York.
Central Islip:
91.5%State average:
89.6%
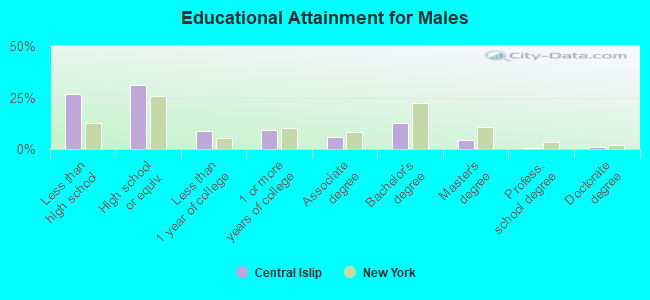
Education attainment for males 25 years and older:
No schooling: 858Nursery to 4th grade: 1155th and 6th grade: 3477th and 8th grade: 4339th grade: 21810th grade: 26811th grade: 7812th grade, no diploma: 798High school graduate (or equivalency): 3,603Less than 1 year of college: 1,033Some college more than 1 year, no degree: 1,056Associate degree: 660Bachelor's degree: 1,453Master's degree: 511Professional school degree: 84Doctorate degree: 88
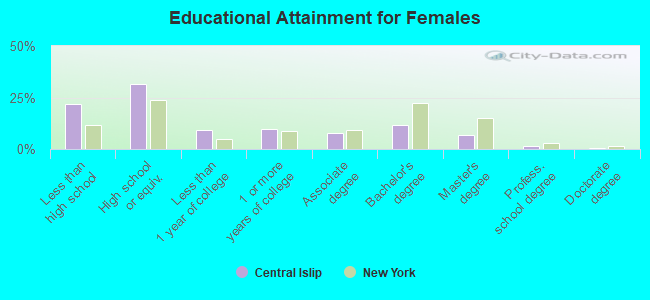
Education attainment for females 25 years and older:
No schooling: 822Nursery to 4th grade: 1485th and 6th grade: 2727th and 8th grade: 2669th grade: 13410th grade: 17011th grade: 18912th grade, no diploma: 518High school graduate (or equivalency): 3,693Less than 1 year of college: 1,055Some college more than 1 year, no degree: 1,103Associate degree: 884Bachelor's degree: 1,363Master's degree: 794Professional school degree: 180Doctorate degree: 46
Housing units in structures:
One, detached: 7,201One, attached: 1,603Two: 4053 or 4: 1005 to 9: 42710 to 19: 30320 to 49: 9250 or more: 378Mobile homes: 33Boats, RVs, vans, etc.: 29Housing units lacking complete plumbing facilities in 2022: 1.2%Housing units lacking complete kitchen facilities in 2022: 1.5%House/condo owner moved in on average 11 years ago
Renter moved in on average 6 years ago
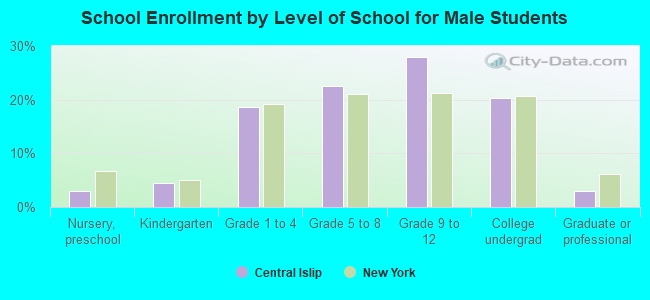
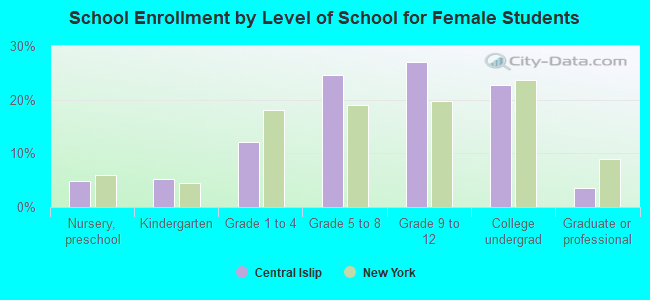
Private vs. public school enrollment:
Students in private schools in grades 1 to 8 (elementary and middle school): 143 Students in private schools in grades 9 to 12 (high school): 126 Students in private undergraduate colleges: 90