Casper, WY (Wyoming) Houses and Residents
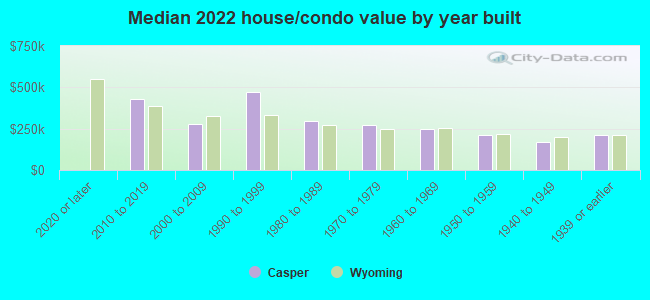
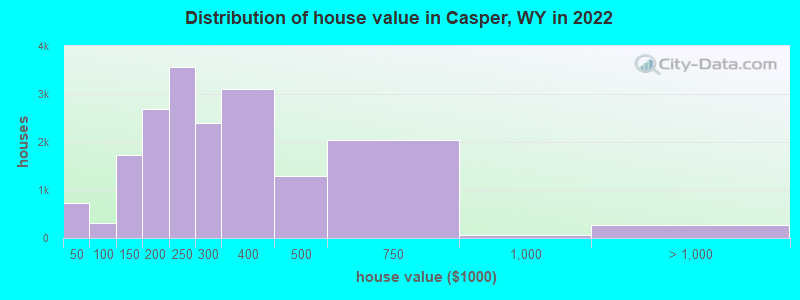
Estimated median house or condo value in 2022: $254,469 (it was $83,100 in 2000 )
Casper:
$254,469Wyoming:
$292,300
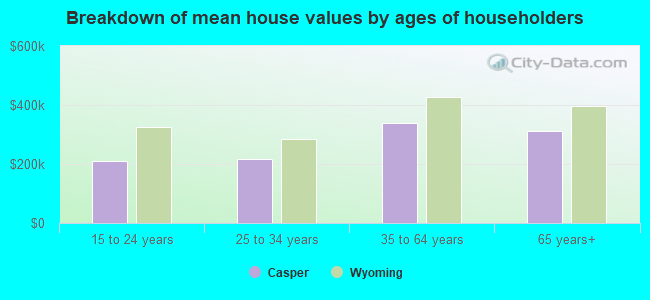
Lower value quartile - upper value quartile: $184,148 - $370,030Mean price in 2022: Detached houses: $352,045 Here:
$352,045State:
$440,428
Townhouses or other attached units: $364,326 Here:
$364,326State:
$366,317
In 2-unit structures: $559,562 Here:
$559,562State:
$506,426
In 3-to-4-unit structures: $481,519 Here:
$481,519State:
$430,152
In 5-or-more-unit structures: $150,750 Here:
$150,750State:
$417,840
Mobile homes: $99,651 Here:
$99,651State:
$108,030
Total population: 60,086 (Urban population: 49,500, Rural population: 355 (12 farm, 343 nonfarm ))
Houses: 28,087 (25,353 occupied: 17,780 owner occupied, 7,757 renter occupied )
% of renters here:
30%State:
27%
Housing density: 1,173 houses/condos per square mile
Median price asked for vacant for-sale houses and condos in 2022: $198,260.
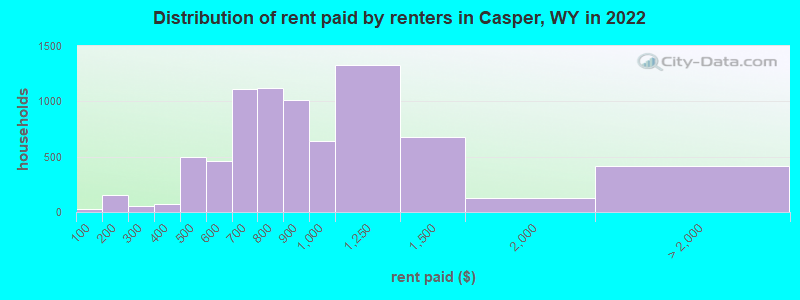
Median contract rent in 2022: $825 (lower quartile is $680, upper quartile is $1,033)
Median rent asked for vacant for-rent units in 2022: $1,449
Median gross rent in Casper, WY in 2022: $899
Housing units in Casper with a mortgage: 11,615 (809 second mortgage, 45 home equity loan, 262 both second mortgage and home equity loan )Houses without a mortgage: 214
Median household income for houses/condos with a mortgage: $87,292
Median household income for apartments without a mortgage: $73,995
Median monthly housing costs: $960
Data:
Median house or condo value ($)
Median house or condo value ($ change since 2000)
Median house or condo value ($) - White
Median house or condo value ($) - Black or African American
Median house or condo value ($) - Asian
Median house or condo value ($) - Hispanic or Latino
Median house or condo value ($) - American Indian and Alaska Native
Median house or condo value ($) - Multirace
Median house or condo value ($) - Other Race
Median price asked for mobile homes ($)
Household density (households per square mile)
Mean house or condo value by units in structure - 1, detached ($)
Mean house or condo value by units in structure - 1, attached ($)
Mean house or condo value by units in structure - 2 ($)
Mean house or condo value by units in structure by units in structure - 3 or 4 ($)
Mean house or condo value by units in structure - 5 or more ($)
Mean house or condo value by units in structure - Boat, RV, van, etc. ($)
Mean house or condo value by units in structure - Mobile home ($)
Median contract rent ($)
Median contract rent - Lower quartile ($)
Median contract rent - Upper quartile ($)
Median gross rent ($)
Urban houses (%)
Rural houses (%)
Houses occupied (%)
Houses occupied (% change since 2000)
Houses owner occupied (%)
Houses owner occupied (% change since 2000)
Houses renter occupied (%)
Houses renter occupied (% change since 2000)
Vacant housing units - For rent (%)
Vacant housing units - For rent (% change since 2000)
Vacant housing units - For sale only (%)
Vacant housing units - For sale only (% change since 2000)
Vacant housing units - Rented or sold, not occupied (%)
Vacant housing units - Rented or sold, not occupied (% change since 2000)
Vacant housing units - For seasonal, recreational, or occasional use (%)
Vacant housing units - For seasonal, recreational, or occasional use (% change since 2000)
Vacant housing units - For migrant workers (%)
Vacant housing units - For migrant workers (% change since 2000)
Vacant housing units - Other vacant (%)
Vacant housing units - Other vacant (% change since 2000)
Median monthly housing costs ($)
Median household income for houses/condos with a mortgage ($)
Median household income for houses/condos without a mortgage ($)
Median household income ($)
Median household income ($) - White
Median household income ($) - Black or African American
Median household income ($) - Asian
Median household income ($) - Hispanic or Latino
Median household income ($) - American Indian and Alaska Native
Median household income ($) - Multirace
Median household income ($) - Other Race
Mortgage status - with mortgage (%)
Mortgage status - with second mortgage (%)
Mortgage status - with home equity loan (%)
Mortgage status - with both second mortgage and home equity loan (%)
Mortgage status - without a mortgage (%)
Median year house/condo built
Median year apartment built
Household type by relationship - Male householder living alone (%)
Household type by relationship - Male householder not living alone (%)
Household type by relationship - Female householder living alone (%)
Household type by relationship - Female householder not living alone (%)
Household type by relationship - Opposite-Sex spouse (%)
Household type by relationship - Same-Sex spouse (%)
Household type by relationship - Opposite-Sex unmarried partner (%)
Household type by relationship - Same-Sex unmarried partner (%)
Household type by relationship - In group quarters (%)
Size of family households - 2-person household (%)
Size of family households - 3-person household (%)
Size of family households - 4-person household (%)
Size of family households - 5-person household (%)
Size of family households - 6-person household (%)
Size of family households - 7-or-more-person household (%)
Size of nonfamily households - 1-person household (%)
Size of nonfamily households - 2-person household (%)
Size of nonfamily households - 3-person household (%)
Size of nonfamily households - 4-person household (%)
Size of nonfamily households - 5-person household (%)
Size of nonfamily households - 6-person household (%)
Size of nonfamily households - 7-or-moreperson household (%)
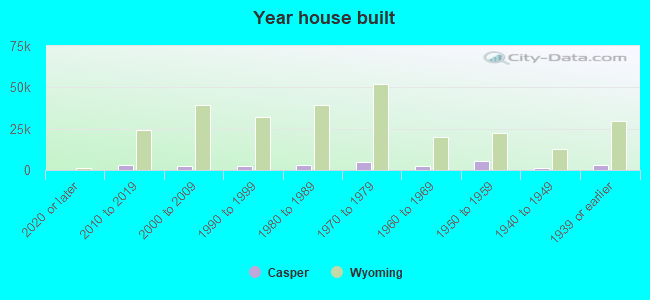
Year house built - Built 2010 or later (%)
Year house built - Built 2000 to 2009 (%)
Year house built - Built 1990 to 1999 (%)
Year house built - Built 1980 to 1989 (%)
Year house built - Built 1970 to 1979 (%)
Year house built - Built 1960 to 1969 (%)
Year house built - Built 1950 to 1959 (%)
Year house built - Built 1940 to 1949 (%)
Year house built - Built 1939 or earlier (%)
Median number of rooms in houses and condos
Median number of rooms in apartments
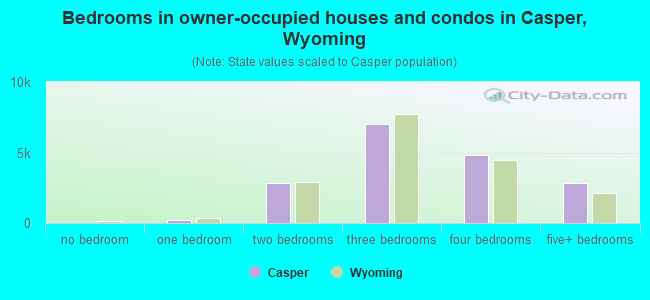
Median number of bedrooms in owner occupied houses
Mean number of bedrooms in owner occupied houses
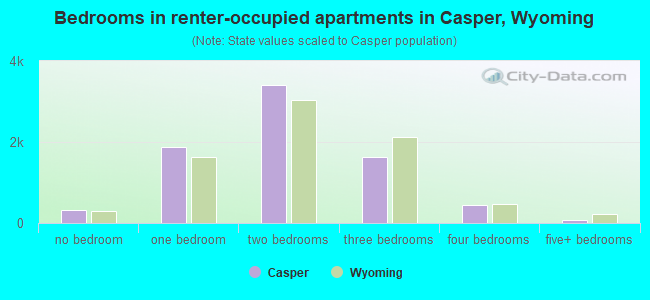
Median number of bedrooms in renter occupied houses
Mean number of bedrooms in renter occupied houses
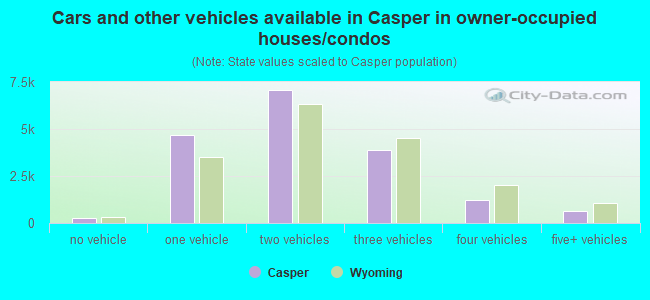
Median number of vehichles in owner occupied houses
Mean number of vehichles in owner occupied houses
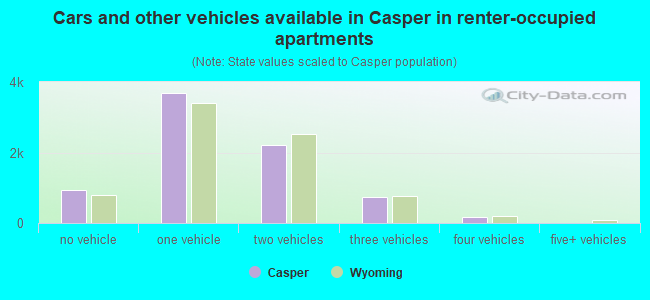
Median number of vehichles in renter occupied houses
Mean number of vehichles in renter occupied houses
Rooms in owner-occupied houses - 1 room (%)
Rooms in owner-occupied houses - 2 rooms (%)
Rooms in owner-occupied houses - 3 rooms (%)
Rooms in owner-occupied houses - 4 rooms (%)
Rooms in owner-occupied houses - 5 rooms (%)
Rooms in owner-occupied houses - 6 rooms (%)
Rooms in owner-occupied houses - 7 rooms (%)
Rooms in owner-occupied houses - 8 rooms (%)
Rooms in owner-occupied houses - 9+ rooms (%)
Rooms in renter-occupied houses - 1 room (%)
Rooms in renter-occupied houses - 2 rooms (%)
Rooms in renter-occupied houses - 3 rooms (%)
Rooms in renter-occupied houses - 4 rooms (%)
Rooms in renter-occupied houses - 5 rooms (%)
Rooms in renter-occupied houses - 6 rooms (%)
Rooms in renter-occupied houses - 7 rooms (%)
Rooms in renter-occupied houses - 8 rooms (%)
Rooms in renter-occupied houses - 9+ rooms (%)
Bedrooms in owner-occupied houses - no bedrooms (%)
Bedrooms in owner-occupied houses - 1 bedroom (%)
Bedrooms in owner-occupied houses - 2 bedrooms (%)
Bedrooms in owner-occupied houses - 3 bedrooms (%)
Bedrooms in owner-occupied houses - 4 bedrooms (%)
Bedrooms in owner-occupied houses - 5+ bedrooms (%)
Bedrooms in renter-occupied houses - no bedrooms (%)
Bedrooms in renter-occupied houses - 1 bedroom (%)
Bedrooms in renter-occupied houses - 2 bedrooms (%)
Bedrooms in renter-occupied houses - 3 bedrooms (%)
Bedrooms in renter-occupied houses - 4 bedrooms (%)
Bedrooms in renter-occupied houses - 5+ bedrooms (%)
Vehicles available in owner-occupied houses - no vehicle available (%)
Vehicles available in owner-occupied houses - 1 vehicle available(%)
Vehicles available in owner-occupied houses - 2 Vehicles available (%)
Vehicles available in owner-occupied houses - 3 Vehicles available (%)
Vehicles available in owner-occupied houses - 4 Vehicles available (%)
Vehicles available in owner-occupied houses - 5+ Vehicles available (%)
Vehicles available in renter-occupied houses - no vehicle available (%)
Vehicles available in renter-occupied houses - 1 vehicle available (%)
Vehicles available in renter-occupied houses - 2 Vehicles available (%)
Vehicles available in renter-occupied houses - 3 Vehicles available (%)
Vehicles available in renter-occupied houses - 4 Vehicles available (%)
Vehicles available in renter-occupied houses - 5+ Vehicles available (%)
Housing units in structures - 1, detached (%)
Housing units in structures - 1, attached (%)
Housing units in structures - 2 (%)
Housing units in structures - 3 or 4 (%)
Housing units in structures - 5 to 9 (%)
Housing units in structures - 10 to 19 (%)
Housing units in structures - 20 to 49 (%)
Housing units in structures - 50 or more (%)
Housing units in structures - Mobile home (%)
Housing units in structures - Boat, RV, van, etc. (%)
Housing units in structures - Owners - 1, detached (%)
Housing units in structures - Owners - 1, attached (%)
Housing units in structures - Owners - 2 (%)
Housing units in structures - Owners - 3 or 4 (%)
Housing units in structures - Owners - 5 to 9 (%)
Housing units in structures - Owners - 10 to 19 (%)
Housing units in structures - Owners - 20 to 49 (%)
Housing units in structures - Owners - 50 or more (%)
Housing units in structures - Owners - Mobile home (%)
Housing units in structures - Owners - Boat, RV, van, etc. (%)
Housing units in structures - Renters - 1, detached (%)
Housing units in structures - Renters - 1, attached (%)
Housing units in structures - Renters - 2 (%)
Housing units in structures - Renters - 3 or 4 (%)
Housing units in structures - Renters - 5 to 9 (%)
Housing units in structures - Renters - 10 to 19 (%)
Housing units in structures - Renters - 20 to 49 (%)
Housing units in structures - Renters - 50 or more (%)
Housing units in structures - Renters - Mobile home (%)
Housing units in structures - Renters - Boat, RV, van, etc. (%)
House/condo owner moved in on average (years ago)
Renter moved in on average (years ago)
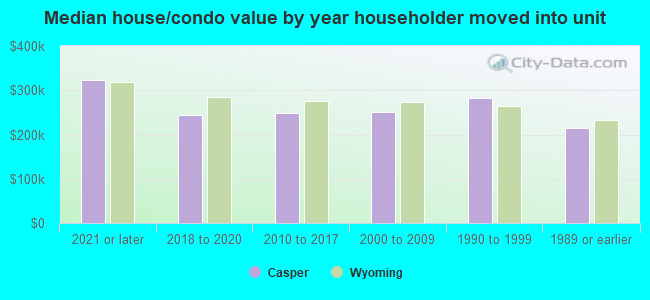
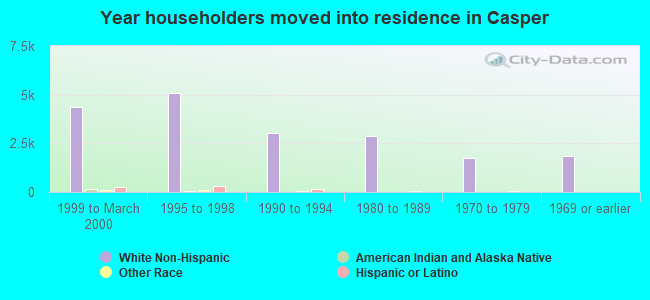
Year householder moved into unit - Moved in 1999 to March 2000 (%)
Year householder moved into unit - Moved in 1999 to March 2000 (%) - White
Year householder moved into unit - Moved in 1999 to March 2000 (%) - Black or African American
Year householder moved into unit - Moved in 1999 to March 2000 (%) - Asian
Year householder moved into unit - Moved in 1999 to March 2000 (%) - Hispanic or Latino
Year householder moved into unit - Moved in 1999 to March 2000 (%) - American Indian and Alaska Native
Year householder moved into unit - Moved in 1999 to March 2000 (%) - Multirace
Year householder moved into unit - Moved in 1999 to March 2000 (%) - Other Race
Year householder moved into unit - Moved in 1995 to 1998 (%)
Year householder moved into unit - Moved in 1995 to 1998 (%) - White
Year householder moved into unit - Moved in 1995 to 1998 (%) - Black or African American
Year householder moved into unit - Moved in 1995 to 1998 (%) - Asian
Year householder moved into unit - Moved in 1995 to 1998 (%) - Hispanic or Latino
Year householder moved into unit - Moved in 1995 to 1998 (%) - American Indian and Alaska Native
Year householder moved into unit - Moved in 1995 to 1998 (%) - Multirace
Year householder moved into unit - Moved in 1995 to 1998 (%) - Other Race
Year householder moved into unit - Moved in 1990 to 1994 (%)
Year householder moved into unit - Moved in 1990 to 1994 (%) - White
Year householder moved into unit - Moved in 1990 to 1994 (%) - Black or African American
Year householder moved into unit - Moved in 1990 to 1994 (%) - Asian
Year householder moved into unit - Moved in 1990 to 1994 (%) - Hispanic or Latino
Year householder moved into unit - Moved in 1990 to 1994 (%) - American Indian and Alaska Native
Year householder moved into unit - Moved in 1990 to 1994 (%) - Multirace
Year householder moved into unit - Moved in 1990 to 1994 (%) - Other Race
Year householder moved into unit - Moved in 1980 to 1989 (%)
Year householder moved into unit - Moved in 1980 to 1989 (%) - White
Year householder moved into unit - Moved in 1980 to 1989 (%) - Black or African American
Year householder moved into unit - Moved in 1980 to 1989 (%) - Asian
Year householder moved into unit - Moved in 1980 to 1989 (%) - Hispanic or Latino
Year householder moved into unit - Moved in 1980 to 1989 (%) - American Indian and Alaska Native
Year householder moved into unit - Moved in 1980 to 1989 (%) - Multirace
Year householder moved into unit - Moved in 1980 to 1989 (%) - Other Race
Year householder moved into unit - Moved in 1970 to 1979 (%)
Year householder moved into unit - Moved in 1970 to 1979 (%) - White
Year householder moved into unit - Moved in 1970 to 1979 (%) - Black or African American
Year householder moved into unit - Moved in 1970 to 1979 (%) - Asian
Year householder moved into unit - Moved in 1970 to 1979 (%) - Hispanic or Latino
Year householder moved into unit - Moved in 1970 to 1979 (%) - American Indian and Alaska Native
Year householder moved into unit - Moved in 1970 to 1979 (%) - Multirace
Year householder moved into unit - Moved in 1970 to 1979 (%) - Other Race
Year householder moved into unit - Moved in 1969 or earlier (%)
Year householder moved into unit - Moved in 1969 or earlier (%) - White
Year householder moved into unit - Moved in 1969 or earlier (%) - Black or African American
Year householder moved into unit - Moved in 1969 or earlier (%) - Asian
Year householder moved into unit - Moved in 1969 or earlier (%) - Hispanic or Latino
Year householder moved into unit - Moved in 1969 or earlier (%) - American Indian and Alaska Native
Year householder moved into unit - Moved in 1969 or earlier (%) - Multirace
Year householder moved into unit - Moved in 1969 or earlier (%) - Other Race
Housing units lacking complete plumbing facilities (%)
Housing units lacking complete kitchen facilities (%)
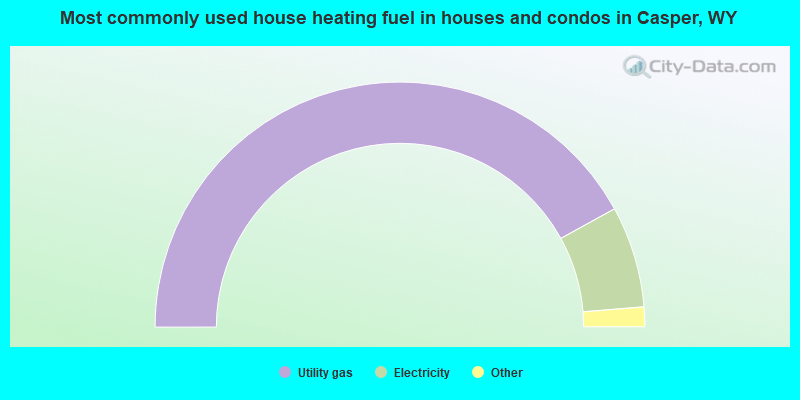
House heating fuel used in houses and condos - Utility gas (%)
House heating fuel used in houses and condos - Bottled, tank, or LP gas (%)
House heating fuel used in houses and condos - Electricity (%)
House heating fuel used in houses and condos - Fuel oil, kerosene, etc. (%)
House heating fuel used in houses and condos - Coal or coke (%)
House heating fuel used in houses and condos - Wood (%)
House heating fuel used in houses and condos - Solar energy (%)
House heating fuel used in houses and condos - Other fuel (%)
House heating fuel used in houses and condos - No fuel used (%)
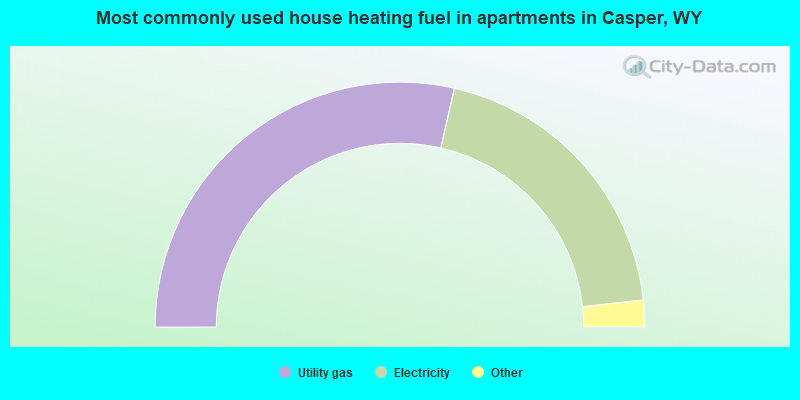
House heating fuel used in apartments - Utility gas (%)
House heating fuel used in apartments - Bottled, tank, or LP gas (%)
House heating fuel used in apartments - Electricity (%)
House heating fuel used in apartments - Fuel oil, kerosene, etc. (%)
House heating fuel used in apartments - Coal or coke (%)
House heating fuel used in apartments - Wood (%)
House heating fuel used in apartments - Solar energy (%)
House heating fuel used in apartments - Other fuel (%)
House heating fuel used in apartments - No fuel used (%)
Latest news about housing in Casper, WY collected exclusively by city-data.com from local newspapers, TV, and radio stations
Median year house/condo built: 1973Median year apartment built: 1977Household type by relationship:
Households: 58,701
Male householders: 12,279 (4,021 living alone ), Female householders: 12,846 (4,507 living alone )10,736 spouses (10,584 opposite-sex spouses ), 1,923 unmarried partners , (1,884 opposite-sex unmarried partners ), 16,585 children (15,435 natural , 490 adopted , 659 stepchildren ), 813 grandchildren , 460 brothers or sisters , 435 parents , 0 foster children , 368 other relatives , 1,161 non-relatives In group quarters: 1,089
Size of family households: 7,518 2-persons , 4,202 3-persons , 2,377 4-persons , 1,235 5-persons , 244 6-persons , 137 7-or-more-persons .
Size of nonfamily households: 8,265 1-person , 1,364 2-persons , 98 3-persons , 48 4-persons , 10 5-persons .
9,387 married couples with children. single-parent households (1,739 men , 2,250 women ).
94.8% of residents of Casper speak English at home. of residents speak Spanish at home (71% speak English very well , 16% speak English well , 6% speak English not well , 7% don't speak English at all ).of residents speak other Indo-European language at home (92% speak English very well , 8% speak English well ).of residents speak Asian or Pacific Island language at home (89% speak English very well , 7% speak English well , 4% speak English not well ).of residents speak other language at home (100% speak English very well ).
Foreign born population: 1,196 (2.0%)of them are naturalized citizens )
Median number of rooms in houses and condos:
Median number of rooms in apartments
Owner-occupied Renter-occupied
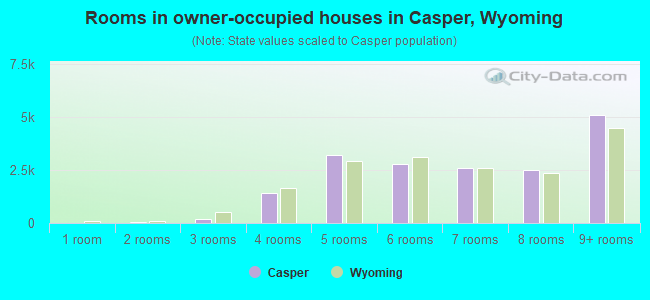
Rooms in owner-occupied houses in Casper, Wyoming
0 1 room 24 2 rooms 169 3 rooms 1,400 4 rooms 3,216 5 rooms 2,793 6 rooms 2,611 7 rooms 2,476 8 rooms 5,091 9+ rooms
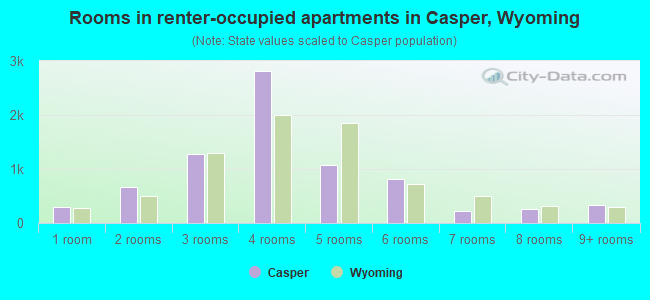
Rooms in renter-occupied apartments in Casper, Wyoming
305 1 room 668 2 rooms 1,270 3 rooms 2,815 4 rooms 1,083 5 rooms 808 6 rooms 219 7 rooms 252 8 rooms 338 9+ rooms
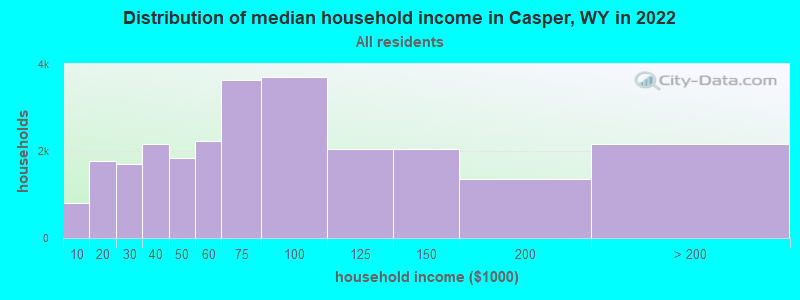
Casper, WY household income distribution 815 Less than $10,0001,776 $10,000 to $19,9991,693 $20,000 to $29,9992,160 $30,000 to $39,9991,840 $40,000 to $49,9992,223 $50,000 to $59,9993,640 $60,000 to $74,9993,692 $75,000 to $99,9992,056 $100,000 to $124,9992,046 $125,000 to $149,9991,366 $150,000 to $199,9992,156 $200,000 or more
Home value of owner - occupied houses in 2022 in Casper, WY 64 Less than $10,00046 $10,000 to $14,999110 $15,000 to $19,999233 $20,000 to $24,999129 $25,000 to $29,99932 $30,000 to $34,99933 $35,000 to $39,99977 $40,000 to $49,99957 $50,000 to $59,9998 $60,000 to $69,999115 $70,000 to $79,99931 $80,000 to $89,99924 $90,000 to $99,999582 $100,000 to $124,9991,151 $125,000 to $149,9991,173 $150,000 to $174,9991,523 $175,000 to $199,9993,563 $200,000 to $249,9992,400 $250,000 to $299,9993,098 $300,000 to $399,9991,293 $400,000 to $499,9992,034 $500,000 to $749,99963 $750,000 to $999,999141 $1,000,000 to $1,499,99917 $1,500,000 to $1,999,999111 $2,000,000 or moreRent paid by renters in 2022 in Casper, WY 26 Less than $10084 $100 to $14966 $150 to $1999 $200 to $24940 $250 to $29936 $300 to $34935 $350 to $399358 $400 to $449136 $450 to $499205 $500 to $549257 $550 to $599593 $600 to $649521 $650 to $699551 $700 to $749563 $750 to $7991,008 $800 to $899646 $900 to $9991,328 $1,000 to $1,249679 $1,250 to $1,499126 $1,500 to $1,99910 $2,000 to $2,49916 $2,500 to $2,99957 $3,500 or more327 No cash rent
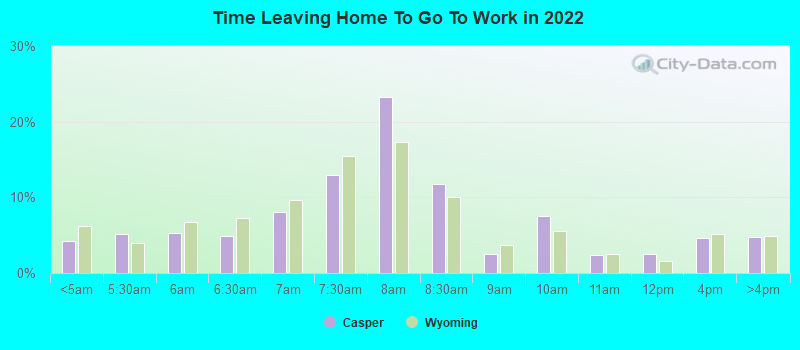
Percentage of workers working in this county: 97.6%Number of people working at home: 2,859 (9.4% of all workers )
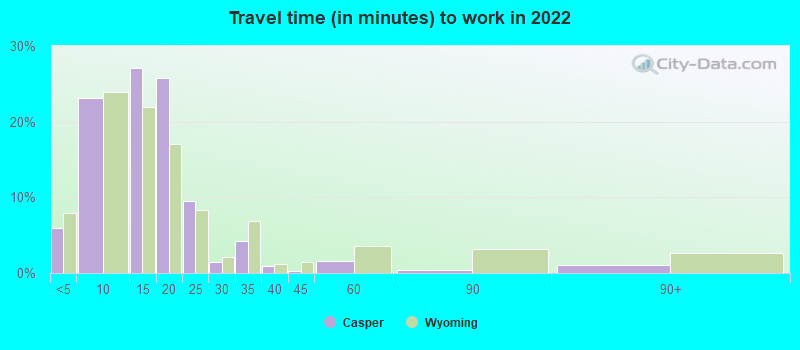
Travel time to work (commute)
Less than 5 minutes: 1,8245 to 9 minutes: 5,66910 to 14 minutes: 7,38915 to 19 minutes: 7,11820 to 24 minutes: 2,46825 to 29 minutes: 32030 to 34 minutes: 84435 to 39 minutes: 16840 to 44 minutes: 4945 to 59 minutes: 20360 to 89 minutes: 18890 or more minutes: 644
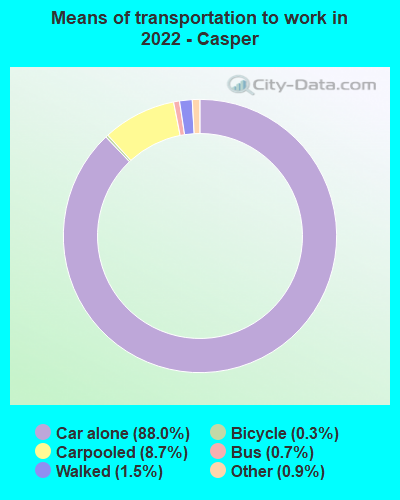
Means of transportation to work:
Drove a car alone: 24,050 (80.5%)Carpooled: 2,021 (6.8%)Bus : 190 (0.6%)Taxi: 325 (1.1%)Bicycle: 101 (0.3%)Walked: 400 (1.3%)Worked at home: 2,859 (9.6%)
Unemployment by race in 2022
Unemployment rate for White non-Hispanic residents 6.4% Males3.2% FemalesUnemployment rate for Black residents 27.6% FemalesUnemployment rate for two or more race residents 5.4% MalesUnemployment rate for Hispanic or Latino residents 2.7% Males0.3% Females
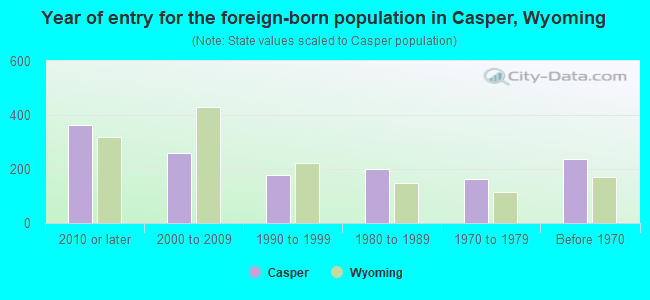
Year of entry for the foreign-born population in Casper, Wyoming
362 2010 or later 259 2000 to 2009 177 1990 to 1999 201 1980 to 1989 164 1970 to 1979 238 Before 1970
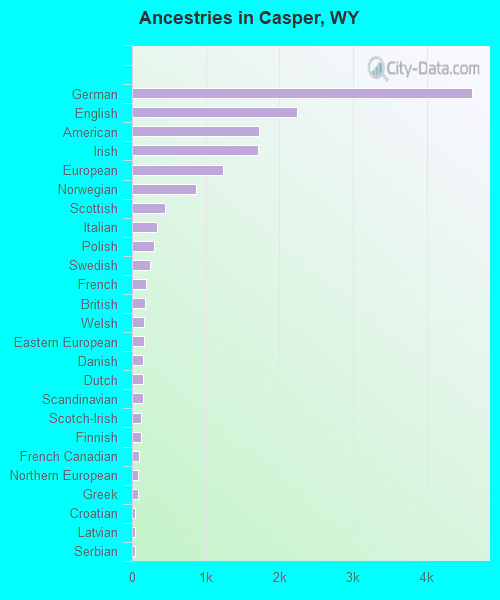
First ancestries reported:
German: 4,616 (17.7%)
English: 2,239 (8.6%)
American: 1,729 (6.6%)
Irish: 1,713 (6.6%)
European: 1,238 (4.7%)
Norwegian: 867 (3.3%)
Scottish: 447 (1.7%)
Italian: 337 (1.3%)
Polish: 302 (1.2%)
Swedish: 251 (1.0%)
French: 188 (0.7%)
British: 174 (0.7%)
Welsh: 165 (0.6%)
Eastern European: 159 (0.6%)
Danish: 154 (0.6%)
Dutch: 154 (0.6%)
Scandinavian: 147 (0.6%)
Scotch-Irish: 127 (0.5%)
Finnish: 123 (0.5%)
French Canadian: 96 (0.4%)
Northern European: 84 (0.3%)
Greek: 76 (0.3%)
Croatian: 43 (0.2%)
Latvian: 43 (0.2%)
Serbian: 42 (0.2%)
Arab: 38 (0.1%)
Russian: 38 (0.1%)
Belgian: 29 (0.1%)
Czechoslovakian: 26 (0.10%)
Canadian: 21 (0.08%)
Czech: 21 (0.08%)
Austrian: 13 (0.05%)
Icelander: 11 (0.04%)
Slovak: 9 (0.03%)
Pennsylvania German: 7 (0.03%) Most common places of birth for foreign-born residents (%): Mexico Casper:
39.8% (484)Wyoming:
42.9% (8,470)
Canada Casper:
10.6% (129)Wyoming:
5.8% (1,139)
Sri Lanka Casper:
6.7% (82)Wyoming:
0.5% (89)
Russia Casper:
5.3% (65)Wyoming:
1.9% (378)
Germany Casper:
5.2% (63)Wyoming:
3.5% (696)
Greece Casper:
3.3% (40)Wyoming:
0.2% (42)
Philippines Casper:
3.3% (40)Wyoming:
3.6% (712)
France Casper:
3.1% (38)Wyoming:
0.7% (132)
China, excluding Hong Kong and Taiwan Casper:
2.8% (34)Wyoming:
4.3% (844)
Costa Rica Casper:
2.6% (32)Wyoming:
0.2% (32)
England Casper:
2.3% (28)Wyoming:
2.6% (514)
Croatia Casper:
2.1% (25)Wyoming:
0.2% (35)
Japan Casper:
2.0% (24)Wyoming:
0.8% (166)
Place of birth for U.S.-born residents:
This state: 28,981Other state: 28,254Northeast: 2,338Midwest: 8,177South: 4,667West: 13,031 83.9% of Casper residents lived in the same house 1 years ago.
Out of people who lived in different houses, 40.3% lived in this county.
Out of people who lived in different counties, 28.1% lived in Wyoming.
Casper:
83.9%State average:
84.7%
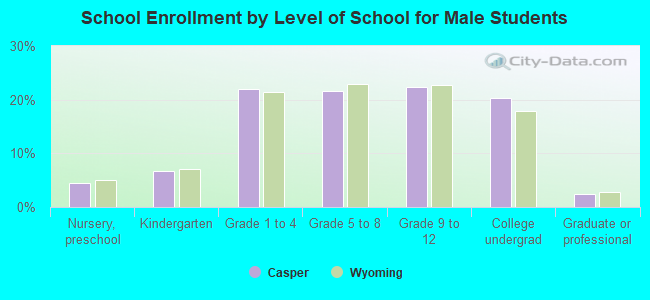
Education attainment for males 25 years and older:
No schooling: 66Nursery to 4th grade: 905th and 6th grade: 187th and 8th grade: 1089th grade: 2810th grade: 5211th grade: 19112th grade, no diploma: 665High school graduate (or equivalency): 4,523Less than 1 year of college: 1,198Some college more than 1 year, no degree: 3,401Associate degree: 2,517Bachelor's degree: 3,834Master's degree: 1,866Professional school degree: 747Doctorate degree: 302
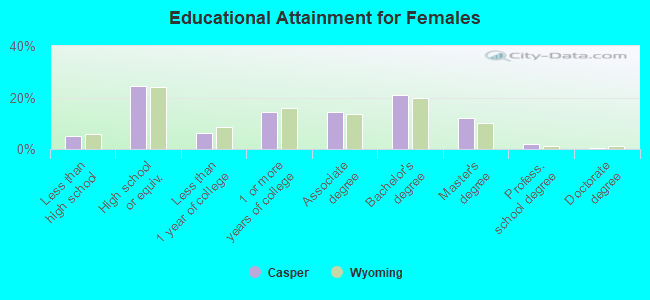
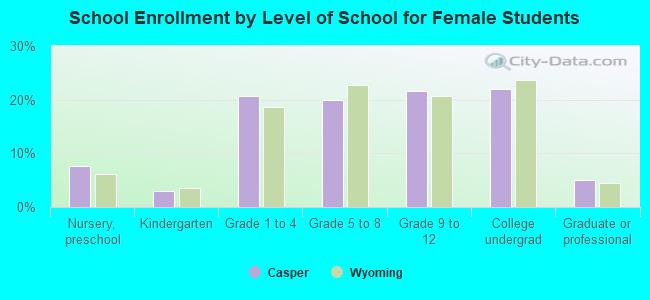
Education attainment for females 25 years and older:
No schooling: 172Nursery to 4th grade: 55th and 6th grade: 07th and 8th grade: 1079th grade: 35110th grade: 8411th grade: 17512th grade, no diploma: 187High school graduate (or equivalency): 5,102Less than 1 year of college: 1,252Some college more than 1 year, no degree: 2,952Associate degree: 2,974Bachelor's degree: 4,359Master's degree: 2,479Professional school degree: 440Doctorate degree: 111
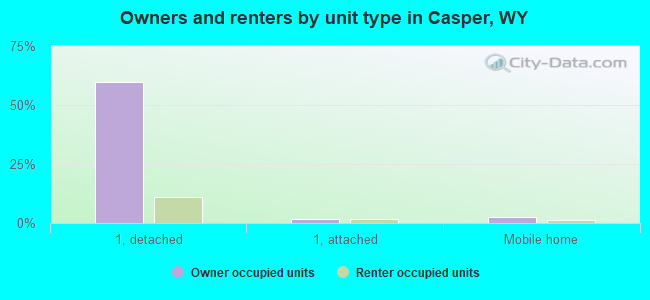
Housing units in structures:
One, detached: 19,692One, attached: 1,057Two: 3443 or 4: 9425 to 9: 1,05610 to 19: 1,27820 to 49: 1,90050 or more: 751Mobile homes: 1,051Boats, RVs, vans, etc.: 11Median worth of mobile homes: $64,334
Housing units lacking complete plumbing facilities in 2022: 1.6%Housing units lacking complete kitchen facilities in 2022: 2.4%House/condo owner moved in on average 11 years ago
Renter moved in on average 1 years ago
Private vs. public school enrollment:
Students in private schools in grades 1 to 8 (elementary and middle school): 390 Students in private schools in grades 9 to 12 (high school): 166 Students in private undergraduate colleges: 313