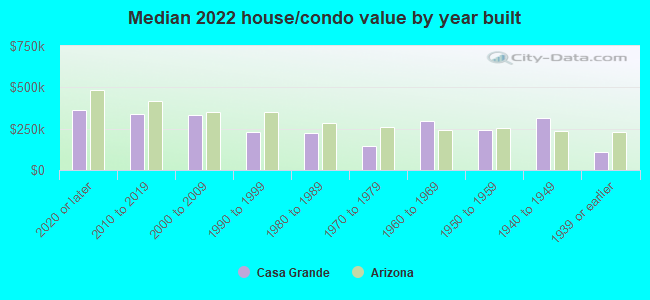
Casa Grande, AZ (Arizona) Houses and Residents
| Casa Grande: | $297,098 |
| Arizona: | $402,800 |
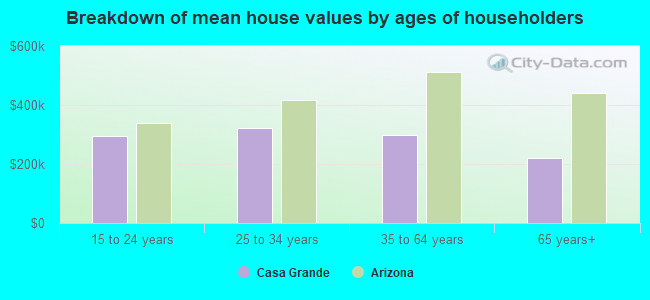
Mean price in 2022:
Detached houses: $256,627
Here: $256,627 State: $521,408 Townhouses or other attached units: $286,142
Here: $286,142 State: $387,465 Mobile homes: $65,206
Here: $65,206 State: $141,516 Occupied boats, RVs, vans, etc.: $51,498
Here: $51,498 State: $60,504
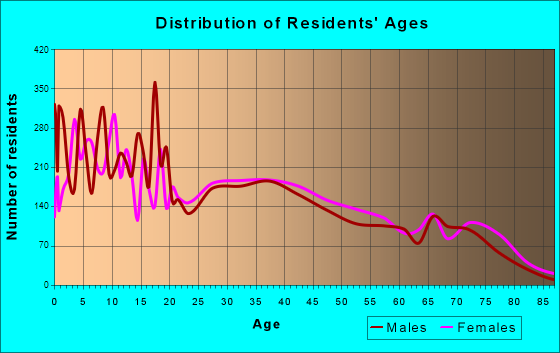
Total population: 51,478 (Urban population: 24,917 (all inside urban clusters), Rural population: 404 (all nonfarm))
Houses: 24,717 (21,191 occupied: 15,156 owner occupied, 6,561 renter occupied)
| % of renters here: | 30% |
| State: | 33% |
Housing density: 513 houses/condos per square mile
Median price asked for vacant for-sale houses and condos in 2022: $242,898.
Median contract rent in 2022: $1,297 (lower quartile is $911, upper quartile is $1,546)
Median rent asked for vacant for-rent units in 2022: $742
Median gross rent in Casa Grande, AZ in 2022: $1,471
Housing units in Casa Grande with a mortgage: 8,751 (363 second mortgage, 38 home equity loan, 265 both second mortgage and home equity loan)
Houses without a mortgage: 47
Median household income for houses/condos with a mortgage: $81,436
Median household income for apartments without a mortgage: $65,635
Median monthly housing costs: $1,132
Compare current foreclosures in Casa Grande, AZ:
| Photo | Address | Area | Beds / Baths | Price | Details |
|---|---|---|---|---|---|

|
#1
N Terrace Cir
Casa Grande, AZ 85122
|
1,076 sq. feet
|
2 baths 2 beds |
show details | |

|
#2
N French Pl
Casa Grande, AZ 85122
|
2,302 sq. feet
|
3 baths 4 beds |
show details | |

|
#3
N Sandalwood Dr
Casa Grande, AZ 85122
|
1,000 sq. feet
|
2 baths 2 beds |
show details | |

|
#4
E Christina St
Casa Grande, AZ 85122
|
1,212 sq. feet
|
2 baths 3 beds |
show details | |

|
#5
E Seven Seas Dr
Casa Grande, AZ 85122
|
- sq. feet
|
2 baths 4 beds |
show details | |

|
#6
E Desert Breeze Dr
Casa Grande, AZ 85122
|
2,334 sq. feet
|
2 baths 4 beds |
show details | |

|
#7
W Camino Grande
Casa Grande, AZ 85122
|
1,101 sq. feet
|
2 baths 3 beds |
show details | |

|
#8
W Desert Sky Dr
Casa Grande, AZ 85122
|
1,665 sq. feet
|
2 baths 2 beds |
show details | |

|
#9
N Gilbert Ave
Casa Grande, AZ 85122
|
1,144 sq. feet
|
2 baths 3 beds |
show details | |

|
#10
W Blackhawk Rd
Casa Grande, AZ 85194
|
2,769 sq. feet
|
4 baths 4 beds |
show details |
| Photo | Address | Area | Beds / Baths | Price | Details |
|---|---|---|---|---|---|

|
#11
E Natasha Dr
Casa Grande, AZ 85122
|
2,594 sq. feet
|
2 baths 3 beds |
show details | |

|
#12
W Sand Canyon Dr
Casa Grande, AZ 85122
|
2,397 sq. feet
|
2 baths 3 beds |
show details | |

|
#13
N Malachite Way
Casa Grande, AZ 85122
|
1,430 sq. feet
|
2 baths 3 beds |
show details | |

|
#14
W Ramos Dr
Casa Grande, AZ 85122
|
1,101 sq. feet
|
2 baths 3 beds |
show details | |

|
#15
E Randolph Rd
Casa Grande, AZ 85194
|
1,120 sq. feet
|
2 baths 2 beds |
show details | |

|
#16
E Elegante Dr
Casa Grande, AZ 85122
|
1,735 sq. feet
|
2 baths 4 beds |
show details | |

|
#17
S Mission Abo Ln
Casa Grande, AZ 85194
|
2,162 sq. feet
|
2 baths 4 beds |
show details | |

|
#18
E 11th St
Casa Grande, AZ 85122
|
2,509 sq. feet
|
3 baths 4 beds |
show details | |

|
#19
E Linda Dr
Casa Grande, AZ 85122
|
1,600 sq. feet
|
2 baths 3 beds |
show details | |

|
#20
E Pepper Dr
Casa Grande, AZ 85122
|
1,281 sq. feet
|
2 baths 3 beds |
show details |
| Photo | Address | Area | Beds / Baths | Price | Details |
|---|---|---|---|---|---|

|
#21
E Julius St
Casa Grande, AZ 85122
|
1,263 sq. feet
|
2 baths 3 beds |
show details | |

|
#22
W Sweet Acacia Dr
Casa Grande, AZ 85194
|
2,787 sq. feet
|
- baths - beds |
show details | |

|
#23
S Whispering Sands Dr
Casa Grande, AZ 85193
|
2,128 sq. feet
|
- baths - beds |
show details | |

|
#24
S San Vicente Ln
Casa Grande, AZ 85194
|
- sq. feet
|
- baths - beds |
show details | |

|
#25
W Delmonte Dr
Casa Grande, AZ 85122
|
- sq. feet
|
- baths - beds |
show details | |

|
#26
W Noble Cir
Casa Grande, AZ 85122
|
1,444 sq. feet
|
- baths - beds |
show details | |

|
#27
E Stonewood Dr
Casa Grande, AZ 85122
|
1,540 sq. feet
|
- baths - beds |
show details | |

|
#28
E Katrina Trl
Casa Grande, AZ 85194
|
2,162 sq. feet
|
- baths - beds |
show details | |

|
#29
E Santo Domingo Dr
Casa Grande, AZ 85194
|
- sq. feet
|
- baths - beds |
show details | |

|
#30
N Desert Willow St
Casa Grande, AZ 85122
|
2,632 sq. feet
|
- baths - beds |
show details |
| Photo | Address | Area | Beds / Baths | Price | Details |
|---|---|---|---|---|---|

|
#31
W Calgary Dr
Casa Grande, AZ 85122
|
- sq. feet
|
- baths - beds |
show details | |

|
#32
S Peart Rd Apt A
Casa Grande, AZ 85122
|
- sq. feet
|
- baths - beds |
show details | |

|
#33
N Sabino Ln
Casa Grande, AZ 85122
|
2,511 sq. feet
|
- baths - beds |
show details | |

|
#34
W Mcmurray Blvd Lot 37
Casa Grande, AZ 85122
|
- sq. feet
|
- baths - beds |
show details | |

|
#35
N Saint Francis Pl
Casa Grande, AZ 85122
|
2,720 sq. feet
|
- baths - beds |
show details | |

|
#36
S San Marino Loop
Casa Grande, AZ 85194
|
1,802 sq. feet
|
- baths - beds |
show details | |

|
#37
E Crestridge Dr
Casa Grande, AZ 85122
|
- sq. feet
|
- baths - beds |
show details | |

|
#38
E Cortez Dr
Casa Grande, AZ 85122
|
- sq. feet
|
- baths - beds |
show details | |

|
#39
N St Bonita Ln
Casa Grande, AZ 85122
|
- sq. feet
|
- baths - beds |
show details | |

|
#40
E Palo Verde Dr
Casa Grande, AZ 85122
|
1,645 sq. feet
|
- baths - beds |
show details |
| Photo | Address | Area | Beds / Baths | Price | Details |
|---|---|---|---|---|---|

|
#41
N Irene Ct
Casa Grande, AZ 85122
|
2,353 sq. feet
|
- baths - beds |
show details | |

|
#42
E Entoro Dr
Casa Grande, AZ 85122
|
- sq. feet
|
- baths - beds |
show details | |

|
#43
E Cottonwood Ln Apt 1066
Casa Grande, AZ 85122
|
- sq. feet
|
- baths - beds |
show details | |

|
#44
E Alvaro Trl
Casa Grande, AZ 85194
|
- sq. feet
|
- baths - beds |
show details | |

|
#45
N Pottebaum Rd Apt 622
Casa Grande, AZ 85122
|
- sq. feet
|
- baths - beds |
show details | |

|
#46
E 11th St
Casa Grande, AZ 85122
|
1,603 sq. feet
|
- baths - beds |
show details | |

|
#47
E Settlers Trl
Casa Grande, AZ 85122
|
2,257 sq. feet
|
- baths - beds |
show details | |

|
#48
W Hanna Rd
Casa Grande, AZ 85193
|
- sq. feet
|
- baths - beds |
show details | |

|
#49
E Elegante Dr
Casa Grande, AZ 85122
|
- sq. feet
|
- baths - beds |
show details | |

|
Check over 1 million property listings on Foreclosure.com!
|
browse all offers | |||


 | Are new homes really built that bad (40 replies) |
| Custom home builders Casa Grande (1 reply) |
| Decent apartments w/o bed bugs? (18 replies) |
| Casa Grande (16 replies) |
| Looking for House to Rent Jan-Mar 2019 with little dog (2 replies) |
| where to find homes to rent CASA GRANDE? (2 replies) |
Median year apartment built: 1997
Household type by relationship:
Households: 59,110- Male householders: 11,279 (2,312 living alone), Female householders: 10,171 (2,471 living alone)
10,759 spouses (10,705 opposite-sex spouses), 2,246 unmarried partners, (2,172 opposite-sex unmarried partners), 17,945 children (15,826 natural, 641 adopted, 1,477 stepchildren), 1,435 grandchildren, 680 brothers or sisters, 1,169 parents, 5 foster children, 984 other relatives, 2,096 non-relatives
- In group quarters: 337
Size of family households: 6,467 2-persons, 3,000 3-persons, 2,131 4-persons, 2,207 5-persons, 922 6-persons, 309 7-or-more-persons.
Size of nonfamily households: 5,184 1-person, 1,087 2-persons, 266 3-persons, 75 4-persons, 93 6-persons.
7,964 married couples with children.
4,376 single-parent households (1,385 men, 2,991 women).
75.2% of residents of Casa Grande speak English at home.
22.0% of residents speak Spanish at home (71% speak English very well, 12% speak English well, 11% speak English not well, 5% don't speak English at all).
0.9% of residents speak other Indo-European language at home (40% speak English very well, 60% speak English well).
1.5% of residents speak Asian or Pacific Island language at home (72% speak English very well, 23% speak English well, 5% speak English not well).
0.4% of residents speak other language at home (79% speak English very well, 11% speak English well, 10% speak English not well).
Foreign born population: 7,470 (12.6%)
(39.3% of them are naturalized citizens)
| Here: | 5.9 |
| State: | 6.0 |
| Here: | 4.4 |
| State: | 4.1 |
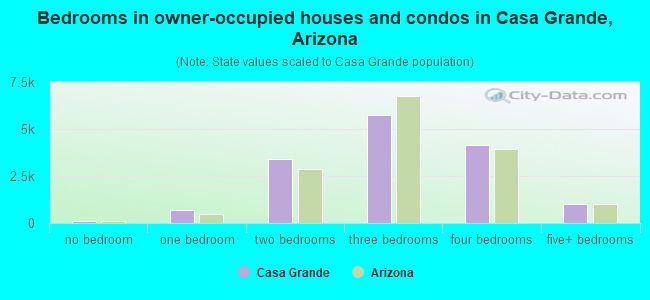
- Bedrooms in owner-occupied houses and condos in Casa Grande, Arizona
- 127no bedroom
- 6851 bedroom
- 3,4192 bedrooms
- 5,7623 bedrooms
- 4,1604 bedrooms
- 1,0035+ bedrooms
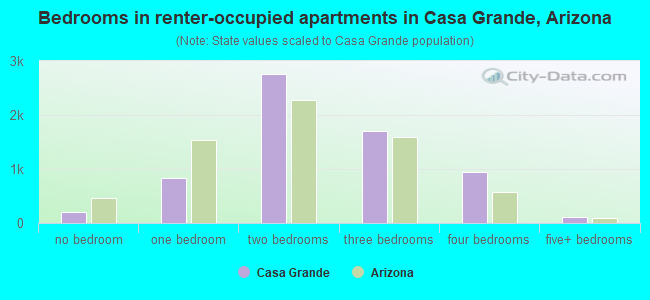
- Bedrooms in renter-occupied apartments in Casa Grande, Arizona
- 210no bedroom
- 8341 bedroom
- 2,7652 bedrooms
- 1,6973 bedrooms
- 9384 bedrooms
- 1175+ bedrooms
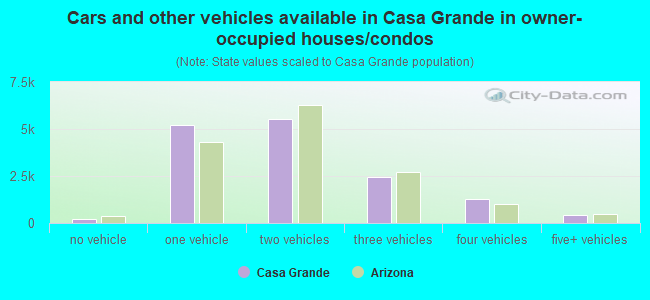
- Cars and other vehicles available in Casa Grande in owner-occupied houses/condos
- 239no vehicle
- 5,2131 vehicle
- 5,5372 vehicles
- 2,4533 vehicles
- 1,2754 vehicles
- 4395+ vehicles
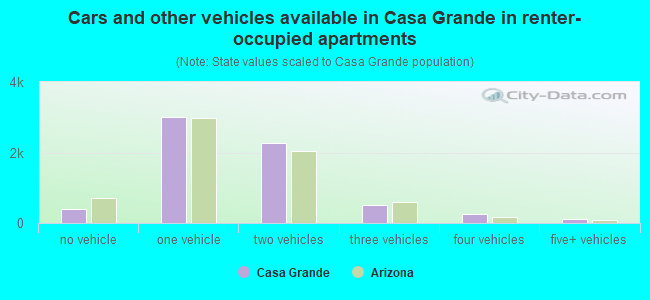
- Cars and other vehicles available in Casa Grande in renter-occupied apartments
- 400no vehicle
- 3,0181 vehicle
- 2,2622 vehicles
- 5103 vehicles
- 2594 vehicles
- 1135+ vehicles
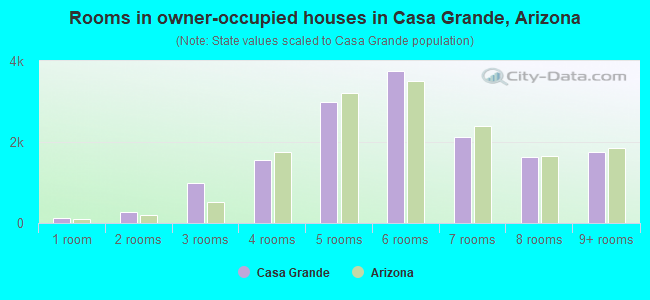
- Rooms in owner-occupied houses in Casa Grande, Arizona
- 1171 room
- 2742 rooms
- 9843 rooms
- 1,5664 rooms
- 2,9765 rooms
- 3,7606 rooms
- 2,1147 rooms
- 1,6198 rooms
- 1,7479+ rooms
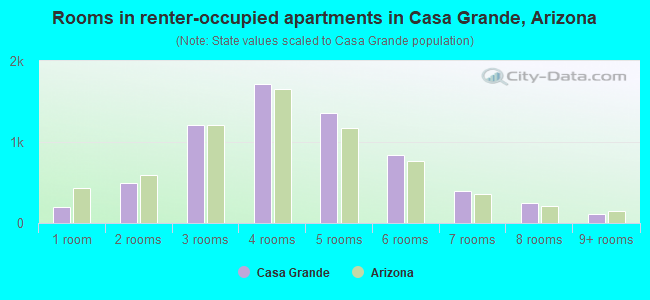
- Rooms in renter-occupied apartments in Casa Grande, Arizona
- 2021 room
- 4912 rooms
- 1,2133 rooms
- 1,7104 rooms
- 1,3635 rooms
- 8376 rooms
- 3937 rooms
- 2478 rooms
- 1059+ rooms
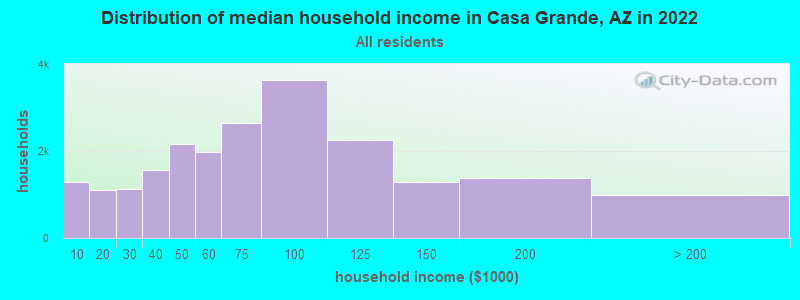
Casa Grande, AZ household income distribution

- 1,296Less than $10,000
- 1,111$10,000 to $19,999
- 1,121$20,000 to $29,999
- 1,560$30,000 to $39,999
- 2,152$40,000 to $49,999
- 1,985$50,000 to $59,999
- 2,646$60,000 to $74,999
- 3,628$75,000 to $99,999
- 2,259$100,000 to $124,999
- 1,291$125,000 to $149,999
- 1,370$150,000 to $199,999
- 989$200,000 or more
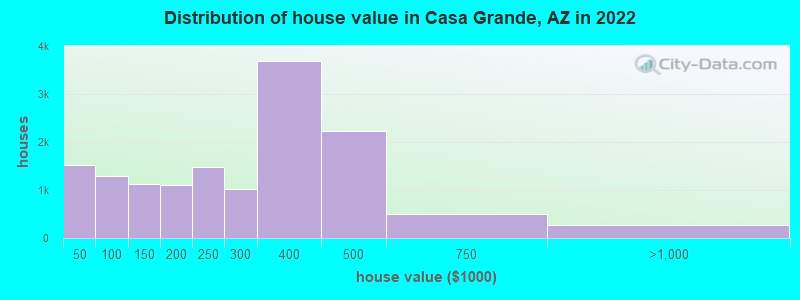
Home value of owner - occupied houses in 2022 in Casa Grande, AZ
-
- 272Less than $10,000
- 115$10,000 to $14,999
- 42$15,000 to $19,999
- 102$20,000 to $24,999
- 169$25,000 to $29,999
- 396$30,000 to $34,999
- 144$35,000 to $39,999
- 270$40,000 to $49,999
- 355$50,000 to $59,999
- 112$60,000 to $69,999
- 128$70,000 to $79,999
- 320$80,000 to $89,999
- 100$90,000 to $99,999
- 681$100,000 to $124,999
- 435$125,000 to $149,999
- 629$150,000 to $174,999
- 469$175,000 to $199,999
- 1,468$200,000 to $249,999
- 1,024$250,000 to $299,999
- 3,681$300,000 to $399,999
- 2,221$400,000 to $499,999
- 491$500,000 to $749,999
- 231$750,000 to $999,999
- 8$1,000,000 to $1,499,999
- 27$1,500,000 to $1,999,999
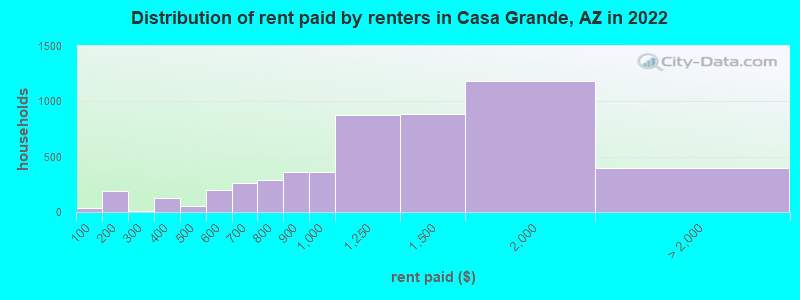
Rent paid by renters in 2022 in Casa Grande, AZ
-
- 32Less than $100
- 15$100 to $149
- 171$150 to $199
- 6$200 to $249
- 6$250 to $299
- 68$300 to $349
- 56$350 to $399
- 37$400 to $449
- 19$450 to $499
- 114$500 to $549
- 82$550 to $599
- 200$600 to $649
- 60$650 to $699
- 130$700 to $749
- 163$750 to $799
- 362$800 to $899
- 360$900 to $999
- 875$1,000 to $1,249
- 883$1,250 to $1,499
- 1,185$1,500 to $1,999
- 191$2,000 to $2,499
- 12$2,500 to $2,999
- 15$3,000 to $3,499
- 180No cash rent
Percentage of workers working in this county: 84.2%
Number of people working at home: 2,434 (9.3% of all workers)
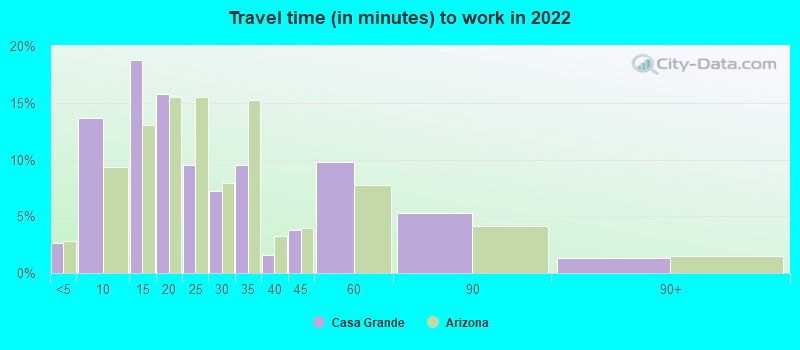
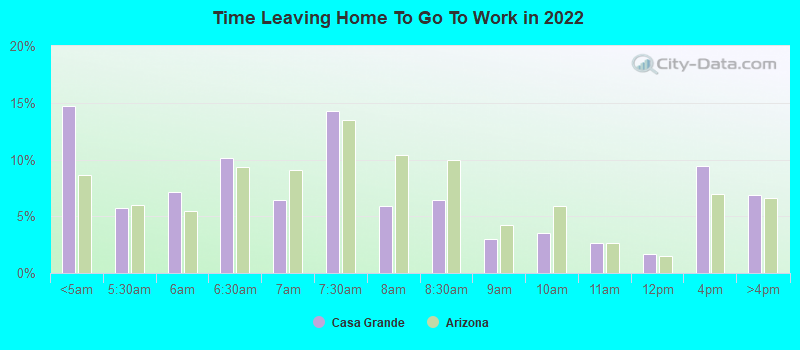
Travel time to work (commute)
- Less than 5 minutes: 701
- 5 to 9 minutes: 3,231
- 10 to 14 minutes: 5,020
- 15 to 19 minutes: 3,514
- 20 to 24 minutes: 2,071
- 25 to 29 minutes: 1,386
- 30 to 34 minutes: 1,846
- 35 to 39 minutes: 602
- 40 to 44 minutes: 662
- 45 to 59 minutes: 1,763
- 60 to 89 minutes: 1,747
- 90 or more minutes: 167
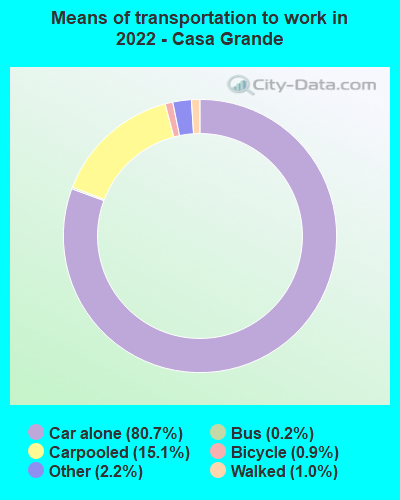
Means of transportation to work:
- Drove a car alone: 19,286 (71.0%)
- Carpooled: 3,797 (14.0%)
- Bus: 33 (0.1%)
- Taxi: 595 (2.2%)
- Bicycle: 176 (0.6%)
- Walked: 252 (0.9%)
- Worked at home: 2,260 (8.3%)
- Unemployment by race in 2022
- Unemployment rate for White non-Hispanic residents
- 4.0%Males
- 5.7%Females
- Unemployment rate for Black residents
- 1.7%Females
- Unemployment rate for American Indian and Alaska Native residents
- 1.9%Males
- 13.9%Females
- Unemployment rate for Asian residents
- 6.3%Males
- Unemployment rate for other race residents
- 14.6%Males
- 15.8%Females
- Unemployment rate for two or more race residents
- 7.5%Males
- Unemployment rate for Hispanic or Latino residents
- 7.1%Males
- 7.7%Females
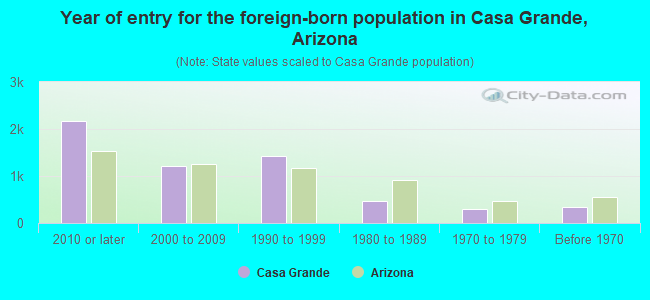
- Year of entry for the foreign-born population in Casa Grande, Arizona
- 2,1602010 or later
- 1,2092000 to 2009
- 1,4161990 to 1999
- 4701980 to 1989
- 3021970 to 1979
- 336Before 1970
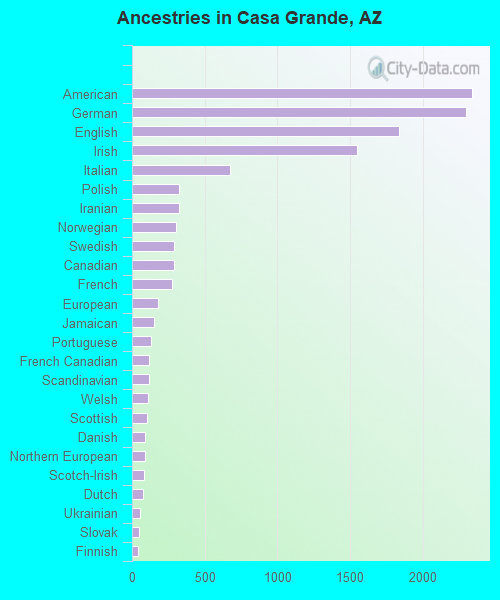
First ancestries reported:
- American: 2,340 (7.1%)
- German: 2,298 (7.0%)
- English: 1,840 (5.6%)
- Irish: 1,546 (4.7%)
- Italian: 676 (2.1%)
- Polish: 324 (1.0%)
- Iranian: 323 (1.0%)
- Norwegian: 305 (0.9%)
- Swedish: 289 (0.9%)
- Canadian: 289 (0.9%)
- French: 273 (0.8%)
- European: 182 (0.6%)
- Jamaican: 148 (0.4%)
- Portuguese: 129 (0.4%)
- French Canadian: 119 (0.4%)
- Scandinavian: 114 (0.3%)
- Welsh: 109 (0.3%)
- Scottish: 101 (0.3%)
- Danish: 92 (0.3%)
- Northern European: 89 (0.3%)
- Scotch-Irish: 81 (0.2%)
- Dutch: 76 (0.2%)
- Ukrainian: 53 (0.2%)
- Slovak: 49 (0.1%)
- Finnish: 41 (0.1%)
- Czech: 28 (0.08%)
- Hungarian: 24 (0.07%)
- British: 24 (0.07%)
- Belizean: 24 (0.07%)
- Russian: 22 (0.07%)
- Greek: 21 (0.06%)
- African: 21 (0.06%)
- Cape Verdean: 16 (0.05%)
- Albanian: 14 (0.04%)
- Israeli: 13 (0.04%)
- Romanian: 13 (0.04%)
- Eastern European: 13 (0.04%)
- Lithuanian: 12 (0.04%)
- Austrian: 10 (0.03%)
- Swiss: 8 (0.02%)
- Syrian: 8 (0.02%)
- Basque: 6 (0.02%)
- Luxembourger: 5 (0.02%)
- Czechoslovakian: 5 (0.02%)
- Yugoslavian: 5 (0.02%)
- Trinidadian and Tobagonian: 4 (0.01%)
Most common places of birth for foreign-born residents (%):
| Casa Grande: | 59.5% (3,906) |
| Arizona: | 53.4% (500,086) |
| Casa Grande: | 7.6% (501) |
| Arizona: | 3.2% (30,378) |
| Casa Grande: | 6.3% (416) |
| Arizona: | 4.3% (40,102) |
| Casa Grande: | 4.3% (284) |
| Arizona: | 0.6% (5,893) |
| Casa Grande: | 3.4% (221) |
| Arizona: | 0.3% (2,710) |
| Casa Grande: | 2.6% (169) |
| Arizona: | 1.2% (10,932) |
| Casa Grande: | 2.3% (154) |
| Arizona: | 0.4% (3,526) |
| Casa Grande: | 2.2% (144) |
| Arizona: | 2.1% (19,199) |
| Casa Grande: | 2.0% (133) |
| Arizona: | 1.5% (14,058) |
| Casa Grande: | 1.9% (124) |
| Arizona: | 4.5% (41,719) |
Place of birth for U.S.-born residents:
- This state: 25,221
- Other state: 25,607
- Northeast: 3,051
- Midwest: 8,666
- South: 3,564
- West: 10,291
81.4% of Casa Grande residents lived in the same house 1 years ago.
Out of people who lived in different houses, 37.0% lived in this county.
Out of people who lived in different counties, 55.0% lived in Arizona.
| Casa Grande: | 81.4% |
| State average: | 86.0% |
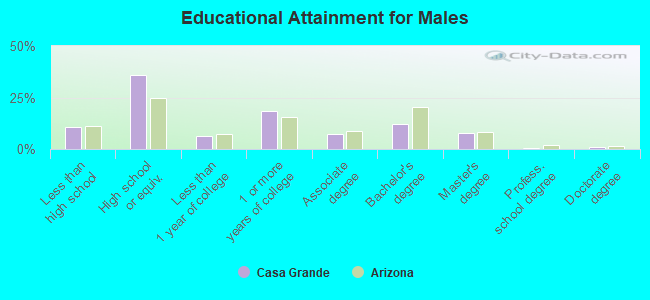
Education attainment for males 25 years and older:
- No schooling: 455
- Nursery to 4th grade: 35
- 5th and 6th grade: 194
- 7th and 8th grade: 169
- 9th grade: 84
- 10th grade: 143
- 11th grade: 226
- 12th grade, no diploma: 645
- High school graduate (or equivalency): 6,670
- Less than 1 year of college: 1,213
- Some college more than 1 year, no degree: 3,465
- Associate degree: 1,335
- Bachelor's degree: 2,232
- Master's degree: 1,480
- Professional school degree: 121
- Doctorate degree: 167
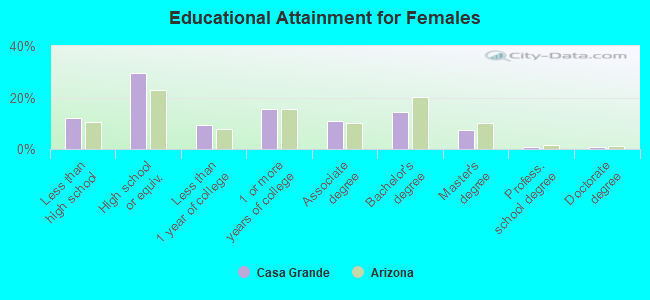
Education attainment for females 25 years and older:
- No schooling: 354
- Nursery to 4th grade: 108
- 5th and 6th grade: 144
- 7th and 8th grade: 692
- 9th grade: 178
- 10th grade: 89
- 11th grade: 371
- 12th grade, no diploma: 512
- High school graduate (or equivalency): 6,039
- Less than 1 year of college: 1,873
- Some college more than 1 year, no degree: 3,146
- Associate degree: 2,176
- Bachelor's degree: 2,899
- Master's degree: 1,466
- Professional school degree: 133
- Doctorate degree: 177
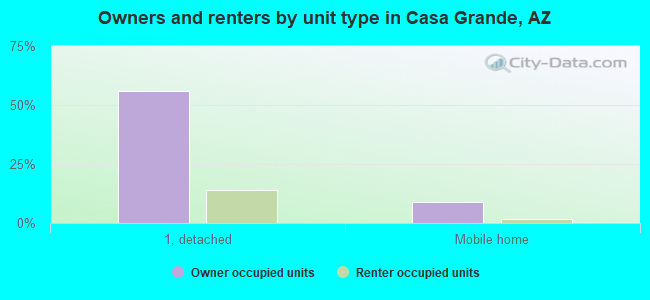
Housing units in structures:
- One, detached: 16,372
- One, attached: 607
- Two: 258
- 3 or 4: 425
- 5 to 9: 993
- 10 to 19: 460
- 20 to 49: 543
- 50 or more: 945
- Mobile homes: 3,874
- Boats, RVs, vans, etc.: 235
Median worth of mobile homes: $67,946
Housing units lacking complete kitchen facilities in 2022: 2.7%
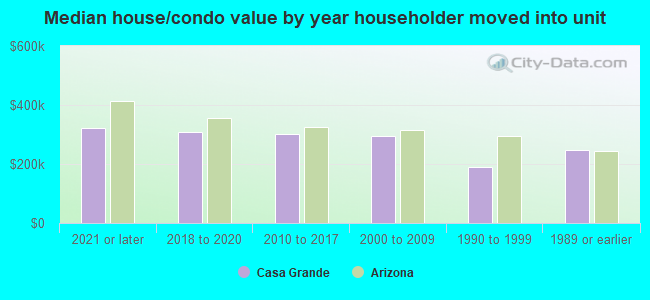
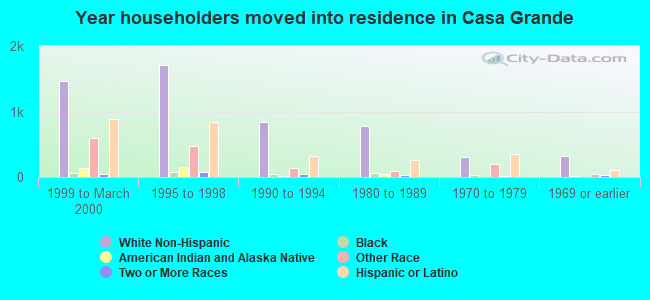
House/condo owner moved in on average 4 years ago
Renter moved in on average 1 years ago
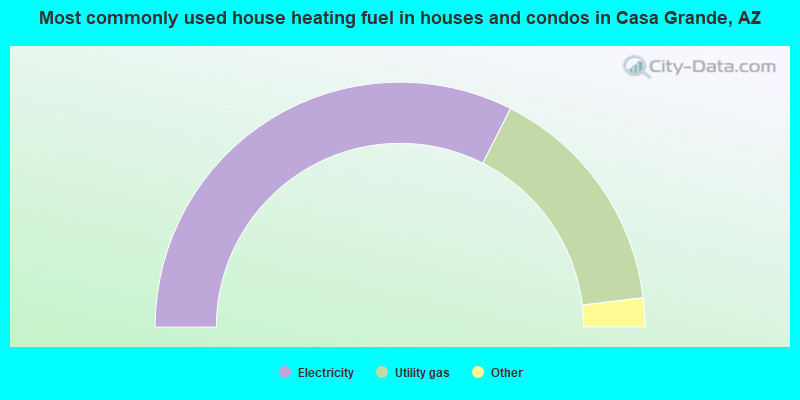
- 65.0%Electricity
- 31.3%Utility gas
- 1.7%Solar energy
- 1.2%Bottled, tank, or LP gas
- 0.7%No fuel used
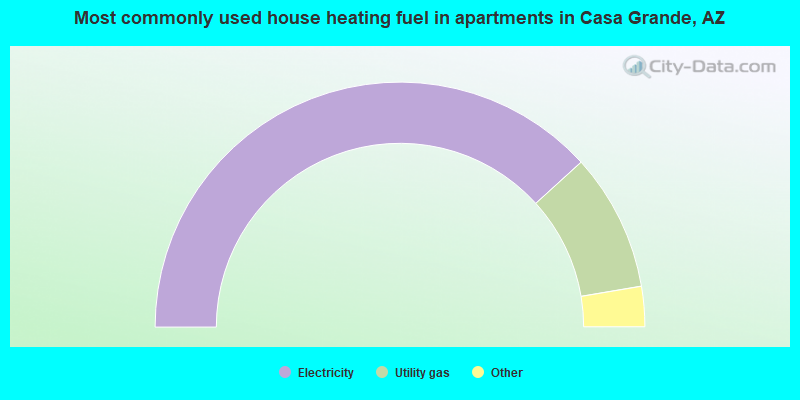
- 76.5%Electricity
- 18.2%Utility gas
- 2.4%No fuel used
- 1.6%Bottled, tank, or LP gas
- 0.7%Solar energy
- 0.3%Other fuel
- 0.2%Fuel oil, kerosene, etc.
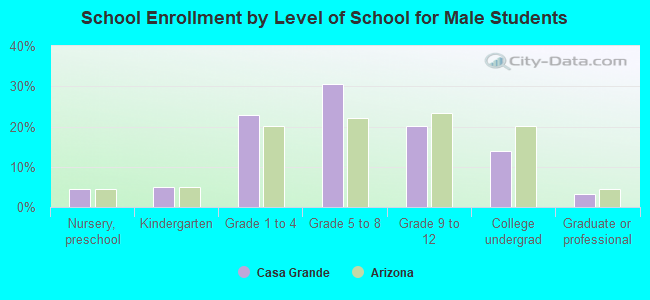
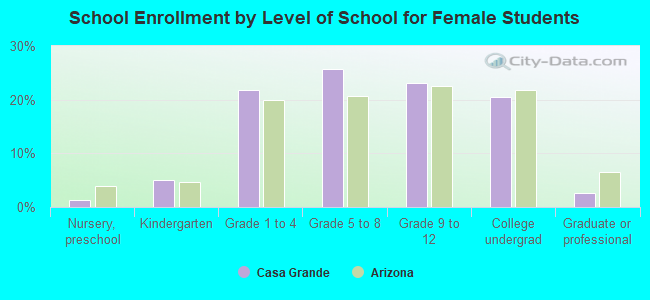
Private vs. public school enrollment:
| Here: | 9.0% |
| Arizona: | 10.4% |
| Here: | 4.3% |
| Arizona: | 8.8% |
| Here: | 13.2% |
| Arizona: | 13.1% |