Housing density: 1,178 houses/condos per square mile
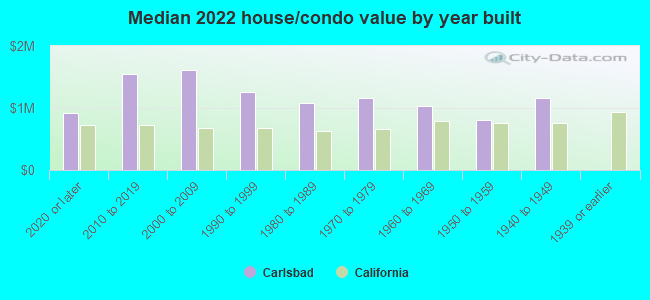
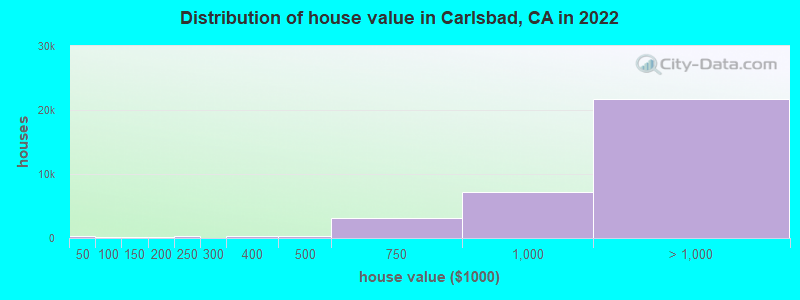
Median price asked for vacant for-sale houses and condos in 2022: $1,558,911.
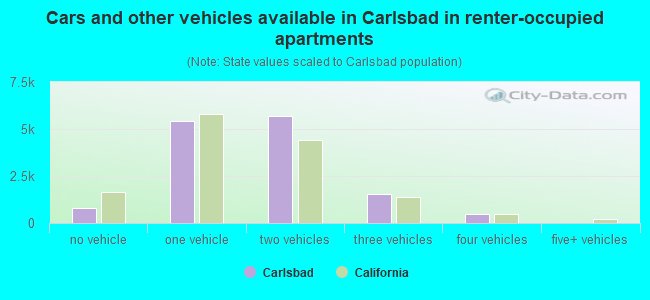
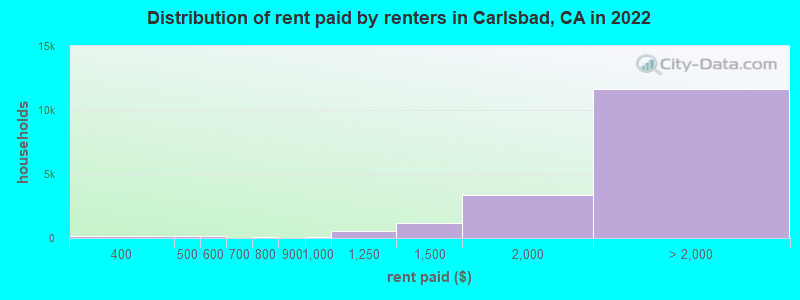
Median contract rent in 2022: over $2,000 (lower quartile is over $2,000, upper quartile is over $2,000)
Median rent asked for vacant for-rent units in 2022: $2,689
Median gross rent in Carlsbad, CA in 2022: over $2,000
Housing units in Carlsbad with a mortgage: 19,562 (3,594 second mortgage, 0 home equity loan, 3,328 both second mortgage and home equity loan) Houses without a mortgage: 513
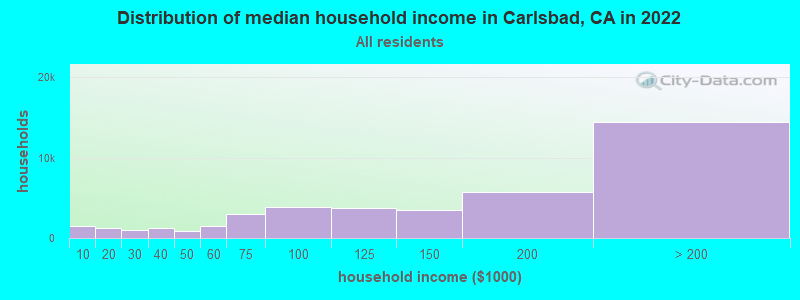
Median household income for houses/condos with a mortgage: $194,345
Median household income for apartments without a mortgage: $113,915
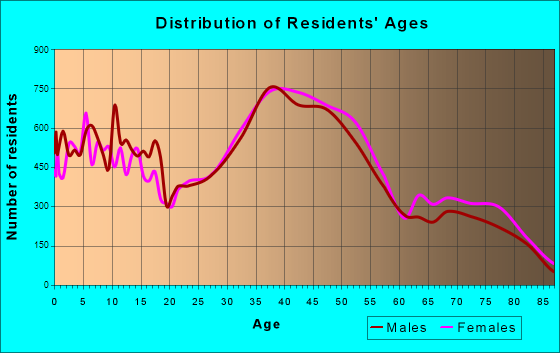
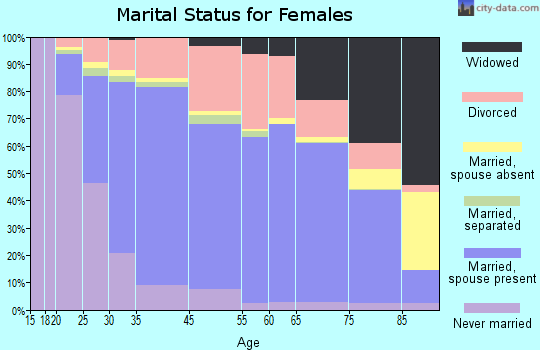
26,247 married couples with children.
2,702 single-parent households (599 men, 2,103 women).
80.2% of residents of Carlsbad speak English at home.
9.4% of residents speak Spanish at home (61% speak English very well, 20% speak English well, 15% speak English not well, 4% don't speak English at all).
5.7% of residents speak other Indo-European language at home (81% speak English very well, 17% speak English well, 2% speak English not well).
4.4% of residents speak Asian or Pacific Island language at home (57% speak English very well, 26% speak English well, 15% speak English not well, 2% don't speak English at all).
0.4% of residents speak other language at home (88% speak English very well, 12% speak English well).
Foreign born population: 16,062 (14.1%)
(56.5% of them are naturalized citizens)
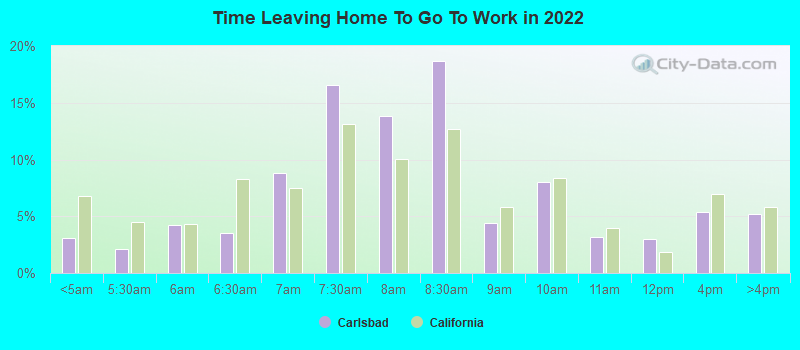
Percentage of workers working in this county: 95.5% Number of people working at home: 17,552 (31.0% of all workers)
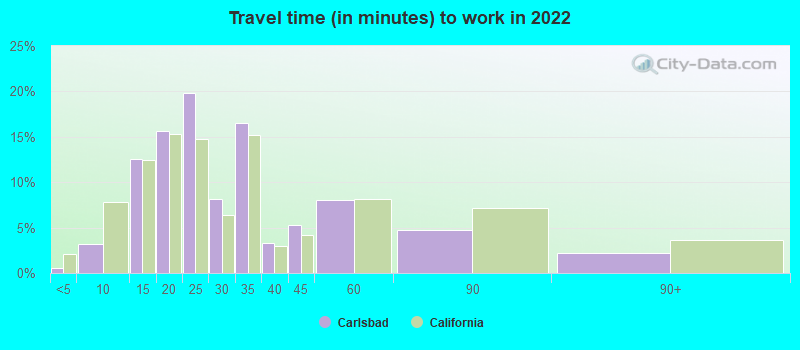
Travel time to work (commute)
Less than 5 minutes: 228
5 to 9 minutes: 1,605
10 to 14 minutes: 5,766
15 to 19 minutes: 6,220
20 to 24 minutes: 4,171
25 to 29 minutes: 1,226
30 to 34 minutes: 5,770
35 to 39 minutes: 368
40 to 44 minutes: 2,204
45 to 59 minutes: 4,340
60 to 89 minutes: 2,534
90 or more minutes: 1,892
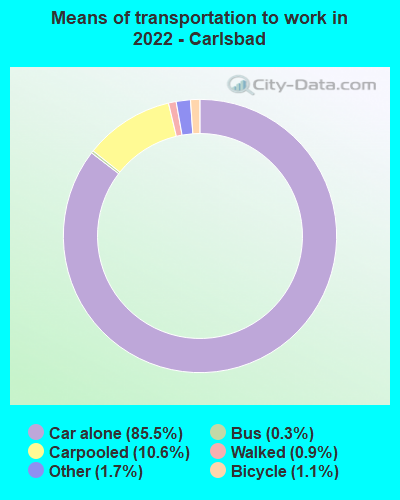
Means of transportation to work:
Drove a car alone: 55,481 (66.5%)
Carpooled: 6,859 (8.2%)
Bus: 188 (0.2%)
Taxi: 1,115 (1.3%)
Bicycle: 689 (0.8%)
Walked: 581 (0.7%)
Worked at home: 18,575 (22.2%)
Unemployment by race in 2022
Unemployment rate for White non-Hispanic residents
3.8%Males
4.1%Females
Unemployment rate for Black residents
6.5%Males
Unemployment rate for American Indian and Alaska Native residents
27.0%Males
Unemployment rate for Asian residents
1.4%Males
2.1%Females
Unemployment rate for other race residents
7.0%Males
2.5%Females
Unemployment rate for two or more race residents
3.3%Males
3.4%Females
Unemployment rate for Hispanic or Latino residents
6.2%Males
5.8%Females
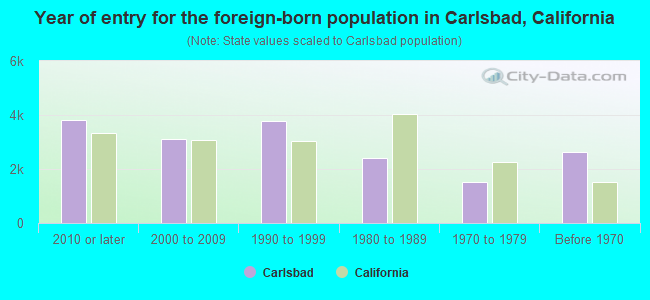
Year of entry for the foreign-born population in Carlsbad, California
3,8152010 or later
3,1062000 to 2009
3,7611990 to 1999
2,3951980 to 1989
1,5321970 to 1979
2,638Before 1970
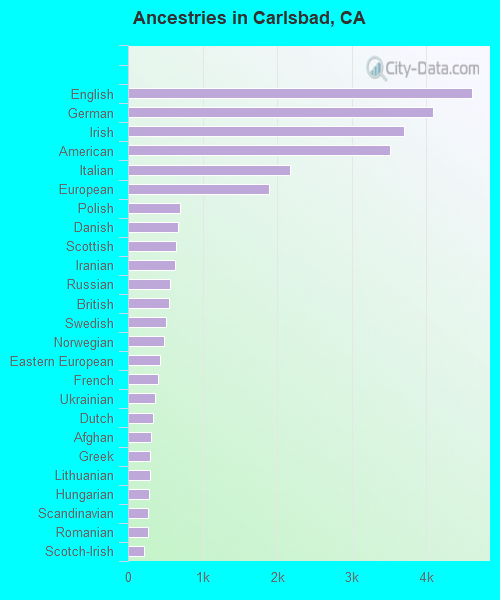
First ancestries reported:
English: 4,612 (9.1%)
German: 4,086 (8.1%)
Irish: 3,696 (7.3%)
American: 3,510 (6.9%)
Italian: 2,173 (4.3%)
European: 1,895 (3.7%)
Polish: 694 (1.4%)
Danish: 674 (1.3%)
Scottish: 648 (1.3%)
Iranian: 631 (1.2%)
Russian: 560 (1.1%)
British: 546 (1.1%)
Swedish: 506 (1.0%)
Norwegian: 479 (0.9%)
Eastern European: 433 (0.9%)
French: 407 (0.8%)
Ukrainian: 361 (0.7%)
Dutch: 336 (0.7%)
Afghan: 303 (0.6%)
Greek: 291 (0.6%)
Lithuanian: 290 (0.6%)
Hungarian: 286 (0.6%)
Scandinavian: 269 (0.5%)
Romanian: 264 (0.5%)
Scotch-Irish: 209 (0.4%)
Czech: 199 (0.4%)
Yugoslavian: 182 (0.4%)
Lebanese: 172 (0.3%)
Belgian: 170 (0.3%)
Swiss: 167 (0.3%)
Northern European: 135 (0.3%)
French Canadian: 130 (0.3%)
Egyptian: 115 (0.2%)
Austrian: 111 (0.2%)
Serbian: 110 (0.2%)
Canadian: 108 (0.2%)
Croatian: 99 (0.2%)
Portuguese: 95 (0.2%)
Finnish: 85 (0.2%)
Welsh: 83 (0.2%)
Jamaican: 78 (0.2%)
Armenian: 77 (0.2%)
African: 74 (0.1%)
Turkish: 65 (0.1%)
Czechoslovakian: 56 (0.1%)
Moroccan: 52 (0.1%)
Bulgarian: 48 (0.09%)
South African: 47 (0.09%)
Syrian: 43 (0.08%)
Latvian: 41 (0.08%)
Celtic: 32 (0.06%)
Assyrian: 31 (0.06%)
Israeli: 27 (0.05%)
Slovene: 24 (0.05%)
Slovak: 22 (0.04%)
Cajun: 21 (0.04%)
Haitian: 21 (0.04%)
Cypriot: 19 (0.04%)
New Zealander: 14 (0.03%)
Iraqi: 10 (0.02%)
Brazilian: 9 (0.02%)
Australian: 7 (0.01%)
Most common places of birth for foreign-born residents (%):
Mexico
Carlsbad:
24.0% (4,212)
California:
37.2% (3,881,193)
India
Carlsbad:
5.4% (945)
California:
5.2% (539,184)
China, excluding Hong Kong and Taiwan
Carlsbad:
5.3% (927)
California:
6.6% (684,672)
Philippines
Carlsbad:
5.2% (912)
California:
7.8% (818,297)
Canada
Carlsbad:
4.7% (819)
California:
1.2% (127,477)
Korea
Carlsbad:
4.1% (711)
California:
3.0% (315,248)
Germany
Carlsbad:
3.3% (583)
California:
0.7% (73,304)
Iran
Carlsbad:
3.2% (555)
California:
2.0% (206,004)
Vietnam
Carlsbad:
2.9% (513)
California:
4.9% (512,335)
Denmark
Carlsbad:
2.9% (507)
California:
0.1% (6,555)
Taiwan
Carlsbad:
2.8% (498)
California:
1.7% (176,274)
Afghanistan
Carlsbad:
2.7% (479)
California:
0.5% (53,260)
England
Carlsbad:
2.7% (469)
California:
0.6% (57,953)
France
Carlsbad:
2.1% (370)
California:
0.4% (40,224)
United Kingdom, excluding England and Scotland
Carlsbad:
1.8% (315)
California:
0.6% (60,582)
Other Eastern Europe
Carlsbad:
1.7% (303)
California:
0.2% (17,699)
Belarus
Carlsbad:
1.6% (284)
California:
0.1% (11,157)
Japan
Carlsbad:
1.5% (268)
California:
1.0% (103,575)
Place of birth for U.S.-born residents:
This state: 65,642
Other state: 30,856
Northeast: 10,185
Midwest: 8,628
South: 6,432
West: 5,611
87.6% of Carlsbad residents lived in the same house 1 years ago. Out of people who lived in different houses, 39.6% lived in this county. Out of people who lived in different counties, 52.8% lived in California.
Carlsbad:
87.6%
State average:
88.9%
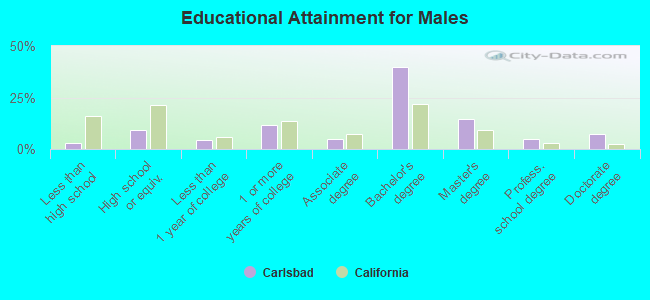
Education attainment for males 25 years and older:
No schooling: 396
Nursery to 4th grade: 0
5th and 6th grade: 7
7th and 8th grade: 0
9th grade: 0
10th grade: 16
11th grade: 97
12th grade, no diploma: 696
High school graduate (or equivalency): 3,627
Less than 1 year of college: 1,704
Some college more than 1 year, no degree: 4,541
Associate degree: 1,945
Bachelor's degree: 15,244
Master's degree: 5,553
Professional school degree: 1,811
Doctorate degree: 2,875
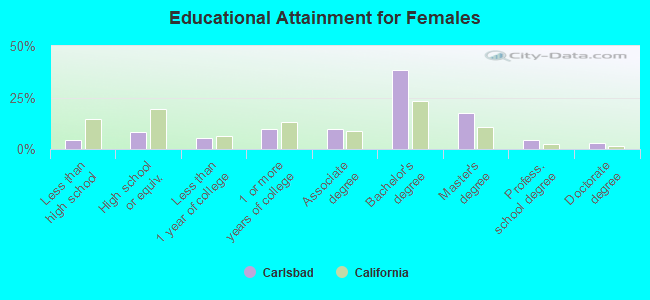
Education attainment for females 25 years and older:
No schooling: 580
Nursery to 4th grade: 0
5th and 6th grade: 106
7th and 8th grade: 0
9th grade: 84
10th grade: 57
11th grade: 110
12th grade, no diploma: 769
High school graduate (or equivalency): 3,210
Less than 1 year of college: 2,075
Some college more than 1 year, no degree: 3,802
Associate degree: 3,848
Bachelor's degree: 15,295
Master's degree: 7,017
Professional school degree: 1,681
Doctorate degree: 1,150
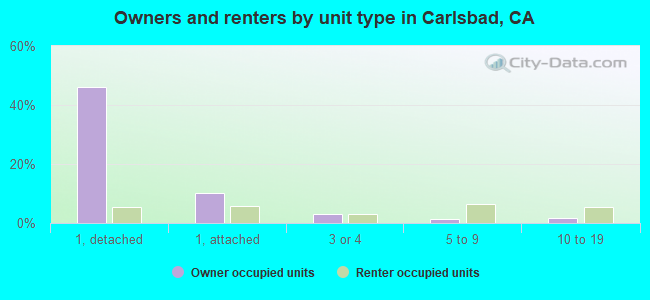
Housing units in structures:
One, detached: 25,972
One, attached: 5,822
Two: 178
3 or 4: 1,958
5 to 9: 2,351
10 to 19: 2,095
20 to 49: 1,970
50 or more: 2,958
Mobile homes: 795
Median worth of mobile homes: $476,300
Housing units lacking complete plumbing facilities in 2022: 0.5%
Housing units lacking complete kitchen facilities in 2022: 0.2%
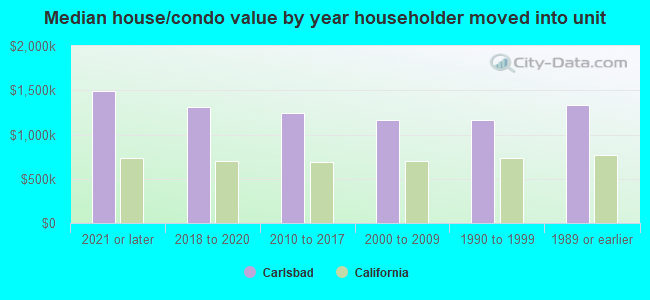
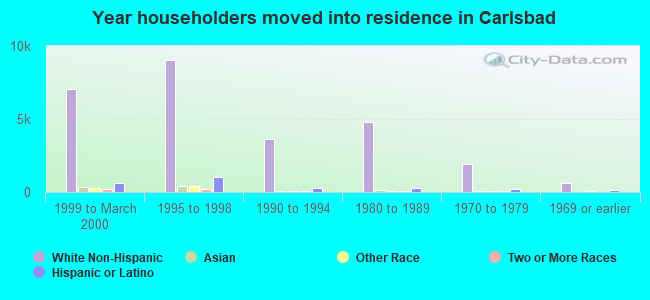
House/condo owner moved in on average 10 years ago