Canyon, TX (Texas) Houses and Residents
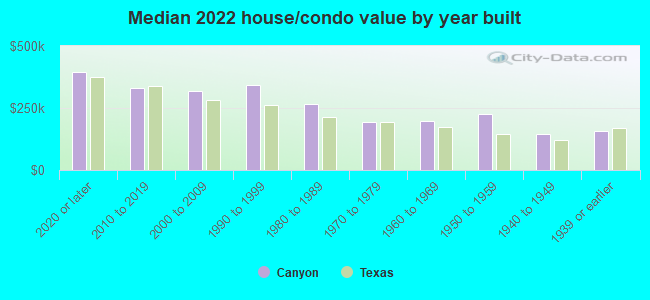
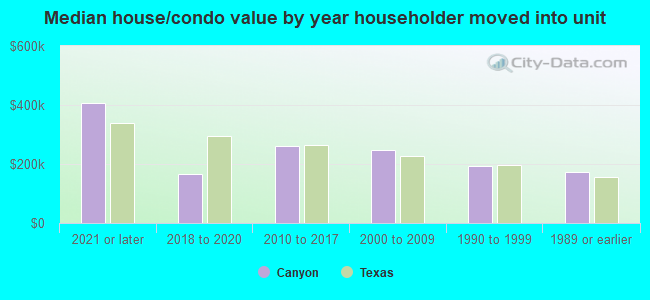
| Canyon: | $228,314 |
| Texas: | $275,400 |
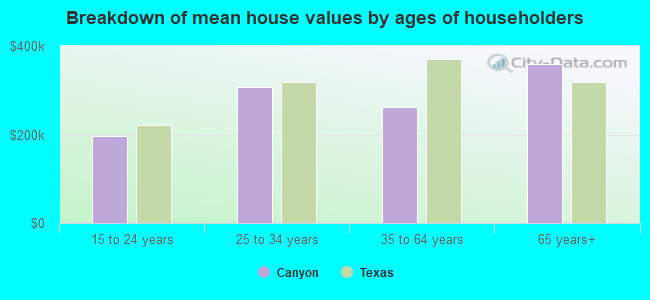
Mean price in 2022:
Detached houses: $313,954
Here: $313,954 State: $369,058 Townhouses or other attached units: $235,055
Here: $235,055 State: $327,631 In 5-or-more-unit structures: $98,025
Here: $98,025 State: $413,944 Mobile homes: $27,089
Here: $27,089 State: $124,413
Total population: 14,432 (Urban population: 12,838 (all inside urban clusters), Rural population: 118 (all nonfarm))
Houses: 5,924 (5,309 occupied: 2,845 owner occupied, 2,382 renter occupied)
| % of renters here: | 46% |
| State: | 38% |
Housing density: 1,196 houses/condos per square mile
Median price asked for vacant for-sale houses and condos in 2022: $535,151.
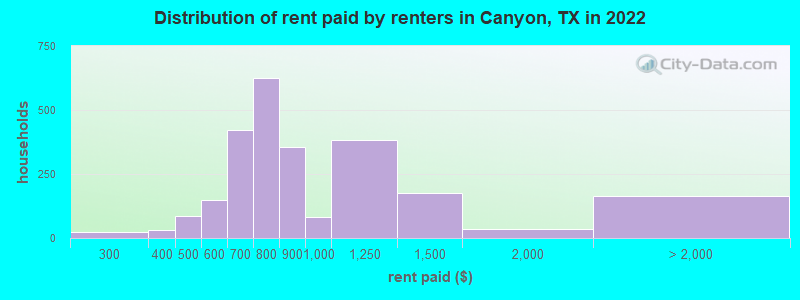
Median contract rent in 2022: $696 (lower quartile is $605, upper quartile is $975)
Median rent asked for vacant for-rent units in 2022: $906
Median gross rent in Canyon, TX in 2022: $861
Housing units in Canyon with a mortgage: 1,438 (40 second mortgage, 0 home equity loan, 33 both second mortgage and home equity loan)
Houses without a mortgage: 0
Median household income for houses/condos with a mortgage: $113,614
Median household income for apartments without a mortgage: $105,846
Median monthly housing costs: $1,028
Compare current foreclosures near Canyon, TX:
| Photo | Address | Area | Beds / Baths | Price | Details |
|---|---|---|---|---|---|

|
#1
Santa Fe Trl
Canyon, TX 79015
|
1,214 sq. feet
|
2 baths 3 beds |
show details | |

|
#2
Brookhaven Dr
Canyon, TX 79015
|
2,894 sq. feet
|
3 baths 3 beds |
show details | |

|
#3
Star Light Ln
Canyon, TX 79015
|
2,052 sq. feet
|
2 baths 3 beds |
show details | |

|
#4
S Soncy Rd
Canyon, TX 79015
|
2,559 sq. feet
|
2 baths 3 beds |
show details | |

|
#5
Davis Rd
Canyon, TX 79015
|
1,440 sq. feet
|
2 baths 3 beds |
show details | |

|
#6
Raburn Ln
Canyon, TX 79015
|
- sq. feet
|
- baths - beds |
show details | |

|
#7
4th Ave # 138
Canyon, TX 79015
|
- sq. feet
|
- baths - beds |
show details | |

|
#8
4th Ave # 144
Canyon, TX 79015
|
- sq. feet
|
- baths - beds |
show details | |

|
#9
Bushland Rd
Canyon, TX 79015
|
- sq. feet
|
- baths - beds |
show details | |

|
#10
Ten Point Rd
Canyon, TX 79015
|
- sq. feet
|
- baths - beds |
show details |
| Photo | Address | Area | Beds / Baths | Price | Details |
|---|---|---|---|---|---|

|
#11
S Fm 1705
Canyon, TX 79015
|
- sq. feet
|
- baths - beds |
show details | |

|
#12
Jj St
Canyon, TX 79015
|
- sq. feet
|
- baths - beds |
show details | |

|
#13
Devon Dr
Amarillo, TX 79109
|
1,798 sq. feet
|
2 baths 2 beds |
show details | |

|
#14
Purdue St
Amarillo, TX 79109
|
1,538 sq. feet
|
2 baths 3 beds |
show details | |

|
#15
Crockett St
Amarillo, TX 79110
|
1,081 sq. feet
|
1 baths 3 beds |
show details | |

|
#16
Steffi Ct
Amarillo, TX 79110
|
- sq. feet
|
2 baths 3 beds |
show details | |

|
#17
Loesh St
Amarillo, TX 79118
|
- sq. feet
|
2 baths 3 beds |
show details | |

|
#18
S Bonham St
Amarillo, TX 79110
|
1,176 sq. feet
|
1 baths 3 beds |
show details | |

|
#19
Sw10th Ave
Amarillo, TX 79106
|
- sq. feet
|
2 baths 4 beds |
show details | |

|
#20
Palmetto Trl
Amarillo, TX 79106
|
2,069 sq. feet
|
2 baths 3 beds |
show details |
| Photo | Address | Area | Beds / Baths | Price | Details |
|---|---|---|---|---|---|

|
#21
Linda Dr
Amarillo, TX 79109
|
1,188 sq. feet
|
1 baths 3 beds |
show details | |

|
#22
S Milam St
Amarillo, TX 79109
|
3,958 sq. feet
|
4 baths 4 beds |
show details | |

|
#23
Charles St
Amarillo, TX 79106
|
2,510 sq. feet
|
4 baths 4 beds |
show details | |

|
#24
S Milam St
Amarillo, TX 79109
|
1,755 sq. feet
|
2 baths 3 beds |
show details | |

|
#25
Woodmont Dr
Amarillo, TX 79119
|
2,851 sq. feet
|
4 baths 4 beds |
show details | |

|
#26
Lawndale Dr
Amarillo, TX 79103
|
1,000 sq. feet
|
1 baths 3 beds |
show details | |

|
#27
N Virginia St
Amarillo, TX 79106
|
988 sq. feet
|
2 baths 2 beds |
show details | |

|
#28
Athens St
Amarillo, TX 79118
|
- sq. feet
|
2 baths 3 beds |
show details | |

|
#29
N Georgia St
Amarillo, TX 79106
|
1,288 sq. feet
|
2 baths 3 beds |
show details | |

|
#30
S Milam St
Amarillo, TX 79110
|
1,115 sq. feet
|
2 baths 3 beds |
show details |
| Photo | Address | Area | Beds / Baths | Price | Details |
|---|---|---|---|---|---|

|
#31
Roxton Dr
Amarillo, TX 79109
|
3,051 sq. feet
|
3 baths 4 beds |
show details | |

|
#32
Westgate Dr
Amarillo, TX 79106
|
1,302 sq. feet
|
2 baths 3 beds |
show details | |

|
#33
S Lipscomb St
Amarillo, TX 79109
|
1,084 sq. feet
|
1 baths 3 beds |
show details | |

|
#34
S Beverly Dr
Amarillo, TX 79106
|
1,740 sq. feet
|
2 baths 3 beds |
show details | |

|
#35
Crockett St
Amarillo, TX 79110
|
1,168 sq. feet
|
1 baths 2 beds |
show details | |

|
#36
Veterans St
Amarillo, TX 79106
|
1,984 sq. feet
|
2 baths 3 beds |
show details | |

|
#37
S Harrison St
Amarillo, TX 79109
|
2,478 sq. feet
|
2 baths 4 beds |
show details | |

|
#38
Kingston Rd
Amarillo, TX 79109
|
1,622 sq. feet
|
2 baths 3 beds |
show details | |

|
#39
Olympia Dr
Amarillo, TX 79110
|
2,469 sq. feet
|
2 baths 3 beds |
show details | |

|
#40
Torre Dr
Amarillo, TX 79109
|
2,448 sq. feet
|
2 baths 4 beds |
show details |
| Photo | Address | Area | Beds / Baths | Price | Details |
|---|---|---|---|---|---|

|
#41
Barry Dean Rd
Amarillo, TX 79119
|
- sq. feet
|
2 baths 4 beds |
show details | |

|
#42
La Paloma St
Amarillo, TX 79106
|
1,278 sq. feet
|
1 baths 2 beds |
show details | |

|
#43
Pittsburg St
Amarillo, TX 79103
|
1,932 sq. feet
|
2 baths 3 beds |
show details | |

|
#44
S Lamar St
Amarillo, TX 79102
|
1,668 sq. feet
|
1 baths 2 beds |
show details | |

|
#45
S Taylor St
Amarillo, TX 79102
|
1,814 sq. feet
|
1 baths 2 beds |
show details | |

|
#46
S Milam St
Amarillo, TX 79110
|
1,299 sq. feet
|
2 baths 3 beds |
show details | |

|
#47
Julian Blvd
Amarillo, TX 79102
|
4,031 sq. feet
|
3 baths 4 beds |
show details | |

|
#48
S Monroe St
Amarillo, TX 79110
|
742 sq. feet
|
1 baths 2 beds |
show details | |

|
#49
Westgate Dr
Amarillo, TX 79106
|
1,294 sq. feet
|
2 baths 3 beds |
show details | |

|
Check over 1 million property listings on Foreclosure.com!
|
browse all offers | |||

Latest news about housing in Canyon, TX collected exclusively by city-data.com from local newspapers, TV, and radio stations


Median year apartment built: 1978
Household type by relationship:
Households: 15,585- Male householders: 2,982 (579 living alone), Female householders: 2,397 (867 living alone)
2,735 spouses (2,721 opposite-sex spouses), 191 unmarried partners, (191 opposite-sex unmarried partners), 4,384 children (4,068 natural, 116 adopted, 199 stepchildren), 52 grandchildren, 74 brothers or sisters, 263 parents, 0 foster children, 180 other relatives, 577 non-relatives
- In group quarters: 1,745
Size of family households: 1,442 2-persons, 789 3-persons, 597 4-persons, 470 5-persons, 91 6-persons.
Size of nonfamily households: 1,486 1-person, 199 2-persons, 60 3-persons.
2,661 married couples with children.
758 single-parent households (534 men, 224 women).
86.5% of residents of Canyon speak English at home.
9.2% of residents speak Spanish at home (85% speak English very well, 4% speak English well, 8% speak English not well, 3% don't speak English at all).
2.4% of residents speak other Indo-European language at home (93% speak English very well, 7% speak English well).
1.0% of residents speak Asian or Pacific Island language at home (81% speak English very well, 19% speak English well).
0.8% of residents speak other language at home (35% speak English very well, 65% speak English well).
Foreign born population: 977 (6.3%)
(24.3% of them are naturalized citizens)
| Here: | 6.4 |
| State: | 6.3 |
| Here: | 4.5 |
| State: | 4.0 |
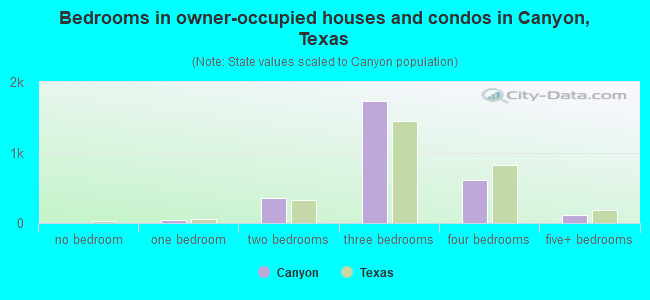
- Bedrooms in owner-occupied houses and condos in Canyon, Texas
- 0no bedroom
- 431 bedroom
- 3532 bedrooms
- 1,7253 bedrooms
- 6114 bedrooms
- 1125+ bedrooms
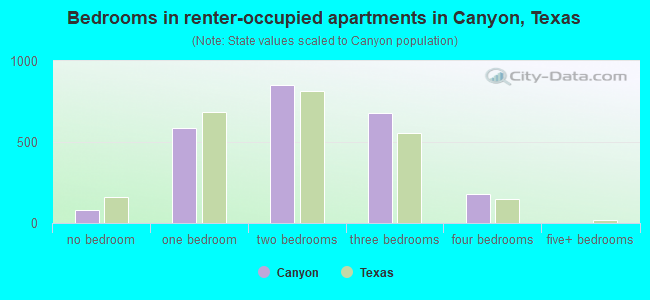
- Bedrooms in renter-occupied apartments in Canyon, Texas
- 81no bedroom
- 5861 bedroom
- 8542 bedrooms
- 6813 bedrooms
- 1814 bedrooms
- 05+ bedrooms
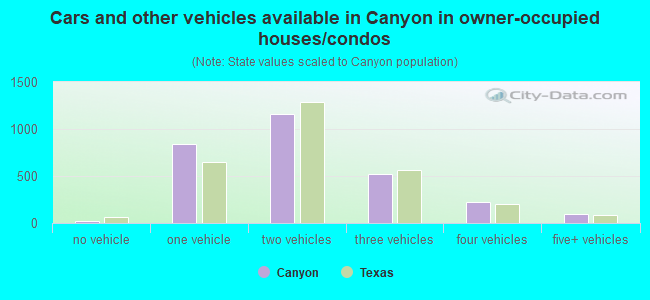
- Cars and other vehicles available in Canyon in owner-occupied houses/condos
- 17no vehicle
- 8381 vehicle
- 1,1572 vehicles
- 5183 vehicles
- 2244 vehicles
- 915+ vehicles
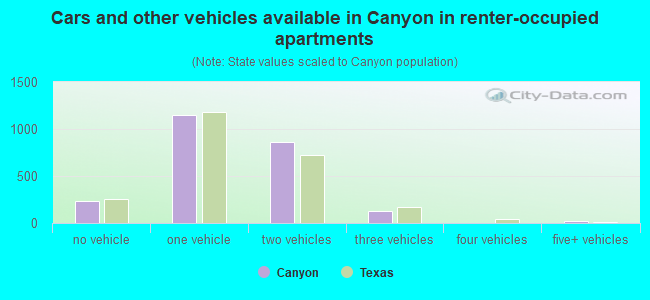
- Cars and other vehicles available in Canyon in renter-occupied apartments
- 229no vehicle
- 1,1461 vehicle
- 8582 vehicles
- 1293 vehicles
- 04 vehicles
- 205+ vehicles
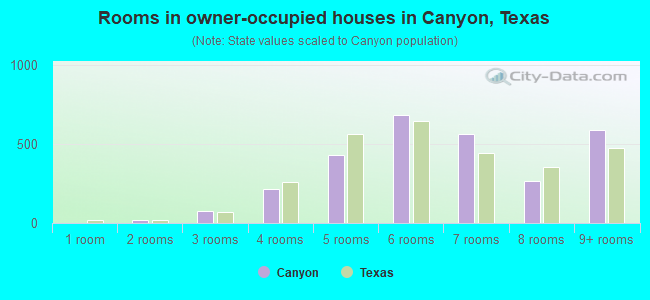
- Rooms in owner-occupied houses in Canyon, Texas
- 01 room
- 172 rooms
- 733 rooms
- 2164 rooms
- 4335 rooms
- 6856 rooms
- 5657 rooms
- 2698 rooms
- 5889+ rooms
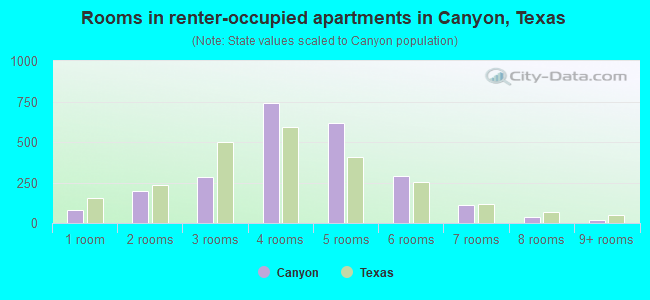
- Rooms in renter-occupied apartments in Canyon, Texas
- 811 room
- 1982 rooms
- 2853 rooms
- 7424 rooms
- 6205 rooms
- 2936 rooms
- 1107 rooms
- 368 rooms
- 179+ rooms
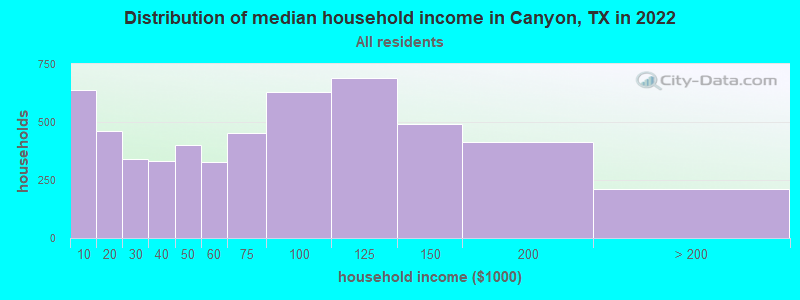
Canyon, TX household income distribution

- 636Less than $10,000
- 461$10,000 to $19,999
- 340$20,000 to $29,999
- 332$30,000 to $39,999
- 403$40,000 to $49,999
- 327$50,000 to $59,999
- 453$60,000 to $74,999
- 630$75,000 to $99,999
- 690$100,000 to $124,999
- 492$125,000 to $149,999
- 413$150,000 to $199,999
- 213$200,000 or more
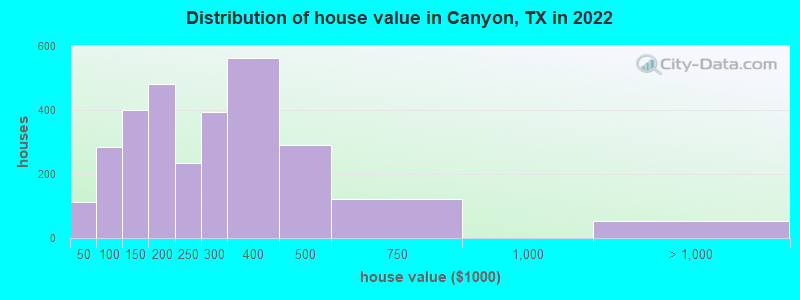
Home value of owner - occupied houses in 2022 in Canyon, TX
-
- 35Less than $10,000
- 10$10,000 to $14,999
- 11$15,000 to $19,999
- 30$20,000 to $24,999
- 27$40,000 to $49,999
- 45$50,000 to $59,999
- 21$60,000 to $69,999
- 153$80,000 to $89,999
- 35$90,000 to $99,999
- 259$100,000 to $124,999
- 140$125,000 to $149,999
- 172$150,000 to $174,999
- 308$175,000 to $199,999
- 234$200,000 to $249,999
- 394$250,000 to $299,999
- 562$300,000 to $399,999
- 290$400,000 to $499,999
- 121$500,000 to $749,999
- 9$1,500,000 to $1,999,999
- 44$2,000,000 or more
Rent paid by renters in 2022 in Canyon, TX
-
- 22$200 to $249
- 31$350 to $399
- 34$400 to $449
- 50$450 to $499
- 93$500 to $549
- 54$550 to $599
- 208$600 to $649
- 212$650 to $699
- 514$700 to $749
- 110$750 to $799
- 355$800 to $899
- 81$900 to $999
- 381$1,000 to $1,249
- 173$1,250 to $1,499
- 35$1,500 to $1,999
- 43$2,000 to $2,499
- 7$2,500 to $2,999
- 8$3,500 or more
- 103No cash rent
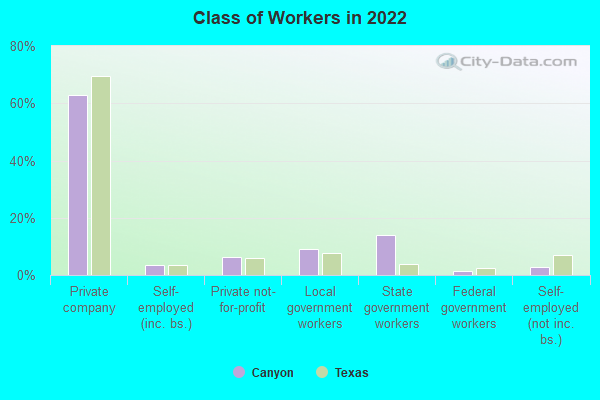
Percentage of workers working in this county: 74.1%
Number of people working at home: 377 (4.9% of all workers)
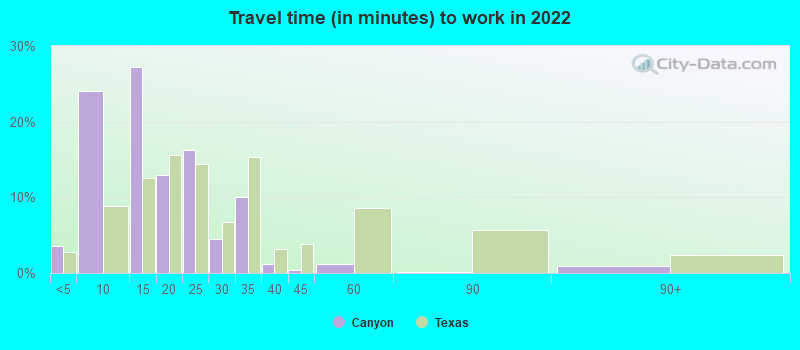
Travel time to work (commute)
- Less than 5 minutes: 445
- 5 to 9 minutes: 1,685
- 10 to 14 minutes: 1,312
- 15 to 19 minutes: 946
- 20 to 24 minutes: 766
- 25 to 29 minutes: 429
- 30 to 34 minutes: 859
- 35 to 39 minutes: 357
- 40 to 44 minutes: 121
- 45 to 59 minutes: 109
- 60 to 89 minutes: 290
- 90 or more minutes: 195
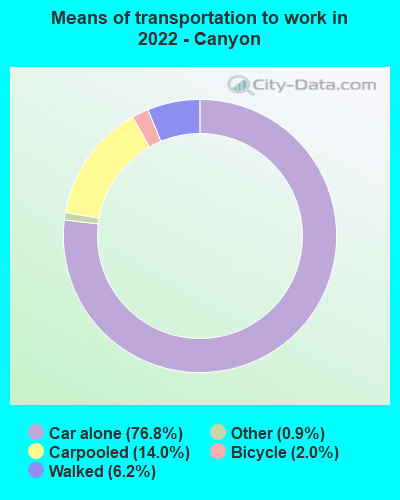
Means of transportation to work:
- Drove a car alone: 4,543 (69.6%)
- Carpooled: 901 (13.8%)
- Taxi: 64 (1.0%)
- Bicycle: 116 (1.8%)
- Walked: 396 (6.1%)
- Worked at home: 377 (5.8%)
- Unemployment by race in 2022
- Unemployment rate for White non-Hispanic residents
- 1.2%Males
- 3.7%Females
- Unemployment rate for American Indian and Alaska Native residents
- 79.7%Males
- Unemployment rate for Asian residents
- 18.5%Females
- Unemployment rate for two or more race residents
- 8.2%Males
- Unemployment rate for Hispanic or Latino residents
- 6.6%Males
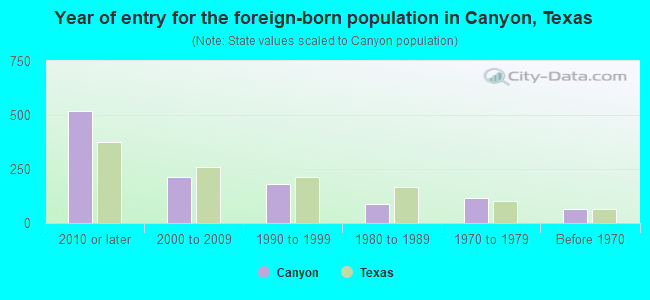
- Year of entry for the foreign-born population in Canyon, Texas
- 5182010 or later
- 2152000 to 2009
- 1811990 to 1999
- 861980 to 1989
- 1151970 to 1979
- 63Before 1970
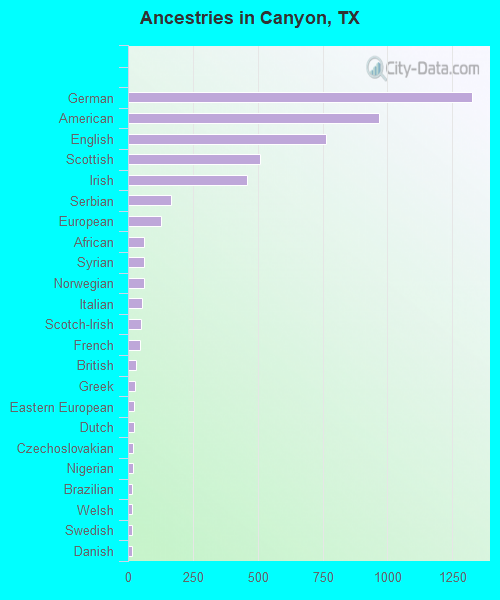
First ancestries reported:
- German: 1,325 (17.0%)
- American: 967 (12.4%)
- English: 763 (9.8%)
- Scottish: 507 (6.5%)
- Irish: 460 (5.9%)
- Serbian: 167 (2.1%)
- European: 127 (1.6%)
- African: 63 (0.8%)
- Syrian: 62 (0.8%)
- Norwegian: 62 (0.8%)
- Italian: 55 (0.7%)
- Scotch-Irish: 50 (0.6%)
- French: 46 (0.6%)
- British: 32 (0.4%)
- Greek: 28 (0.4%)
- Eastern European: 24 (0.3%)
- Dutch: 22 (0.3%)
- Czechoslovakian: 20 (0.3%)
- Nigerian: 19 (0.2%)
- Brazilian: 17 (0.2%)
- Welsh: 16 (0.2%)
- Swedish: 15 (0.2%)
- Danish: 14 (0.2%)
- Canadian: 10 (0.1%)
- Scandinavian: 10 (0.1%)
- Bahamian: 10 (0.1%)
- Finnish: 7 (0.09%)
- Polish: 7 (0.09%)
- Croatian: 3 (0.04%)
Most common places of birth for foreign-born residents (%):
| Canyon: | 41.2% (437) |
| Texas: | 48.4% (2,411,723) |
| Canyon: | 11.6% (123) |
| Texas: | 0.0% (2,124) |
| Canyon: | 5.4% (57) |
| Texas: | 6.1% (306,347) |
| Canyon: | 5.1% (54) |
| Texas: | 1.1% (55,371) |
| Canyon: | 4.8% (51) |
| Texas: | 0.1% (6,586) |
| Canyon: | 4.3% (46) |
| Texas: | 1.9% (96,110) |
| Canyon: | 4.2% (45) |
| Texas: | 2.3% (115,558) |
| Canyon: | 3.5% (37) |
| Texas: | 0.4% (21,746) |
| Canyon: | 3.4% (36) |
| Texas: | 0.4% (20,885) |
| Canyon: | 2.6% (28) |
| Texas: | 0.5% (24,723) |
| Canyon: | 2.2% (23) |
| Texas: | 0.2% (9,141) |
| Canyon: | 1.9% (20) |
| Texas: | 0.2% (8,227) |
| Canyon: | 1.6% (17) |
| Texas: | 0.1% (3,790) |
Place of birth for U.S.-born residents:
- This state: 10,358
- Other state: 4,241
- Northeast: 364
- Midwest: 1,111
- South: 1,296
- West: 1,377
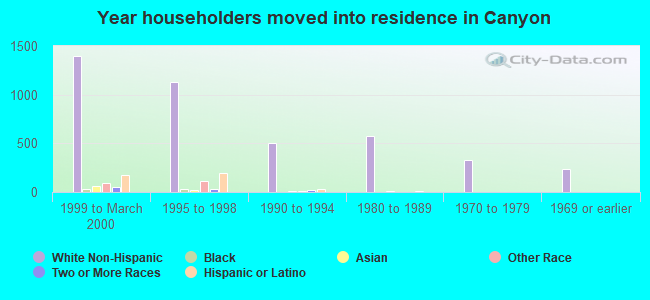
82.2% of Canyon residents lived in the same house 1 years ago.
Out of people who lived in different houses, 27.0% lived in this county.
Out of people who lived in different counties, 61.0% lived in Texas.
| Canyon: | 82.2% |
| State average: | 85.7% |
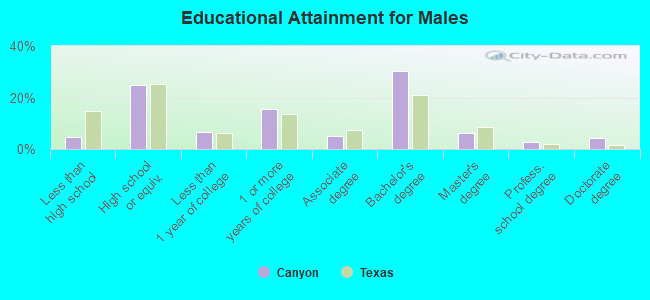
Education attainment for males 25 years and older:
- No schooling: 18
- Nursery to 4th grade: 76
- 5th and 6th grade: 34
- 7th and 8th grade: 16
- 9th grade: 11
- 10th grade: 47
- 11th grade: 0
- 12th grade, no diploma: 0
- High school graduate (or equivalency): 1,112
- Less than 1 year of college: 303
- Some college more than 1 year, no degree: 694
- Associate degree: 234
- Bachelor's degree: 1,364
- Master's degree: 272
- Professional school degree: 116
- Doctorate degree: 187
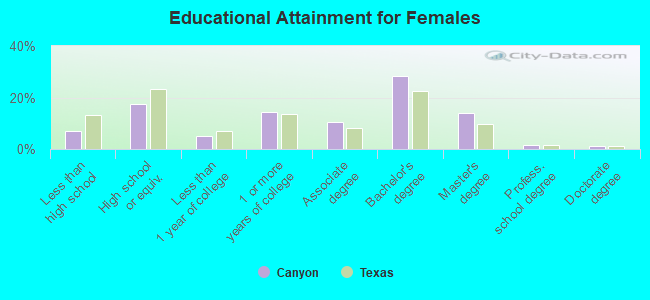
Education attainment for females 25 years and older:
- No schooling: 36
- Nursery to 4th grade: 84
- 5th and 6th grade: 71
- 7th and 8th grade: 0
- 9th grade: 22
- 10th grade: 20
- 11th grade: 16
- 12th grade, no diploma: 25
- High school graduate (or equivalency): 670
- Less than 1 year of college: 199
- Some college more than 1 year, no degree: 560
- Associate degree: 405
- Bachelor's degree: 1,099
- Master's degree: 545
- Professional school degree: 65
- Doctorate degree: 46
Housing units in structures:
- One, detached: 3,743
- One, attached: 308
- Two: 273
- 3 or 4: 274
- 5 to 9: 305
- 10 to 19: 210
- 20 to 49: 174
- 50 or more: 383
- Mobile homes: 233
- Boats, RVs, vans, etc.: 17
Housing units lacking complete kitchen facilities in 2022: 4.2%
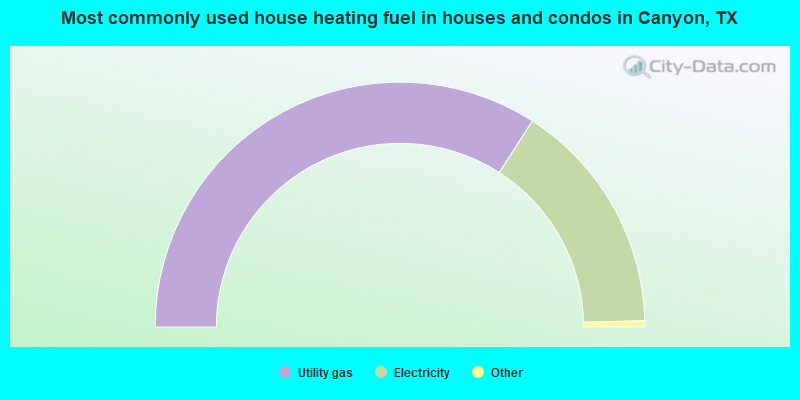
- 68.2%Utility gas
- 31.0%Electricity
- 0.5%No fuel used
- 0.3%Bottled, tank, or LP gas
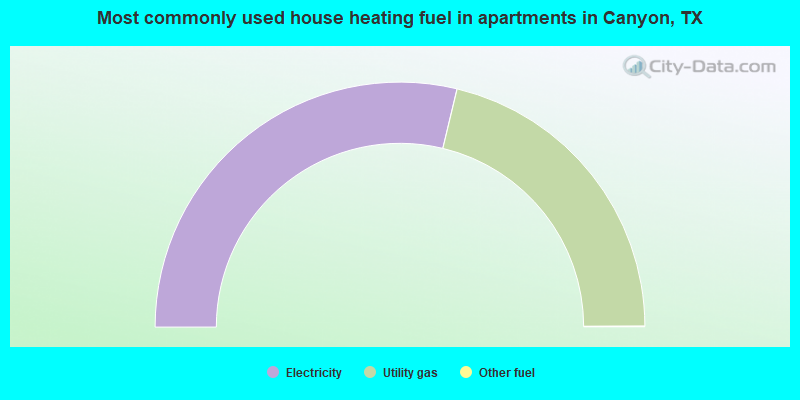
- 57.5%Electricity
- 42.4%Utility gas
- 0.1%Other fuel
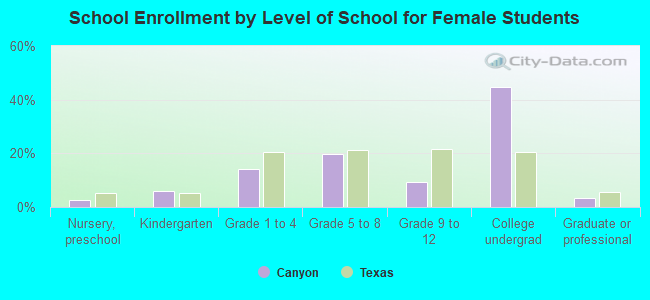
Private vs. public school enrollment:
| Here: | 5.4% |
| Texas: | 8.8% |
| Here: | 0.0% |
| Texas: | 8.0% |
| Here: | 3.9% |
| Texas: | 16.2% |