Campaign, TN (Tennessee) Houses and Residents
| Campaign: | $172,619 |
| Tennessee: | $284,800 |
Total population: 3,788 (Urban population: 0, Rural population: 3,646 (191 farm, 3,455 nonfarm))
Houses: 1,514 (1,381 occupied: 1,178 owner occupied, 203 renter occupied)
| % of renters here: | 15% |
| State: | 33% |
Housing density: 25 houses/condos per square mile
Median price asked for vacant for-sale houses and condos in 2022 in this county: $186,737.
Median contract rent in 2022: $658 (lower quartile is $491, upper quartile is $783)
Median rent asked for vacant for-rent units in 2022: $723
Median gross rent in Campaign, TN in 2022: $899
Housing units in Campaign with a mortgage: 434 (28 second mortgage, 22 home equity loan, 0 both second mortgage and home equity loan)
Houses without a mortgage: 242
Compare current foreclosures near Campaign, TN:
| Photo | Address | Area | Beds / Baths | Price | Details |
|---|---|---|---|---|---|

|
#1
Mount View Ave
Mc Minnville, TN 37110
|
2,039 sq. feet
|
2 baths 3 beds |
show details | |

|
#2
Hidden Valley Cir
Mc Minnville, TN 37110
|
1,404 sq. feet
|
2 baths 3 beds |
show details | |

|
#3
Sherwood Dr
Spencer, TN 38585
|
- sq. feet
|
3 baths 5 beds |
show details | |

|
#4
Andy Hillis Rd
Mc Minnville, TN 37110
|
984 sq. feet
|
1 baths 2 beds |
show details | |

|
#5
W Everett St
Sparta, TN 38583
|
1,152 sq. feet
|
2 baths - beds |
show details | |

|
#6
Hillwood Ln
Mc Minnville, TN 37110
|
1,579 sq. feet
|
2 baths - beds |
show details | |

|
#7
N Camp Heights Dr
Sparta, TN 38583
|
768 sq. feet
|
1 baths - beds |
show details | |

|
#8
Bugger Ridge Rd
Mc Minnville, TN 37110
|
1,200 sq. feet
|
1 baths - beds |
show details | |

|
#9
John Oliver Rd
Mc Minnville, TN 37110
|
950 sq. feet
|
1 baths - beds |
show details | |

|
#10
Doyle Cemetery Rd
Doyle, TN 38559
|
985 sq. feet
|
1 baths - beds |
show details |
| Photo | Address | Area | Beds / Baths | Price | Details |
|---|---|---|---|---|---|

|
#11
Southside Dr
Mc Minnville, TN 37110
|
1,128 sq. feet
|
1 baths - beds |
show details | |

|
#12
Creek Ln
Mc Minnville, TN 37110
|
1,228 sq. feet
|
2 baths - beds |
show details | |

|
#13
Pine Grove Rd
Spencer, TN 38585
|
1,152 sq. feet
|
1 baths - beds |
show details | |

|
#14
Eastside Ln
Rock Island, TN 38581
|
1,125 sq. feet
|
1 baths - beds |
show details | |

|
#15
Spencer Dr
Spencer, TN 38585
|
1,584 sq. feet
|
1 baths - beds |
show details | |

|
#16
Spencer Dr
Spencer, TN 38585
|
1,152 sq. feet
|
1 baths - beds |
show details | |

|
#17
Mountain View Dr
Morrison, TN 37357
|
1,344 sq. feet
|
2 baths - beds |
show details | |

|
#18
Spring Valley Rd
Mc Minnville, TN 37110
|
1,250 sq. feet
|
2 baths - beds |
show details | |

|
#19
Horton Rd
Quebeck, TN 38579
|
1,704 sq. feet
|
1 baths - beds |
show details | |

|
#20
Forest Dr
Mc Minnville, TN 37110
|
1,100 sq. feet
|
1 baths - beds |
show details |
| Photo | Address | Area | Beds / Baths | Price | Details |
|---|---|---|---|---|---|

|
#21
Three Island Rd
Walling, TN 38587
|
1,796 sq. feet
|
1 baths - beds |
show details | |

|
#22
Bybee Dr
Mc Minnville, TN 37110
|
1,050 sq. feet
|
1 baths - beds |
show details | |

|
#23
Ash St
Mc Minnville, TN 37110
|
1,071 sq. feet
|
2 baths - beds |
show details | |

|
#24
Ross Dr
Mc Minnville, TN 37110
|
1,000 sq. feet
|
1 baths - beds |
show details | |

|
#25
Heather Dr
Sparta, TN 38583
|
1,075 sq. feet
|
1 baths - beds |
show details | |

|
#26
Shelbyville Rd
Mc Minnville, TN 37110
|
1,080 sq. feet
|
2 baths - beds |
show details | |

|
#27
Lucille St
Sparta, TN 38583
|
960 sq. feet
|
1 baths - beds |
show details | |

|
#28
Cedar Ln
Sparta, TN 38583
|
3,068 sq. feet
|
2 baths - beds |
show details | |

|
#29
Meadowbrook Dr
Smithville, TN 37166
|
1,222 sq. feet
|
1 baths - beds |
show details | |

|
#30
Clark St
Sparta, TN 38583
|
1,521 sq. feet
|
1 baths - beds |
show details |
| Photo | Address | Area | Beds / Baths | Price | Details |
|---|---|---|---|---|---|

|
#31
Hayes St
Sparta, TN 38583
|
1,008 sq. feet
|
1 baths - beds |
show details | |

|
#32
S Camp Heights Dr
Sparta, TN 38583
|
1,050 sq. feet
|
1 baths - beds |
show details | |

|
#33
Wesley Chapel Rd
Sparta, TN 38583
|
800 sq. feet
|
1 baths - beds |
show details | |

|
#34
Ballard Ln
Sparta, TN 38583
|
1,533 sq. feet
|
1 baths - beds |
show details | |

|
#35
Bennett Rd
Sparta, TN 38583
|
984 sq. feet
|
1 baths - beds |
show details | |

|
#36
Miriah Dr
Mc Minnville, TN 37110
|
1,500 sq. feet
|
2 baths - beds |
show details | |

|
#37
Parker Rd
Sparta, TN 38583
|
1,296 sq. feet
|
1 baths - beds |
show details | |

|
#38
Forest Cir
Sparta, TN 38583
|
1,121 sq. feet
|
2 baths - beds |
show details | |

|
#39
Villa Dr
Mc Minnville, TN 37110
|
1,877 sq. feet
|
2 baths - beds |
show details | |

|
#40
Smith Hollow Rd
Mc Minnville, TN 37110
|
1,056 sq. feet
|
1 baths - beds |
show details |
| Photo | Address | Area | Beds / Baths | Price | Details |
|---|---|---|---|---|---|

|
#41
Beecher Mitchell Rd
Sparta, TN 38583
|
1,339 sq. feet
|
1 baths - beds |
show details | |

|
#42
Thomas St
Sparta, TN 38583
|
1,344 sq. feet
|
2 baths - beds |
show details | |

|
#43
Willow Run
Mc Minnville, TN 37110
|
1,161 sq. feet
|
2 baths - beds |
show details | |

|
#44
Meadowbrook Dr
Mc Minnville, TN 37110
|
1,257 sq. feet
|
1 baths - beds |
show details | |

|
#45
Shannon Ln
Mc Minnville, TN 37110
|
1,501 sq. feet
|
2 baths - beds |
show details | |

|
#46
Van Buren St
Mc Minnville, TN 37110
|
1,215 sq. feet
|
1 baths - beds |
show details | |

|
#47
Leesburg Rd
Mc Minnville, TN 37110
|
980 sq. feet
|
1 baths - beds |
show details | |

|
#48
Mount Leo Heights St
Mc Minnville, TN 37110
|
1,050 sq. feet
|
2 baths - beds |
show details | |

|
#49
Andy Hillis Rd
Mc Minnville, TN 37110
|
984 sq. feet
|
1 baths - beds |
show details | |

|
Check over 1 million property listings on Foreclosure.com!
|
browse all offers | |||

Household type by relationship:
Households: 39,259- In family households: 33,361 (7,733 male householders, 3,158 female householders)
8,050 spouses, 11,109 children (10,097 natural, 280 adopted, 732 stepchildren), 1,042 grandchildren, 328 brothers or sisters, 253 parents, foster children, 489 other relatives, 988 non-relatives
- In nonfamily households: 5,898 (2,343 male householders (1,903 living alone)), 2,616 female householders (2,375 living alone)), 939 nonrelatives
- In group quarters: 580 (479 institutionalized population)
6,276 married couples with children.
2,064 single-parent households (471 men, 1,593 women).
94.2% of residents of Campaign speak English at home.
4.8% of residents speak Spanish at home (16% speak English very well, 10% speak English well, 74% speak English not well).
0.9% of residents speak other Indo-European language at home (48% speak English very well, 23% speak English well, 29% speak English not well).
Foreign born population: 301 (7.2%)
(27.9% of them are naturalized citizens)
| Here: | 6.3 |
| State: | 6.5 |
| Here: | 4.9 |
| State: | 4.4 |

- Bedrooms in owner-occupied houses and condos in Campaign, Tennessee
- 0no bedroom
- 321 bedroom
- 2202 bedrooms
- 7773 bedrooms
- 1274 bedrooms
- 225+ bedrooms

- Bedrooms in renter-occupied apartments in Campaign, Tennessee
- 0no bedroom
- 231 bedroom
- 1012 bedrooms
- 713 bedrooms
- 84 bedrooms
- 05+ bedrooms

- Cars and other vehicles available in Campaign in owner-occupied houses/condos
- 46no vehicle
- 2231 vehicle
- 5812 vehicles
- 2203 vehicles
- 884 vehicles
- 205+ vehicles

- Cars and other vehicles available in Campaign in renter-occupied apartments
- 16no vehicle
- 531 vehicle
- 902 vehicles
- 313 vehicles
- 134 vehicles
- 05+ vehicles

- Rooms in owner-occupied houses in Campaign, Tennessee
- 01 room
- 02 rooms
- 373 rooms
- 1144 rooms
- 3425 rooms
- 3846 rooms
- 1567 rooms
- 1128 rooms
- 339+ rooms

- Rooms in renter-occupied apartments in Campaign, Tennessee
- 01 room
- 02 rooms
- 203 rooms
- 534 rooms
- 1015 rooms
- 156 rooms
- 67 rooms
- 88 rooms
- 09+ rooms


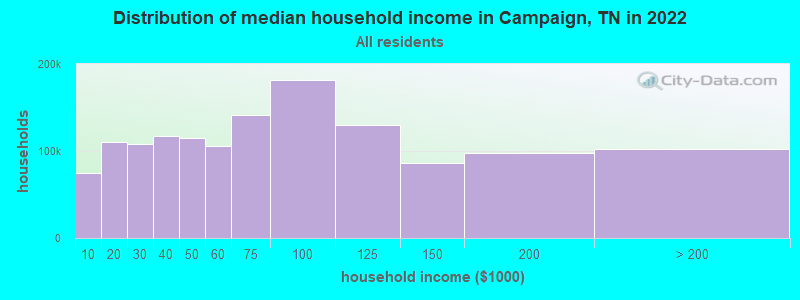
Campaign, TN household income distribution

- 49,338Less than $10,000
- 82,754$10,000 to $19,999
- 78,481$20,000 to $29,999
- 80,244$30,000 to $39,999
- 77,586$40,000 to $49,999
- 71,811$50,000 to $59,999
- 97,907$60,000 to $74,999
- 124,795$75,000 to $99,999
- 93,332$100,000 to $124,999
- 55,593$125,000 to $149,999
- 61,019$150,000 to $199,999
- 51,582$200,000 or more
Percentage of workers working in this county: 85.2%
Number of people working at home: 196 (9.8% of all workers)
Travel time to work (commute)
- Less than 5 minutes: 99
- 5 to 9 minutes: 165
- 10 to 14 minutes: 300
- 15 to 19 minutes: 379
- 20 to 24 minutes: 309
- 25 to 29 minutes: 81
- 30 to 34 minutes: 167
- 35 to 39 minutes: 44
- 40 to 44 minutes: 9
- 45 to 59 minutes: 55
- 60 to 89 minutes: 78
- 90 or more minutes: 50
Means of transportation to work:
- Drove a car alone: 1,373 (76.8%)
- Carpooled: 297 (16.6%)
- Streetcar or trolley car: 4 (0.2%)
- Motorcycle: 24 (1.3%)
- Walked: 17 (1.0%)
- Other means: 21 (1.2%)
- Worked at home: 52 (2.9%)


- Year of entry for the foreign-born population in Campaign, Tennessee
- 281995 to March 2000
- 461990 to 1994
- 241985 to 1989
- 01980 to 1984
- 301975 to 1979
- 01970 to 1974
- 91965 to 1969
- 10Before 1965
Most common places of birth for foreign-born residents (%):
| Campaign: | 83.7% (123) |
| Tennessee: | 28.1% (44,682) |
| Campaign: | 6.8% (10) |
| Tennessee: | 5.2% (8,316) |
| Campaign: | 6.1% (9) |
| Tennessee: | 3.6% (5,726) |
| Campaign: | 3.4% (5) |
| Tennessee: | 0.3% (423) |
Place of birth for U.S.-born residents:
- This state: 2,744
- Other state: 721
- Northeast: 55
- Midwest: 304
- South: 298
- West: 64
63% of Campaign residents lived in the same house 5 years ago.
Out of people who lived in different houses, 70% lived in this county.
Out of people who lived in different counties, 53% lived in Tennessee.
Education attainment for males 25 years and older:
- No schooling: 29
- Nursery to 4th grade: 14
- 5th and 6th grade: 47
- 7th and 8th grade: 116
- 9th grade: 64
- 10th grade: 74
- 11th grade: 90
- 12th grade, no diploma: 56
- High school graduate (or equivalency): 502
- Less than 1 year of college: 49
- Some college more than 1 year, no degree: 95
- Associate degree: 17
- Bachelor's degree: 41
- Master's degree: 6
- Professional school degree: 0
- Doctorate degree: 7

Education attainment for females 25 years and older:
- No schooling: 26
- Nursery to 4th grade: 19
- 5th and 6th grade: 20
- 7th and 8th grade: 107
- 9th grade: 55
- 10th grade: 93
- 11th grade: 63
- 12th grade, no diploma: 41
- High school graduate (or equivalency): 551
- Less than 1 year of college: 48
- Some college more than 1 year, no degree: 144
- Associate degree: 32
- Bachelor's degree: 38
- Master's degree: 0
- Professional school degree: 6
- Doctorate degree: 0


Housing units in structures:
- One, detached: 1,138
- One, attached: 15
- Two: 5
- 5 to 9: 8
- Mobile homes: 348
Median worth of mobile homes: $82,665
Housing units lacking complete kitchen facilities: 0.9%

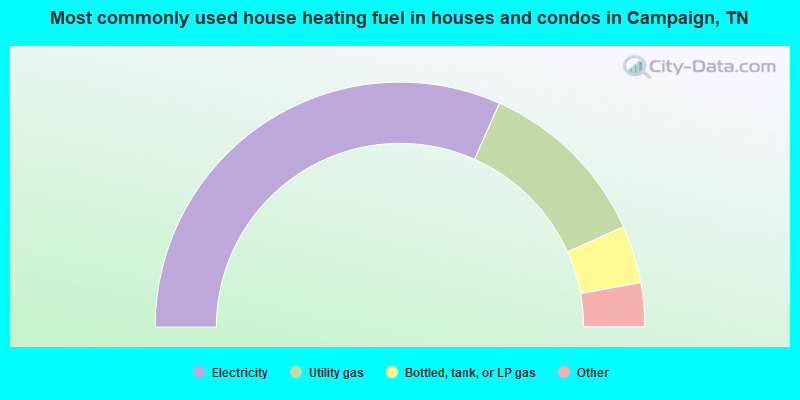
- 63.4%Electricity
- 23.3%Utility gas
- 7.6%Bottled, tank, or LP gas
- 3.3%Fuel oil, kerosene, etc.
- 2.5%Wood
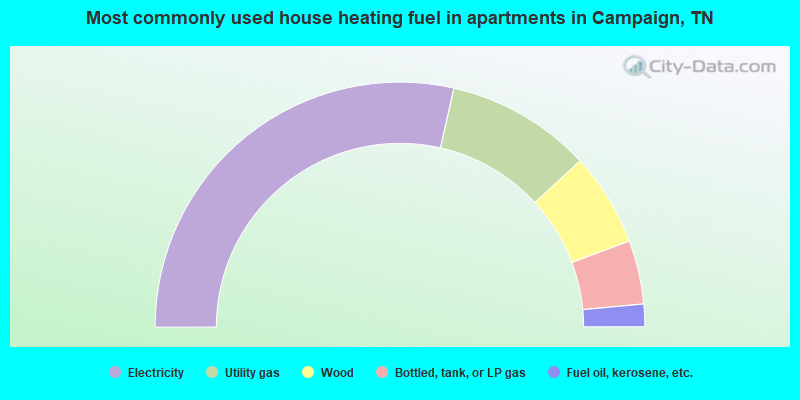
- 57.1%Electricity
- 19.2%Utility gas
- 12.3%Wood
- 8.4%Bottled, tank, or LP gas
- 3.0%Fuel oil, kerosene, etc.
Private vs. public school enrollment:
| Here: | 1.6% |
| Tennessee: | 9.5% |
| Here: | 6.0% |
| Tennessee: | 10.4% |
| Here: | 0.0% |
| Tennessee: | 22.8% |


