Butte-Silver Bow, MT (Montana) Houses and Residents
Estimated median house or condo value in 2022: $236,356 (it was $74,500 in 2000 )
Butte-Silver Bow:
$236,356Montana:
$366,400
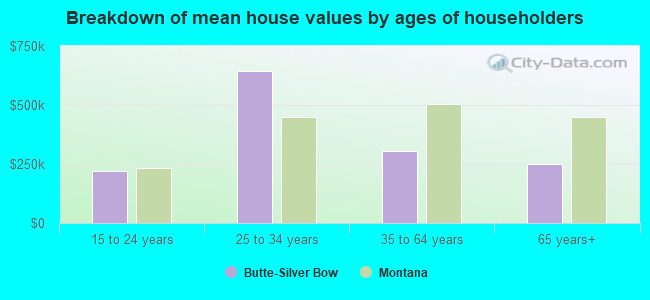
Lower value quartile - upper value quartile: $141,571 - $377,129Mean price in 2022: Detached houses: $333,471 Here:
$333,471State:
$518,333
Townhouses or other attached units: $256,645 Here:
$256,645State:
$468,033
In 2-unit structures: $65,628 Here:
$65,628State:
$254,784
In 5-or-more-unit structures: $464,771 Here:
$464,771State:
$373,935
Mobile homes: $71,493 Here:
$71,493State:
$139,111
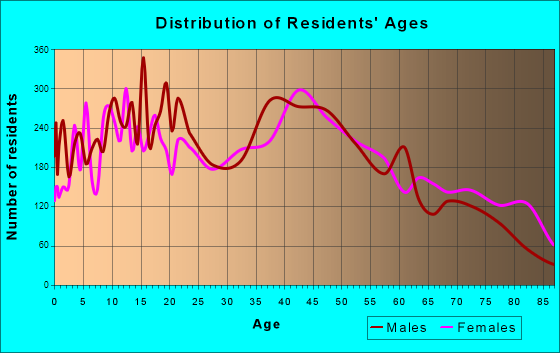
Total population: 33,980 (Urban population: 29,902 (all inside urban clusters), Rural population: 4,002 (244 farm, 3,758 nonfarm ))
Houses: 17,313 (15,110 occupied: 10,838 owner occupied, 4,607 renter occupied )
% of renters here:
30%State:
31%
Housing density: 24 houses/condos per square mile
Median price asked for vacant for-sale houses and condos in 2022: $155,601.
Median contract rent in 2022: $668 (lower quartile is $500, upper quartile is $935)
Median rent asked for vacant for-rent units in 2022: $1,405
Median gross rent in Butte-Silver Bow, MT in 2022: $811
Housing units in Butte-Silver Bow with a mortgage: 5,865 (529 second mortgage, 31 home equity loan, 367 both second mortgage and home equity loan )Houses without a mortgage: 187
Median household income for houses/condos with a mortgage: $78,191
Median household income for apartments without a mortgage: $58,541
Median monthly housing costs: $837
Data:
Median house or condo value ($)
Median house or condo value ($ change since 2000)
Median house or condo value ($) - White
Median house or condo value ($) - Black or African American
Median house or condo value ($) - Asian
Median house or condo value ($) - Hispanic or Latino
Median house or condo value ($) - American Indian and Alaska Native
Median house or condo value ($) - Multirace
Median house or condo value ($) - Other Race
Median price asked for mobile homes ($)
Household density (households per square mile)
Mean house or condo value by units in structure - 1, detached ($)
Mean house or condo value by units in structure - 1, attached ($)
Mean house or condo value by units in structure - 2 ($)
Mean house or condo value by units in structure by units in structure - 3 or 4 ($)
Mean house or condo value by units in structure - 5 or more ($)
Mean house or condo value by units in structure - Boat, RV, van, etc. ($)
Mean house or condo value by units in structure - Mobile home ($)
Median contract rent ($)
Median contract rent - Lower quartile ($)
Median contract rent - Upper quartile ($)
Median gross rent ($)
Urban houses (%)
Rural houses (%)
Houses occupied (%)
Houses occupied (% change since 2000)
Houses owner occupied (%)
Houses owner occupied (% change since 2000)
Houses renter occupied (%)
Houses renter occupied (% change since 2000)
Vacant housing units - For rent (%)
Vacant housing units - For rent (% change since 2000)
Vacant housing units - For sale only (%)
Vacant housing units - For sale only (% change since 2000)
Vacant housing units - Rented or sold, not occupied (%)
Vacant housing units - Rented or sold, not occupied (% change since 2000)
Vacant housing units - For seasonal, recreational, or occasional use (%)
Vacant housing units - For seasonal, recreational, or occasional use (% change since 2000)
Vacant housing units - For migrant workers (%)
Vacant housing units - For migrant workers (% change since 2000)
Vacant housing units - Other vacant (%)
Vacant housing units - Other vacant (% change since 2000)
Median monthly housing costs ($)
Median household income for houses/condos with a mortgage ($)
Median household income for houses/condos without a mortgage ($)
Median household income ($)
Median household income ($) - White
Median household income ($) - Black or African American
Median household income ($) - Asian
Median household income ($) - Hispanic or Latino
Median household income ($) - American Indian and Alaska Native
Median household income ($) - Multirace
Median household income ($) - Other Race
Mortgage status - with mortgage (%)
Mortgage status - with second mortgage (%)
Mortgage status - with home equity loan (%)
Mortgage status - with both second mortgage and home equity loan (%)
Mortgage status - without a mortgage (%)
Median year house/condo built
Median year apartment built
Household type by relationship - Male householder living alone (%)
Household type by relationship - Male householder not living alone (%)
Household type by relationship - Female householder living alone (%)
Household type by relationship - Female householder not living alone (%)
Household type by relationship - Opposite-Sex spouse (%)
Household type by relationship - Same-Sex spouse (%)
Household type by relationship - Opposite-Sex unmarried partner (%)
Household type by relationship - Same-Sex unmarried partner (%)
Household type by relationship - In group quarters (%)
Size of family households - 2-person household (%)
Size of family households - 3-person household (%)
Size of family households - 4-person household (%)
Size of family households - 5-person household (%)
Size of family households - 6-person household (%)
Size of family households - 7-or-more-person household (%)
Size of nonfamily households - 1-person household (%)
Size of nonfamily households - 2-person household (%)
Size of nonfamily households - 3-person household (%)
Size of nonfamily households - 4-person household (%)
Size of nonfamily households - 5-person household (%)
Size of nonfamily households - 6-person household (%)
Size of nonfamily households - 7-or-moreperson household (%)
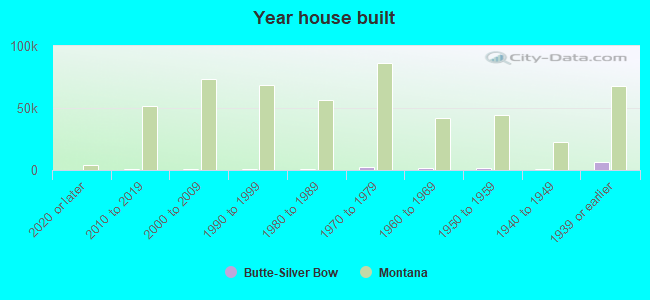
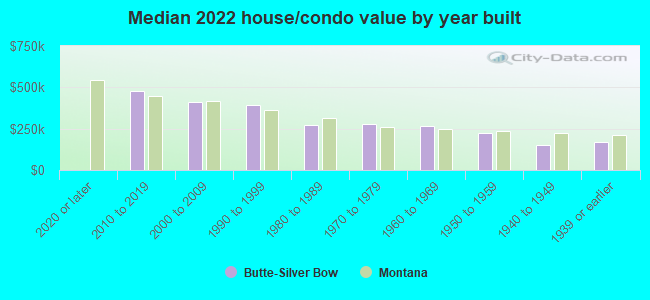
Year house built - Built 2010 or later (%)
Year house built - Built 2000 to 2009 (%)
Year house built - Built 1990 to 1999 (%)
Year house built - Built 1980 to 1989 (%)
Year house built - Built 1970 to 1979 (%)
Year house built - Built 1960 to 1969 (%)
Year house built - Built 1950 to 1959 (%)
Year house built - Built 1940 to 1949 (%)
Year house built - Built 1939 or earlier (%)
Median number of rooms in houses and condos
Median number of rooms in apartments
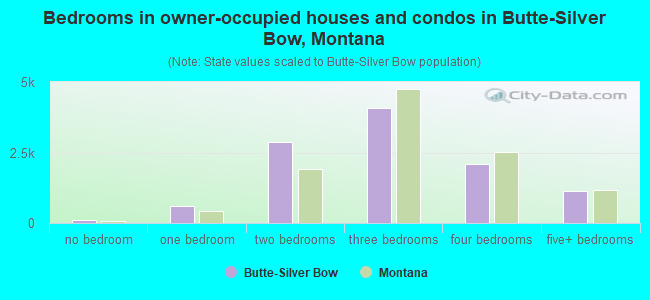
Median number of bedrooms in owner occupied houses
Mean number of bedrooms in owner occupied houses
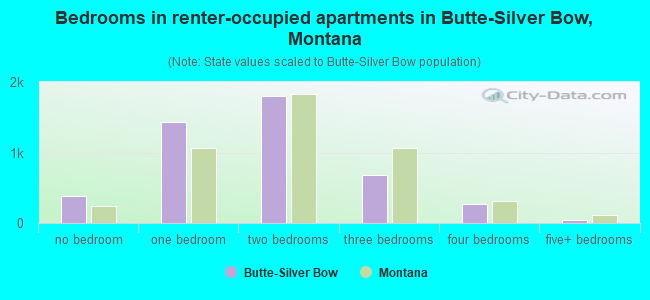
Median number of bedrooms in renter occupied houses
Mean number of bedrooms in renter occupied houses
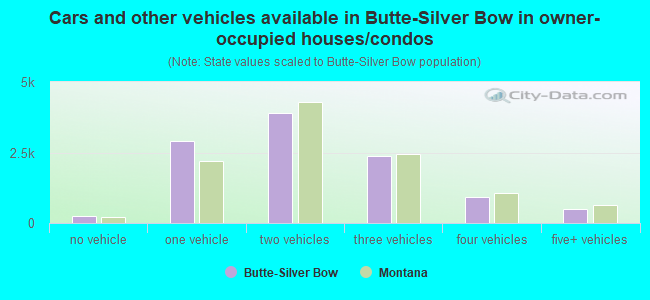
Median number of vehichles in owner occupied houses
Mean number of vehichles in owner occupied houses
Median number of vehichles in renter occupied houses
Mean number of vehichles in renter occupied houses
Rooms in owner-occupied houses - 1 room (%)
Rooms in owner-occupied houses - 2 rooms (%)
Rooms in owner-occupied houses - 3 rooms (%)
Rooms in owner-occupied houses - 4 rooms (%)
Rooms in owner-occupied houses - 5 rooms (%)
Rooms in owner-occupied houses - 6 rooms (%)
Rooms in owner-occupied houses - 7 rooms (%)
Rooms in owner-occupied houses - 8 rooms (%)
Rooms in owner-occupied houses - 9+ rooms (%)
Rooms in renter-occupied houses - 1 room (%)
Rooms in renter-occupied houses - 2 rooms (%)
Rooms in renter-occupied houses - 3 rooms (%)
Rooms in renter-occupied houses - 4 rooms (%)
Rooms in renter-occupied houses - 5 rooms (%)
Rooms in renter-occupied houses - 6 rooms (%)
Rooms in renter-occupied houses - 7 rooms (%)
Rooms in renter-occupied houses - 8 rooms (%)
Rooms in renter-occupied houses - 9+ rooms (%)
Bedrooms in owner-occupied houses - no bedrooms (%)
Bedrooms in owner-occupied houses - 1 bedroom (%)
Bedrooms in owner-occupied houses - 2 bedrooms (%)
Bedrooms in owner-occupied houses - 3 bedrooms (%)
Bedrooms in owner-occupied houses - 4 bedrooms (%)
Bedrooms in owner-occupied houses - 5+ bedrooms (%)
Bedrooms in renter-occupied houses - no bedrooms (%)
Bedrooms in renter-occupied houses - 1 bedroom (%)
Bedrooms in renter-occupied houses - 2 bedrooms (%)
Bedrooms in renter-occupied houses - 3 bedrooms (%)
Bedrooms in renter-occupied houses - 4 bedrooms (%)
Bedrooms in renter-occupied houses - 5+ bedrooms (%)
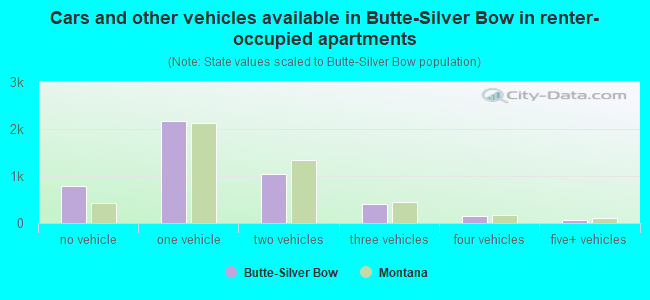
Vehicles available in owner-occupied houses - no vehicle available (%)
Vehicles available in owner-occupied houses - 1 vehicle available(%)
Vehicles available in owner-occupied houses - 2 Vehicles available (%)
Vehicles available in owner-occupied houses - 3 Vehicles available (%)
Vehicles available in owner-occupied houses - 4 Vehicles available (%)
Vehicles available in owner-occupied houses - 5+ Vehicles available (%)
Vehicles available in renter-occupied houses - no vehicle available (%)
Vehicles available in renter-occupied houses - 1 vehicle available (%)
Vehicles available in renter-occupied houses - 2 Vehicles available (%)
Vehicles available in renter-occupied houses - 3 Vehicles available (%)
Vehicles available in renter-occupied houses - 4 Vehicles available (%)
Vehicles available in renter-occupied houses - 5+ Vehicles available (%)
Housing units in structures - 1, detached (%)
Housing units in structures - 1, attached (%)
Housing units in structures - 2 (%)
Housing units in structures - 3 or 4 (%)
Housing units in structures - 5 to 9 (%)
Housing units in structures - 10 to 19 (%)
Housing units in structures - 20 to 49 (%)
Housing units in structures - 50 or more (%)
Housing units in structures - Mobile home (%)
Housing units in structures - Boat, RV, van, etc. (%)
Housing units in structures - Owners - 1, detached (%)
Housing units in structures - Owners - 1, attached (%)
Housing units in structures - Owners - 2 (%)
Housing units in structures - Owners - 3 or 4 (%)
Housing units in structures - Owners - 5 to 9 (%)
Housing units in structures - Owners - 10 to 19 (%)
Housing units in structures - Owners - 20 to 49 (%)
Housing units in structures - Owners - 50 or more (%)
Housing units in structures - Owners - Mobile home (%)
Housing units in structures - Owners - Boat, RV, van, etc. (%)
Housing units in structures - Renters - 1, detached (%)
Housing units in structures - Renters - 1, attached (%)
Housing units in structures - Renters - 2 (%)
Housing units in structures - Renters - 3 or 4 (%)
Housing units in structures - Renters - 5 to 9 (%)
Housing units in structures - Renters - 10 to 19 (%)
Housing units in structures - Renters - 20 to 49 (%)
Housing units in structures - Renters - 50 or more (%)
Housing units in structures - Renters - Mobile home (%)
Housing units in structures - Renters - Boat, RV, van, etc. (%)
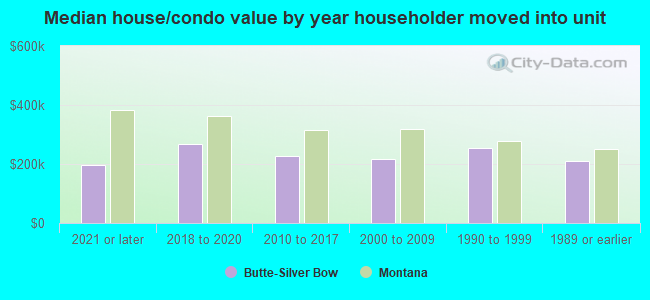
House/condo owner moved in on average (years ago)
Renter moved in on average (years ago)
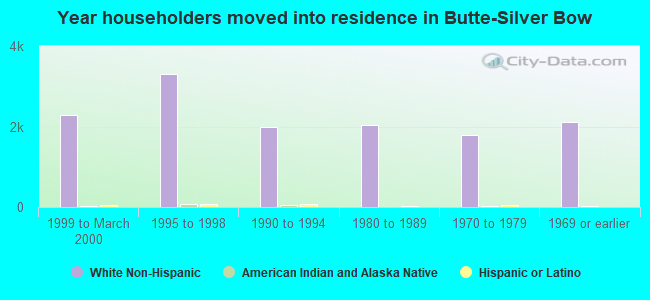
Year householder moved into unit - Moved in 1999 to March 2000 (%)
Year householder moved into unit - Moved in 1999 to March 2000 (%) - White
Year householder moved into unit - Moved in 1999 to March 2000 (%) - Black or African American
Year householder moved into unit - Moved in 1999 to March 2000 (%) - Asian
Year householder moved into unit - Moved in 1999 to March 2000 (%) - Hispanic or Latino
Year householder moved into unit - Moved in 1999 to March 2000 (%) - American Indian and Alaska Native
Year householder moved into unit - Moved in 1999 to March 2000 (%) - Multirace
Year householder moved into unit - Moved in 1999 to March 2000 (%) - Other Race
Year householder moved into unit - Moved in 1995 to 1998 (%)
Year householder moved into unit - Moved in 1995 to 1998 (%) - White
Year householder moved into unit - Moved in 1995 to 1998 (%) - Black or African American
Year householder moved into unit - Moved in 1995 to 1998 (%) - Asian
Year householder moved into unit - Moved in 1995 to 1998 (%) - Hispanic or Latino
Year householder moved into unit - Moved in 1995 to 1998 (%) - American Indian and Alaska Native
Year householder moved into unit - Moved in 1995 to 1998 (%) - Multirace
Year householder moved into unit - Moved in 1995 to 1998 (%) - Other Race
Year householder moved into unit - Moved in 1990 to 1994 (%)
Year householder moved into unit - Moved in 1990 to 1994 (%) - White
Year householder moved into unit - Moved in 1990 to 1994 (%) - Black or African American
Year householder moved into unit - Moved in 1990 to 1994 (%) - Asian
Year householder moved into unit - Moved in 1990 to 1994 (%) - Hispanic or Latino
Year householder moved into unit - Moved in 1990 to 1994 (%) - American Indian and Alaska Native
Year householder moved into unit - Moved in 1990 to 1994 (%) - Multirace
Year householder moved into unit - Moved in 1990 to 1994 (%) - Other Race
Year householder moved into unit - Moved in 1980 to 1989 (%)
Year householder moved into unit - Moved in 1980 to 1989 (%) - White
Year householder moved into unit - Moved in 1980 to 1989 (%) - Black or African American
Year householder moved into unit - Moved in 1980 to 1989 (%) - Asian
Year householder moved into unit - Moved in 1980 to 1989 (%) - Hispanic or Latino
Year householder moved into unit - Moved in 1980 to 1989 (%) - American Indian and Alaska Native
Year householder moved into unit - Moved in 1980 to 1989 (%) - Multirace
Year householder moved into unit - Moved in 1980 to 1989 (%) - Other Race
Year householder moved into unit - Moved in 1970 to 1979 (%)
Year householder moved into unit - Moved in 1970 to 1979 (%) - White
Year householder moved into unit - Moved in 1970 to 1979 (%) - Black or African American
Year householder moved into unit - Moved in 1970 to 1979 (%) - Asian
Year householder moved into unit - Moved in 1970 to 1979 (%) - Hispanic or Latino
Year householder moved into unit - Moved in 1970 to 1979 (%) - American Indian and Alaska Native
Year householder moved into unit - Moved in 1970 to 1979 (%) - Multirace
Year householder moved into unit - Moved in 1970 to 1979 (%) - Other Race
Year householder moved into unit - Moved in 1969 or earlier (%)
Year householder moved into unit - Moved in 1969 or earlier (%) - White
Year householder moved into unit - Moved in 1969 or earlier (%) - Black or African American
Year householder moved into unit - Moved in 1969 or earlier (%) - Asian
Year householder moved into unit - Moved in 1969 or earlier (%) - Hispanic or Latino
Year householder moved into unit - Moved in 1969 or earlier (%) - American Indian and Alaska Native
Year householder moved into unit - Moved in 1969 or earlier (%) - Multirace
Year householder moved into unit - Moved in 1969 or earlier (%) - Other Race
Housing units lacking complete plumbing facilities (%)
Housing units lacking complete kitchen facilities (%)
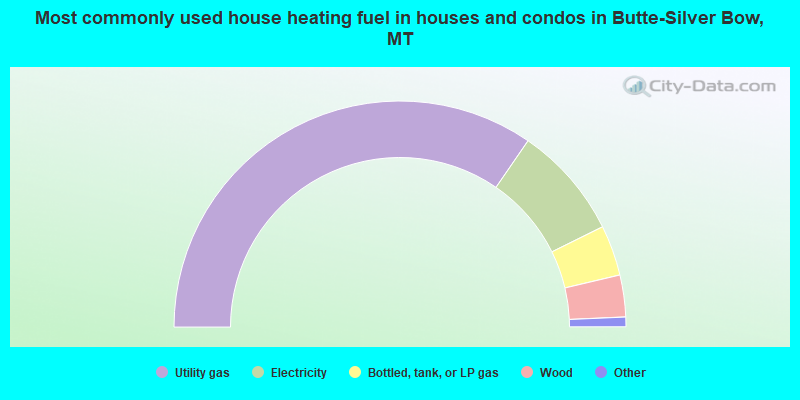
House heating fuel used in houses and condos - Utility gas (%)
House heating fuel used in houses and condos - Bottled, tank, or LP gas (%)
House heating fuel used in houses and condos - Electricity (%)
House heating fuel used in houses and condos - Fuel oil, kerosene, etc. (%)
House heating fuel used in houses and condos - Coal or coke (%)
House heating fuel used in houses and condos - Wood (%)
House heating fuel used in houses and condos - Solar energy (%)
House heating fuel used in houses and condos - Other fuel (%)
House heating fuel used in houses and condos - No fuel used (%)
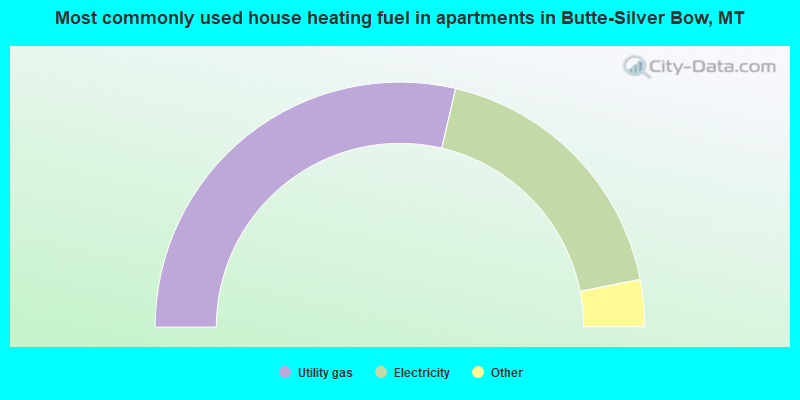
House heating fuel used in apartments - Utility gas (%)
House heating fuel used in apartments - Bottled, tank, or LP gas (%)
House heating fuel used in apartments - Electricity (%)
House heating fuel used in apartments - Fuel oil, kerosene, etc. (%)
House heating fuel used in apartments - Coal or coke (%)
House heating fuel used in apartments - Wood (%)
House heating fuel used in apartments - Solar energy (%)
House heating fuel used in apartments - Other fuel (%)
House heating fuel used in apartments - No fuel used (%)
Median year house/condo built: 1959Median year apartment built: 1955Household type by relationship:
Households: 35,622
Male householders: 7,549 (3,118 living alone ), Female householders: 7,645 (2,861 living alone )6,237 spouses (6,185 opposite-sex spouses ), 765 unmarried partners , (748 opposite-sex unmarried partners ), 9,355 children (8,616 natural , 287 adopted , 451 stepchildren ), 846 grandchildren , 123 brothers or sisters , 244 parents , 92 foster children , 198 other relatives , 1,213 non-relatives In group quarters: 1,350
Size of family households: 4,099 2-persons , 1,579 3-persons , 1,709 4-persons , 659 5-persons , 169 6-persons , 55 7-or-more-persons .
Size of nonfamily households: 5,989 1-person , 902 2-persons , 111 3-persons , 78 4-persons , 26 6-persons , 13 7-or-more-persons .
4,256 married couples with children. single-parent households (1,036 men , 1,004 women ).
96.9% of residents of Butte-Silver Bow speak English at home. of residents speak Spanish at home (9% speak English very well , 44% speak English well , 47% speak English not well ).of residents speak other Indo-European language at home (86% speak English very well , 14% speak English well ).of residents speak Asian or Pacific Island language at home (30% speak English very well , 12% speak English well , 58% speak English not well ).of residents speak other language at home (30% speak English very well , 70% speak English well ).
Foreign born population: 548 (1.5%)of them are naturalized citizens )
Median number of rooms in houses and condos:
Median number of rooms in apartments
Owner-occupied Renter-occupied
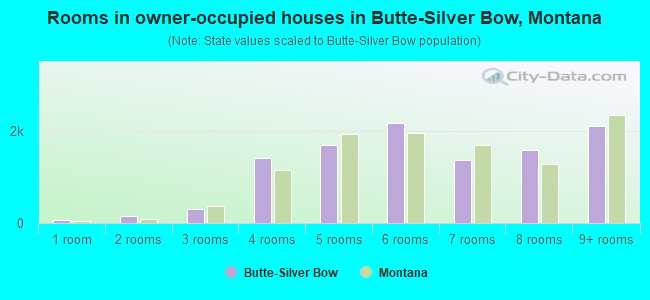
Rooms in owner-occupied houses in Butte-Silver Bow, Montana
70 1 room 161 2 rooms 313 3 rooms 1,403 4 rooms 1,694 5 rooms 2,166 6 rooms 1,360 7 rooms 1,579 8 rooms 2,094 9+ rooms
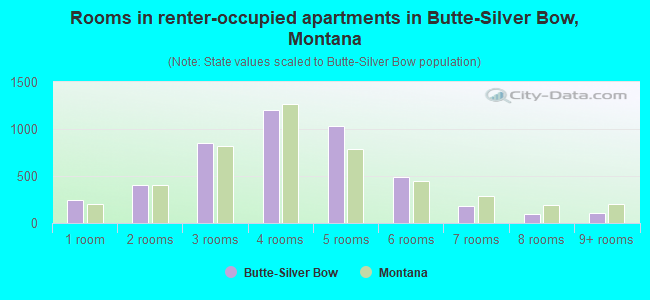
Rooms in renter-occupied apartments in Butte-Silver Bow, Montana
244 1 room 407 2 rooms 850 3 rooms 1,202 4 rooms 1,029 5 rooms 489 6 rooms 178 7 rooms 99 8 rooms 110 9+ rooms
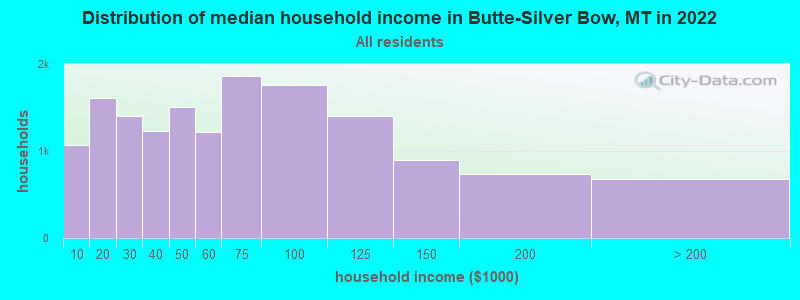
Butte-Silver Bow, MT household income distribution 1,073 Less than $10,0001,610 $10,000 to $19,9991,406 $20,000 to $29,9991,226 $30,000 to $39,9991,505 $40,000 to $49,9991,218 $50,000 to $59,9991,867 $60,000 to $74,9991,758 $75,000 to $99,9991,407 $100,000 to $124,999900 $125,000 to $149,999730 $150,000 to $199,999677 $200,000 or more
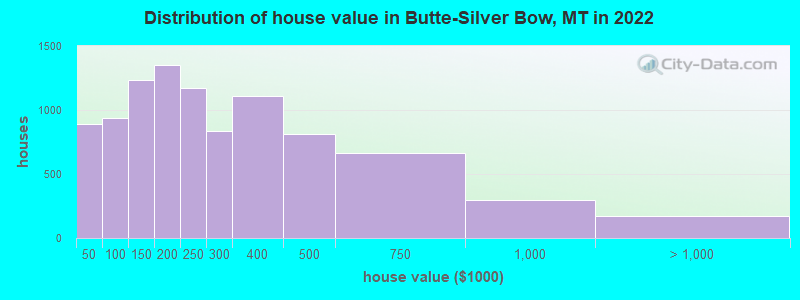
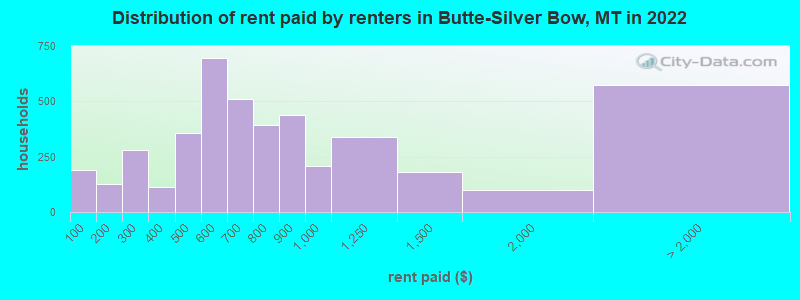
Home value of owner - occupied houses in 2022 in Butte-Silver Bow, MT 336 Less than $10,000151 $10,000 to $14,99937 $15,000 to $19,99926 $20,000 to $24,99933 $25,000 to $29,9994 $30,000 to $34,999207 $35,000 to $39,99991 $40,000 to $49,999175 $50,000 to $59,99958 $60,000 to $69,999152 $70,000 to $79,999247 $80,000 to $89,999207 $90,000 to $99,999702 $100,000 to $124,999534 $125,000 to $149,999931 $150,000 to $174,999421 $175,000 to $199,9991,169 $200,000 to $249,999834 $250,000 to $299,9991,106 $300,000 to $399,999815 $400,000 to $499,999666 $500,000 to $749,999298 $750,000 to $999,9997 $1,000,000 to $1,499,99914 $1,500,000 to $1,999,999151 $2,000,000 or moreRent paid by renters in 2022 in Butte-Silver Bow, MT 189 Less than $10020 $100 to $149106 $150 to $199130 $200 to $249148 $250 to $29981 $300 to $34930 $350 to $399239 $400 to $449116 $450 to $499321 $500 to $549372 $550 to $599286 $600 to $649226 $650 to $699182 $700 to $749210 $750 to $799436 $800 to $899206 $900 to $999338 $1,000 to $1,249179 $1,250 to $1,49997 $1,500 to $1,999117 $2,000 to $2,49913 $2,500 to $2,99931 $3,000 to $3,49959 $3,500 or more353 No cash rent
Percentage of workers working in this county: 89.6%Number of people working at home: 1,294 (7.7% of all workers )
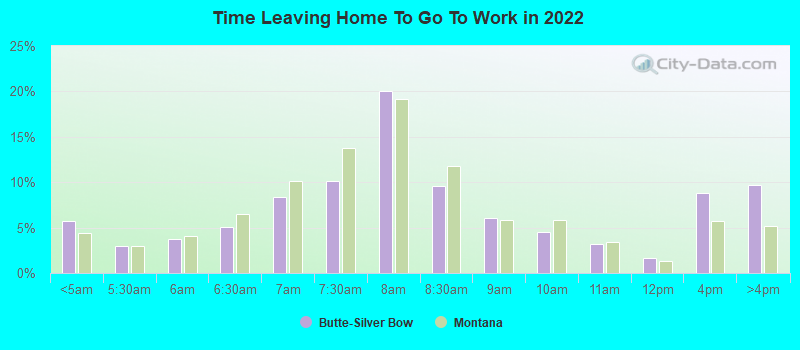
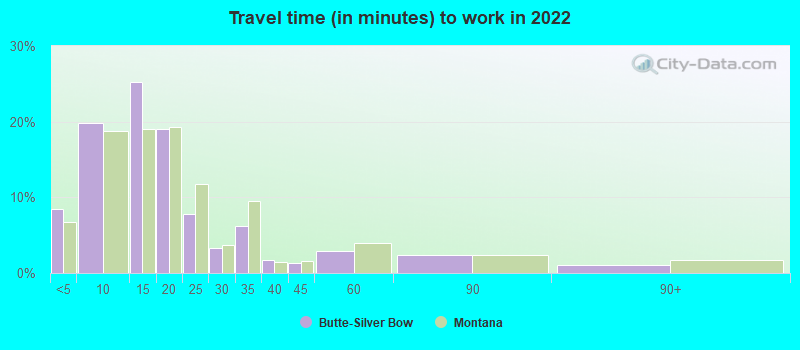
Travel time to work (commute)
Less than 5 minutes: 1,3365 to 9 minutes: 3,10810 to 14 minutes: 3,81615 to 19 minutes: 3,03220 to 24 minutes: 1,09425 to 29 minutes: 50830 to 34 minutes: 1,00335 to 39 minutes: 14940 to 44 minutes: 7545 to 59 minutes: 64660 to 89 minutes: 23490 or more minutes: 254
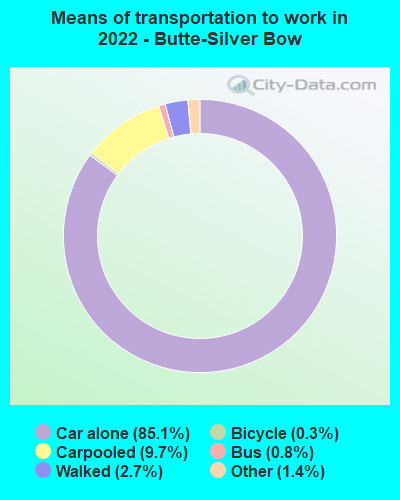
Means of transportation to work:
Drove a car alone: 13,197 (76.1%)Carpooled: 1,775 (10.2%)Bus : 102 (0.6%)Taxi: 281 (1.6%)Bicycle: 38 (0.2%)Walked: 468 (2.7%)Worked at home: 1,294 (7.5%)
Unemployment by race in 2022
Unemployment rate for White non-Hispanic residents 2.7% Males2.9% FemalesUnemployment rate for American Indian and Alaska Native residents 27.9% Males38.4% FemalesUnemployment rate for other race residents 37.2% FemalesUnemployment rate for two or more race residents 6.4% FemalesUnemployment rate for Hispanic or Latino residents 9.5% Females
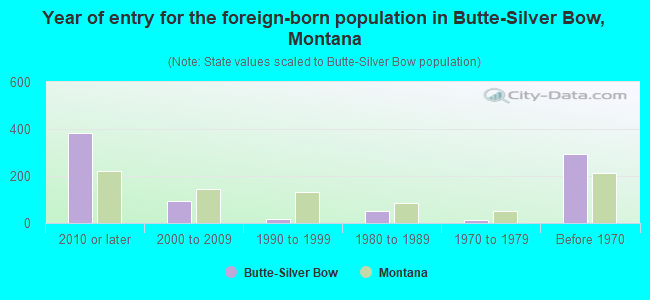
Year of entry for the foreign-born population in Butte-Silver Bow, Montana
381 2010 or later 92 2000 to 2009 15 1990 to 1999 51 1980 to 1989 13 1970 to 1979 293 Before 1970
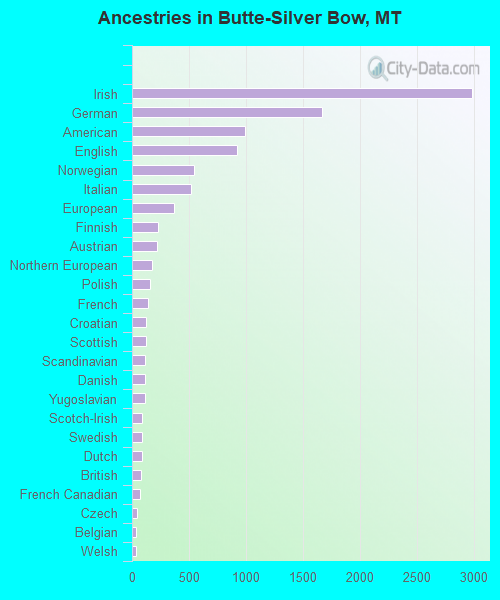
First ancestries reported:
Irish: 2,986 (22.9%)
German: 1,667 (12.8%)
American: 993 (7.6%)
English: 918 (7.0%)
Norwegian: 548 (4.2%)
Italian: 518 (4.0%)
European: 370 (2.8%)
Finnish: 226 (1.7%)
Austrian: 218 (1.7%)
Northern European: 179 (1.4%)
Polish: 162 (1.2%)
French: 138 (1.1%)
Croatian: 124 (1.0%)
Scottish: 122 (0.9%)
Scandinavian: 117 (0.9%)
Danish: 115 (0.9%)
Yugoslavian: 111 (0.9%)
Scotch-Irish: 92 (0.7%)
Swedish: 87 (0.7%)
Dutch: 86 (0.7%)
British: 79 (0.6%)
French Canadian: 67 (0.5%)
Czech: 47 (0.4%)
Belgian: 36 (0.3%)
Welsh: 35 (0.3%)
Slovene: 33 (0.3%)
Swiss: 33 (0.3%)
Canadian: 29 (0.2%)
Portuguese: 18 (0.1%)
Russian: 18 (0.1%)
Serbian: 18 (0.1%)
Armenian: 16 (0.1%)
Ukrainian: 16 (0.1%)
Slavic: 15 (0.1%)
Lebanese: 13 (0.10%)
German Russian: 11 (0.08%)
African: 11 (0.08%)
Slovak: 6 (0.05%)
Basque: 2 (0.02%)
Iranian: 2 (0.02%)
Hungarian: 1 (0.01%) Most common places of birth for foreign-born residents (%): Kuwait Butte-Silver Bow:
25.1% (132)Montana:
0.4% (110)
Saudi Arabia Butte-Silver Bow:
17.1% (90)Montana:
0.9% (231)
United Kingdom, excluding England and Scotland Butte-Silver Bow:
9.5% (50)Montana:
3.0% (738)
Philippines Butte-Silver Bow:
7.2% (38)Montana:
7.0% (1,735)
Mexico Butte-Silver Bow:
6.3% (33)Montana:
10.6% (2,608)
Thailand Butte-Silver Bow:
6.1% (32)Montana:
0.8% (189)
Canada Butte-Silver Bow:
5.9% (31)Montana:
14.2% (3,503)
Turkey Butte-Silver Bow:
5.3% (28)Montana:
0.7% (170)
Lebanon Butte-Silver Bow:
3.8% (20)Montana:
0.2% (61)
France Butte-Silver Bow:
3.4% (18)Montana:
0.8% (186)
Ghana Butte-Silver Bow:
2.5% (13)Montana:
0.2% (50)
Scotland Butte-Silver Bow:
1.7% (9)Montana:
0.6% (151)
Place of birth for U.S.-born residents:
This state: 24,088Other state: 10,307Northeast: 488Midwest: 2,743South: 1,867West: 5,254 86.8% of Butte-Silver Bow residents lived in the same house 1 years ago.
Out of people who lived in different houses, 31.3% lived in this county.
Out of people who lived in different counties, 60.8% lived in Montana.
Butte-Silver Bow:
86.8%State average:
86.7%
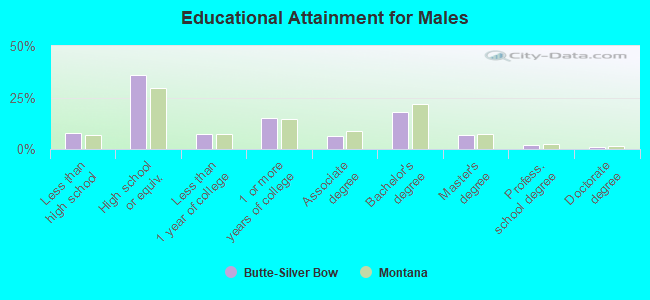
Education attainment for males 25 years and older:
No schooling: 116Nursery to 4th grade: 285th and 6th grade: 57th and 8th grade: 2249th grade: 17710th grade: 11811th grade: 10012th grade, no diploma: 173High school graduate (or equivalency): 4,498Less than 1 year of college: 896Some college more than 1 year, no degree: 1,871Associate degree: 787Bachelor's degree: 2,268Master's degree: 866Professional school degree: 216Doctorate degree: 117
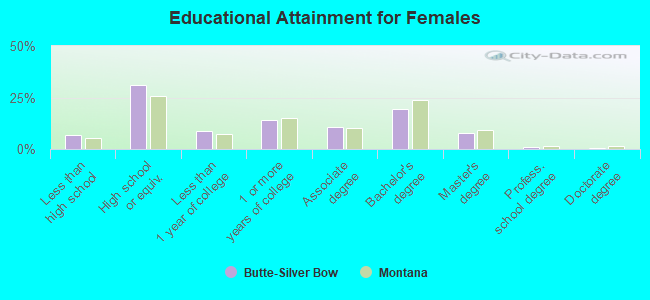
Education attainment for females 25 years and older:
No schooling: 136Nursery to 4th grade: 05th and 6th grade: 1047th and 8th grade: 1619th grade: 8110th grade: 5511th grade: 15212th grade, no diploma: 143High school graduate (or equivalency): 3,786Less than 1 year of college: 1,043Some college more than 1 year, no degree: 1,756Associate degree: 1,317Bachelor's degree: 2,392Master's degree: 953Professional school degree: 96Doctorate degree: 85
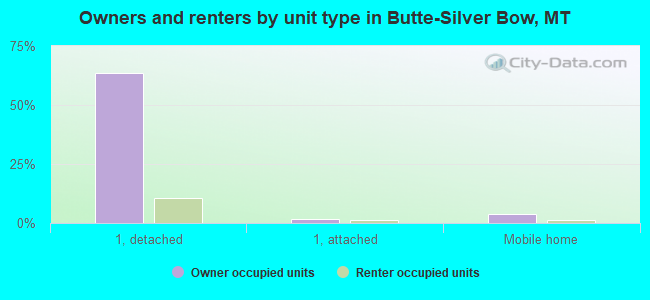
Housing units in structures:
One, detached: 12,530One, attached: 419Two: 4933 or 4: 1,0075 to 9: 27910 to 19: 35520 to 49: 54650 or more: 728Mobile homes: 952Housing units lacking complete plumbing facilities in 2022: 1.5%Housing units lacking complete kitchen facilities in 2022: 2.6%House/condo owner moved in on average 15 years ago
Renter moved in on average 4 years ago
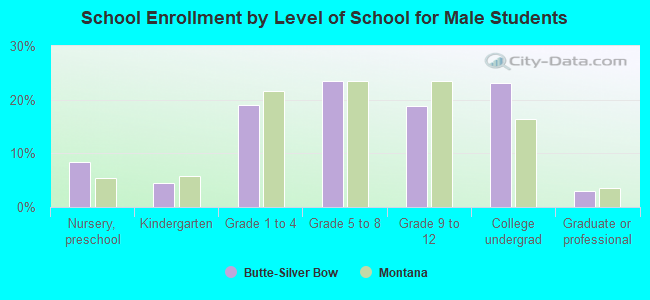
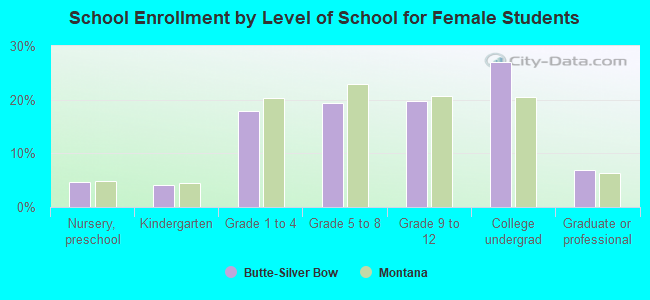
Private vs. public school enrollment:
Students in private schools in grades 1 to 8 (elementary and middle school): 299 Students in private schools in grades 9 to 12 (high school): 189 Students in private undergraduate colleges: 109