Butler, TN (Tennessee) Houses and Residents
| Butler: | $179,076 |
| Tennessee: | $284,800 |
Total population: 3,977 (Urban population: 0, Rural population: 3,935 (122 farm, 3,813 nonfarm))
Houses: 1,199 (1,057 occupied: 893 owner occupied, 164 renter occupied)
| % of renters here: | 16% |
| State: | 33% |
Housing density: 24 houses/condos per square mile
Median price asked for vacant for-sale houses and condos in 2022 in this county: $281,470.
Median contract rent in 2022: $539 (lower quartile is $452, upper quartile is $642)
Median rent asked for vacant for-rent units in 2022: $571
Median gross rent in Butler, TN in 2022: $856
Housing units in Butler with a mortgage: 137 (0 second mortgage, 7 home equity loan, 0 both second mortgage and home equity loan)
Houses without a mortgage: 219


Household type by relationship:
Households: 16,417- In family households: 13,669 (3,456 male householders, 1,324 female householders)
3,627 spouses, 3,930 children (3,528 natural, 135 adopted, 267 stepchildren), 476 grandchildren, 109 brothers or sisters, 129 parents, foster children, 177 other relatives, 343 non-relatives
- In nonfamily households: 2,748 (1,163 male householders (992 living alone)), 1,252 female householders (1,143 living alone)), 333 nonrelatives
- In group quarters: 1,827 (1,816 institutionalized population)
2,263 married couples with children.
736 single-parent households (198 men, 538 women).
97.8% of residents of Butler speak English at home.
1.3% of residents speak Spanish at home (55% speak English very well, 45% speak English well).
0.5% of residents speak other Indo-European language at home (100% speak English very well).
0.4% of residents speak Asian or Pacific Island language at home (100% speak English well).
Foreign born population: 59 (1.3%)
(59.3% of them are naturalized citizens)
| Here: | 6.3 |
| State: | 6.5 |
| Here: | 4.9 |
| State: | 4.4 |

- Bedrooms in owner-occupied houses and condos in Butler, Tennessee
- 6no bedroom
- 481 bedroom
- 2602 bedrooms
- 4603 bedrooms
- 994 bedrooms
- 205+ bedrooms

- Bedrooms in renter-occupied apartments in Butler, Tennessee
- 0no bedroom
- 331 bedroom
- 482 bedrooms
- 753 bedrooms
- 44 bedrooms
- 45+ bedrooms

- Cars and other vehicles available in Butler in owner-occupied houses/condos
- 41no vehicle
- 2231 vehicle
- 3982 vehicles
- 1693 vehicles
- 424 vehicles
- 205+ vehicles

- Cars and other vehicles available in Butler in renter-occupied apartments
- 9no vehicle
- 591 vehicle
- 592 vehicles
- 313 vehicles
- 64 vehicles
- 05+ vehicles

- Rooms in owner-occupied houses in Butler, Tennessee
- 61 room
- 72 rooms
- 243 rooms
- 1974 rooms
- 2725 rooms
- 1826 rooms
- 907 rooms
- 838 rooms
- 329+ rooms

- Rooms in renter-occupied apartments in Butler, Tennessee
- 01 room
- 152 rooms
- 143 rooms
- 424 rooms
- 525 rooms
- 166 rooms
- 217 rooms
- 08 rooms
- 49+ rooms


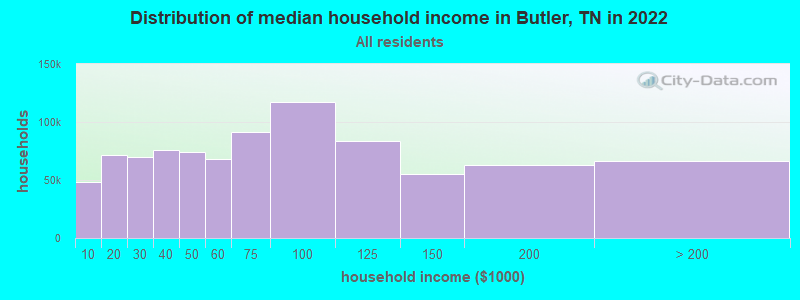
Butler, TN household income distribution

- 31,819Less than $10,000
- 53,369$10,000 to $19,999
- 50,614$20,000 to $29,999
- 51,750$30,000 to $39,999
- 50,036$40,000 to $49,999
- 46,312$50,000 to $59,999
- 63,142$60,000 to $74,999
- 80,481$75,000 to $99,999
- 60,191$100,000 to $124,999
- 35,853$125,000 to $149,999
- 39,352$150,000 to $199,999
- 33,266$200,000 or more
Percentage of workers working in this county: 63.1%
Number of people working at home: 117 (9.8% of all workers)
Travel time to work (commute)
- Less than 5 minutes: 27
- 5 to 9 minutes: 92
- 10 to 14 minutes: 86
- 15 to 19 minutes: 169
- 20 to 24 minutes: 134
- 25 to 29 minutes: 51
- 30 to 34 minutes: 117
- 35 to 39 minutes: 6
- 40 to 44 minutes: 13
- 45 to 59 minutes: 95
- 60 to 89 minutes: 155
- 90 or more minutes: 77
Means of transportation to work:
- Drove a car alone: 759 (71.1%)
- Carpooled: 251 (23.5%)
- Walked: 12 (1.1%)
- Worked at home: 45 (4.2%)


- Year of entry for the foreign-born population in Butler, Tennessee
- 01995 to March 2000
- 71990 to 1994
- 01985 to 1989
- 01980 to 1984
- 01975 to 1979
- 141970 to 1974
- 01965 to 1969
- 8Before 1965
Most common places of birth for foreign-born residents (%):
| Butler: | 51.7% (15) |
| Tennessee: | 28.1% (44,682) |
| Butler: | 48.3% (14) |
| Tennessee: | 2.6% (4,078) |
Place of birth for U.S.-born residents:
- This state: 2,427
- Other state: 1,451
- Northeast: 227
- Midwest: 184
- South: 1,034
- West: 6
59% of Butler residents lived in the same house 5 years ago.
Out of people who lived in different houses, 33% lived in this county.
Out of people who lived in different counties, 69% lived in Tennessee.
Education attainment for males 25 years and older:
- No schooling: 205
- Nursery to 4th grade: 18
- 5th and 6th grade: 41
- 7th and 8th grade: 269
- 9th grade: 86
- 10th grade: 71
- 11th grade: 169
- 12th grade, no diploma: 143
- High school graduate (or equivalency): 593
- Less than 1 year of college: 210
- Some college more than 1 year, no degree: 79
- Associate degree: 120
- Bachelor's degree: 30
- Master's degree: 4
- Professional school degree: 7
- Doctorate degree: 0

Education attainment for females 25 years and older:
- No schooling: 13
- Nursery to 4th grade: 20
- 5th and 6th grade: 31
- 7th and 8th grade: 86
- 9th grade: 44
- 10th grade: 79
- 11th grade: 55
- 12th grade, no diploma: 9
- High school graduate (or equivalency): 362
- Less than 1 year of college: 59
- Some college more than 1 year, no degree: 64
- Associate degree: 34
- Bachelor's degree: 27
- Master's degree: 11
- Professional school degree: 0
- Doctorate degree: 0


Housing units in structures:
- One, detached: 698
- One, attached: 5
- Two: 19
- 3 or 4: 18
- Mobile homes: 442
- Boats, RVs, vans, etc.: 17
Median worth of mobile homes: $61,360
Housing units lacking complete kitchen facilities: 1.8%

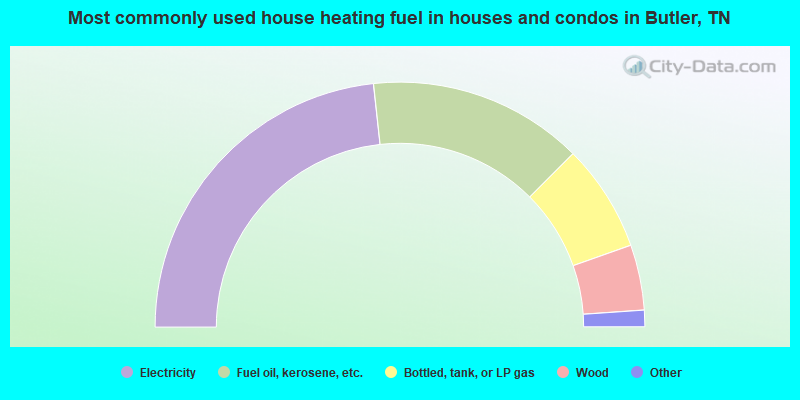
- 46.5%Electricity
- 28.4%Fuel oil, kerosene, etc.
- 14.2%Bottled, tank, or LP gas
- 8.6%Wood
- 1.6%Coal or coke
- 0.7%Utility gas
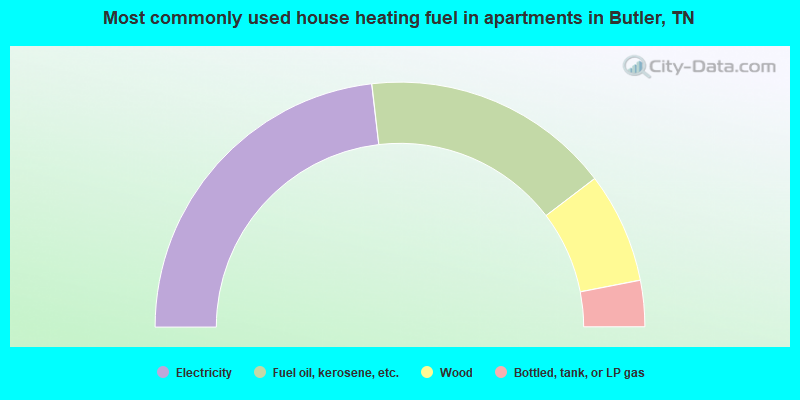
- 46.3%Electricity
- 32.9%Fuel oil, kerosene, etc.
- 14.6%Wood
- 6.1%Bottled, tank, or LP gas
Private vs. public school enrollment:
| Here: | 0.0% |
| Tennessee: | 9.5% |
| Here: | 24.4% |
| Tennessee: | 10.4% |
| Here: | 14.8% |
| Tennessee: | 22.8% |


