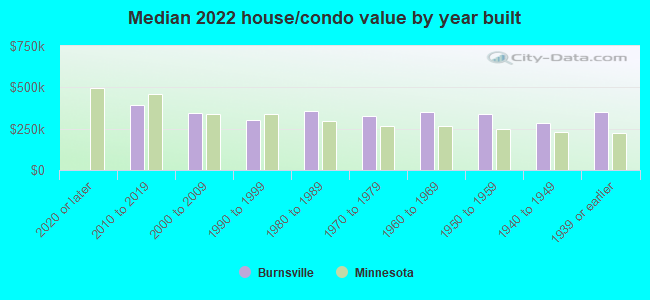
Burnsville, MN (Minnesota) Houses and Residents
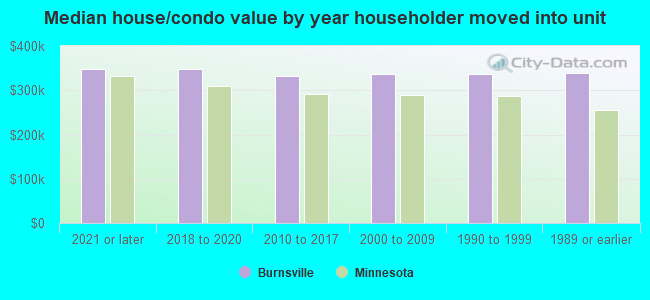
| Burnsville: | $337,629 |
| Minnesota: | $314,600 |
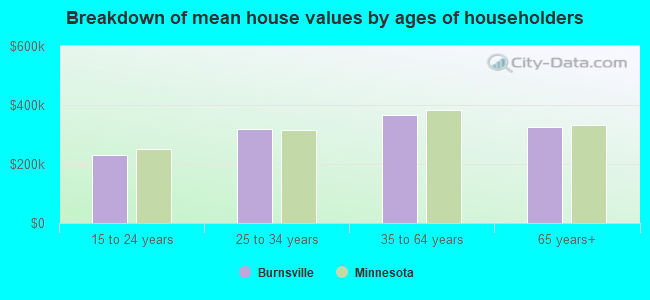
Mean price in 2022:
Detached houses: $404,025
Here: $404,025 State: $374,552 Townhouses or other attached units: $248,549
Here: $248,549 State: $312,049 In 2-unit structures: $207,726
Here: $207,726 State: $323,045 In 3-to-4-unit structures: $299,422
Here: $299,422 State: $238,971 In 5-or-more-unit structures: $151,655
Here: $151,655 State: $258,516 Mobile homes: $29,685
Here: $29,685 State: $94,605
Total population: 61,630 (Urban population: 60,002, Rural population: 146 (all nonfarm))
Houses: 26,942 (26,113 occupied: 17,889 owner occupied, 8,327 renter occupied)
| % of renters here: | 32% |
| State: | 28% |
Housing density: 1,083 houses/condos per square mile
Median price asked for vacant for-sale houses and condos in 2022: $341,236.
Median contract rent in 2022: $1,377 (lower quartile is $1,140, upper quartile is $1,652)
Median rent asked for vacant for-rent units in 2022: $620
Median gross rent in Burnsville, MN in 2022: $1,492
Housing units in Burnsville with a mortgage: 11,714 (1,489 second mortgage, 43 home equity loan, 1,195 both second mortgage and home equity loan)
Houses without a mortgage: 189
Median household income for houses/condos with a mortgage: $116,714
Median household income for apartments without a mortgage: $73,787
Median monthly housing costs: $1,482
Compare current foreclosures in Burnsville, MN:
| Photo | Address | Area | Beds / Baths | Price | Details |
|---|---|---|---|---|---|

|
#1
Maple Island Rd
Burnsville, MN 55306
|
1,302 sq. feet
|
2 baths 2 beds |
$309,900
|
show details |

|
#2
Hemlock Dr
Burnsville, MN 55337
|
1,594 sq. feet
|
2 baths 3 beds |
show details | |

|
#3
Shirley Dr
Burnsville, MN 55337
|
1,044 sq. feet
|
2 baths 4 beds |
show details | |

|
#4
Walden St
Burnsville, MN 55337
|
1,680 sq. feet
|
3 baths 3 beds |
show details | |

|
#5
Nicollet Ave Apt 201
Burnsville, MN 55337
|
950 sq. feet
|
1 baths 2 beds |
show details | |

|
#6
Walden St
Burnsville, MN 55337
|
1,704 sq. feet
|
2 baths 3 beds |
show details | |

|
#7
E 145th St
Burnsville, MN 55337
|
- sq. feet
|
2 baths 3 beds |
show details | |

|
#8
Radisson Dr
Burnsville, MN 55337
|
- sq. feet
|
2 baths 4 beds |
show details | |

|
#9
Heritage Cir S
Burnsville, MN 55337
|
- sq. feet
|
3 baths 4 beds |
show details | |

|
#10
Thomas Ave S
Burnsville, MN 55337
|
- sq. feet
|
2 baths 5 beds |
show details |
| Photo | Address | Area | Beds / Baths | Price | Details |
|---|---|---|---|---|---|

|
#11
Rainier Cir
Burnsville, MN 55337
|
- sq. feet
|
3 baths 4 beds |
show details | |

|
#12
Xerxes Ave S
Burnsville, MN 55337
|
- sq. feet
|
2 baths 4 beds |
show details | |

|
#13
Circle Ln
Burnsville, MN 55337
|
- sq. feet
|
3 baths 5 beds |
show details | |

|
#14
Maywood Dr
Burnsville, MN 55306
|
- sq. feet
|
3 baths 4 beds |
show details | |

|
#15
W 158th St
Burnsville, MN 55306
|
- sq. feet
|
2 baths 4 beds |
show details | |

|
#16
Walden St
Burnsville, MN 55337
|
- sq. feet
|
1 baths 3 beds |
show details | |

|
#17
E 143rd St
Burnsville, MN 55337
|
- sq. feet
|
2 baths 2 beds |
show details | |

|
#18
Court Pl
Burnsville, MN 55337
|
- sq. feet
|
2 baths 2 beds |
show details | |

|
#19
River Woods Ln
Burnsville, MN 55337
|
- sq. feet
|
1 baths 3 beds |
show details | |

|
#20
W 140th St
Burnsville, MN 55337
|
- sq. feet
|
2 baths 3 beds |
show details |
| Photo | Address | Area | Beds / Baths | Price | Details |
|---|---|---|---|---|---|

|
#21
Portland Ave
Burnsville, MN 55337
|
- sq. feet
|
2 baths 2 beds |
show details | |

|
#22
E 125th St
Burnsville, MN 55337
|
- sq. feet
|
2 baths 3 beds |
show details | |

|
#23
Brookview Dr
Burnsville, MN 55337
|
- sq. feet
|
2 baths 3 beds |
show details | |

|
#24
Southwind Dr
Burnsville, MN 55306
|
- sq. feet
|
2 baths 4 beds |
show details | |

|
#25
River Woods Ln
Burnsville, MN 55337
|
- sq. feet
|
2 baths 3 beds |
show details | |

|
#26
E 143rd St
Burnsville, MN 55337
|
- sq. feet
|
2 baths 2 beds |
show details | |

|
#27
E Burnsville Pkwy # A406
Burnsville, MN 55337
|
- sq. feet
|
2 baths 2 beds |
show details | |

|
#28
Barbara Ln
Burnsville, MN 55337
|
- sq. feet
|
2 baths 3 beds |
show details | |

|
#29
Earle Way
Burnsville, MN 55306
|
- sq. feet
|
4 baths 5 beds |
show details | |

|
#30
River Woods Ln
Burnsville, MN 55337
|
- sq. feet
|
3 baths 3 beds |
show details |
| Photo | Address | Area | Beds / Baths | Price | Details |
|---|---|---|---|---|---|

|
#31
Circle High Dr
Burnsville, MN 55306
|
- sq. feet
|
2 baths 3 beds |
show details | |

|
#32
Judicial Rd
Burnsville, MN 55337
|
- sq. feet
|
2 baths 3 beds |
show details | |

|
#33
E 117th St
Burnsville, MN 55337
|
- sq. feet
|
1 baths 2 beds |
show details | |

|
#34
Humboldt Ave S
Burnsville, MN 55337
|
- sq. feet
|
2 baths 3 beds |
show details | |

|
#35
Scout Cir
Burnsville, MN 55337
|
- sq. feet
|
2 baths 4 beds |
show details | |

|
#36
W 140th St
Burnsville, MN 55337
|
- sq. feet
|
2 baths 2 beds |
show details | |

|
#37
Portland Ave
Burnsville, MN 55337
|
- sq. feet
|
2 baths 2 beds |
show details | |

|
#38
Kennelly Pl
Burnsville, MN 55337
|
- sq. feet
|
2 baths 3 beds |
show details | |

|
#39
E 131st St
Burnsville, MN 55337
|
- sq. feet
|
3 baths 4 beds |
show details | |

|
#40
E 143rd St
Burnsville, MN 55337
|
- sq. feet
|
2 baths 3 beds |
show details |
| Photo | Address | Area | Beds / Baths | Price | Details |
|---|---|---|---|---|---|

|
#41
Aspen Grove Ln
Burnsville, MN 55337
|
- sq. feet
|
2 baths 2 beds |
show details | |

|
#42
W Manor Blvd
Burnsville, MN 55337
|
- sq. feet
|
2 baths 4 beds |
show details | |

|
#43
Skyline Dr S
Burnsville, MN 55337
|
- sq. feet
|
2 baths 4 beds |
show details | |

|
#44
Boulder Way
Burnsville, MN 55337
|
- sq. feet
|
3 baths 3 beds |
show details | |

|
#45
E Burnsville Pkwy Apt 117
Burnsville, MN 55337
|
- sq. feet
|
2 baths 2 beds |
show details | |

|
#46
E 145th St
Burnsville, MN 55337
|
- sq. feet
|
2 baths 3 beds |
show details | |

|
#47
Krestwood Dr
Burnsville, MN 55337
|
- sq. feet
|
3 baths 4 beds |
show details | |

|
#48
Woods Trl S
Burnsville, MN 55306
|
- sq. feet
|
2 baths 4 beds |
show details | |

|
#49
Foxpoint Rd
Burnsville, MN 55337
|
- sq. feet
|
3 baths 4 beds |
show details | |

|
Check over 1 million property listings on Foreclosure.com!
|
browse all offers | |||

Latest news about housing in Burnsville, MN collected exclusively by city-data.com from local newspapers, TV, and radio stations


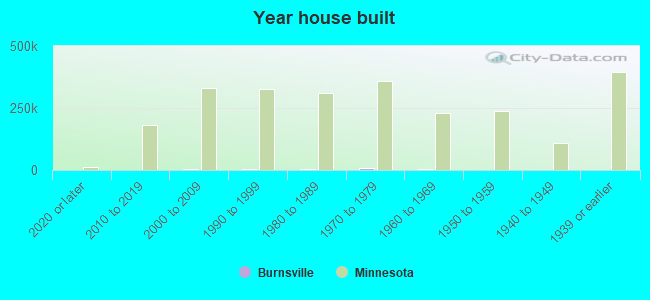
Median year apartment built: 1987
Household type by relationship:
Households: 64,682- Male householders: 12,875 (3,510 living alone), Female householders: 12,723 (3,859 living alone)
12,630 spouses (12,333 opposite-sex spouses), 2,394 unmarried partners, (2,367 opposite-sex unmarried partners), 17,993 children (16,783 natural, 488 adopted, 721 stepchildren), 1,188 grandchildren, 670 brothers or sisters, 887 parents, 39 foster children, 1,202 other relatives, 1,575 non-relatives
- In group quarters: 500
Size of family households: 8,041 2-persons, 3,430 3-persons, 2,955 4-persons, 1,157 5-persons, 631 6-persons, 303 7-or-more-persons.
Size of nonfamily households: 7,404 1-person, 2,202 2-persons, 211 3-persons, 4 5-persons.
9,530 married couples with children.
2,683 single-parent households (497 men, 2,186 women).
79.4% of residents of Burnsville speak English at home.
8.9% of residents speak Spanish at home (41% speak English very well, 25% speak English well, 24% speak English not well, 9% don't speak English at all).
2.7% of residents speak other Indo-European language at home (64% speak English very well, 30% speak English well, 2% speak English not well, 4% don't speak English at all).
3.5% of residents speak Asian or Pacific Island language at home (60% speak English very well, 22% speak English well, 17% speak English not well, 1% don't speak English at all).
6.7% of residents speak other language at home (61% speak English very well, 23% speak English well, 15% speak English not well).
Foreign born population: 9,723 (15.0%)
(63.0% of them are naturalized citizens)
| Here: | 7.5 |
| State: | 7.1 |
| Here: | 3.7 |
| State: | 3.8 |
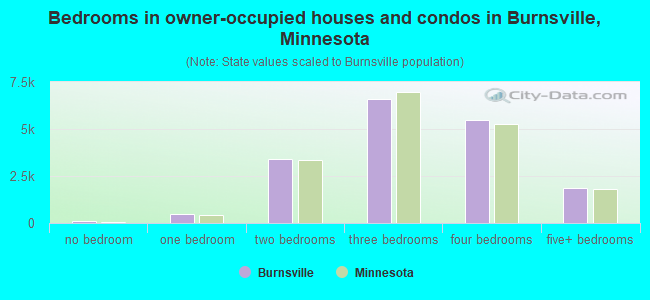
- Bedrooms in owner-occupied houses and condos in Burnsville, Minnesota
- 83no bedroom
- 4771 bedroom
- 3,3802 bedrooms
- 6,6213 bedrooms
- 5,4594 bedrooms
- 1,8715+ bedrooms
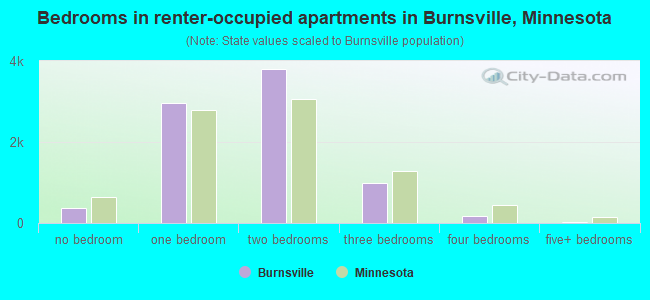
- Bedrooms in renter-occupied apartments in Burnsville, Minnesota
- 374no bedroom
- 2,9751 bedroom
- 3,8032 bedrooms
- 9773 bedrooms
- 1634 bedrooms
- 355+ bedrooms

- Cars and other vehicles available in Burnsville in owner-occupied houses/condos
- 269no vehicle
- 5,0481 vehicle
- 8,2562 vehicles
- 3,1703 vehicles
- 7944 vehicles
- 3535+ vehicles
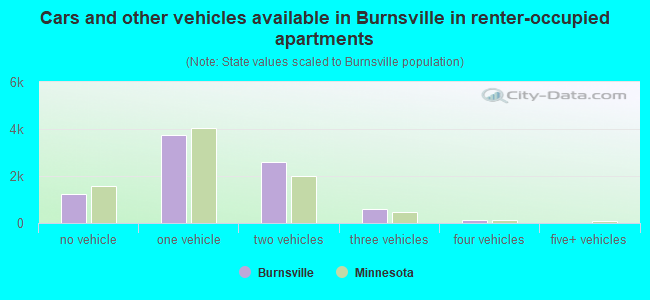
- Cars and other vehicles available in Burnsville in renter-occupied apartments
- 1,247no vehicle
- 3,7571 vehicle
- 2,5802 vehicles
- 6063 vehicles
- 1384 vehicles
- 05+ vehicles
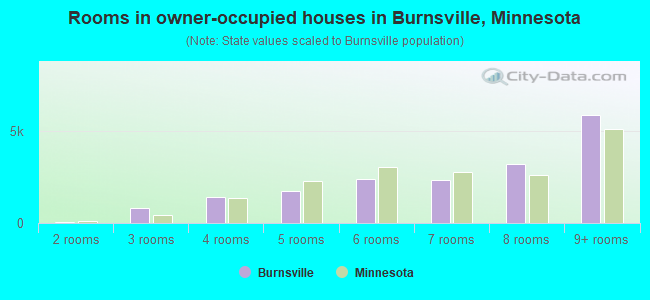
- Rooms in owner-occupied houses in Burnsville, Minnesota
- 331 room
- 702 rooms
- 7913 rooms
- 1,4354 rooms
- 1,7465 rooms
- 2,4216 rooms
- 2,3307 rooms
- 3,1848 rooms
- 5,8789+ rooms
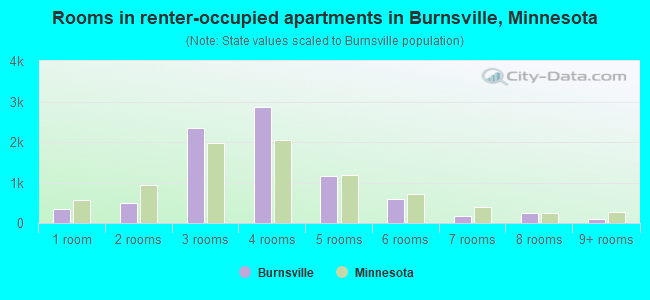
- Rooms in renter-occupied apartments in Burnsville, Minnesota
- 3521 room
- 5022 rooms
- 2,3563 rooms
- 2,8664 rooms
- 1,1545 rooms
- 5906 rooms
- 1667 rooms
- 2378 rooms
- 1049+ rooms
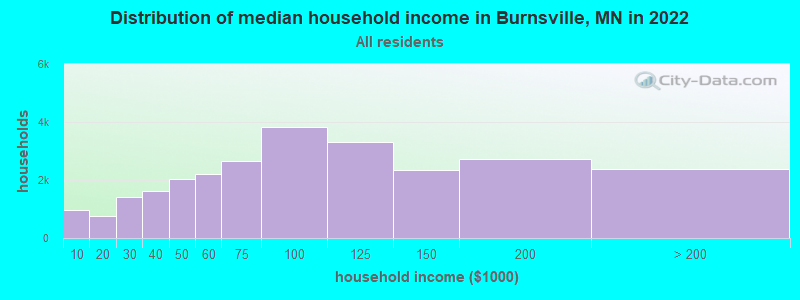
Burnsville, MN household income distribution

- 956Less than $10,000
- 755$10,000 to $19,999
- 1,431$20,000 to $29,999
- 1,637$30,000 to $39,999
- 2,018$40,000 to $49,999
- 2,198$50,000 to $59,999
- 2,667$60,000 to $74,999
- 3,824$75,000 to $99,999
- 3,298$100,000 to $124,999
- 2,341$125,000 to $149,999
- 2,710$150,000 to $199,999
- 2,381$200,000 or more
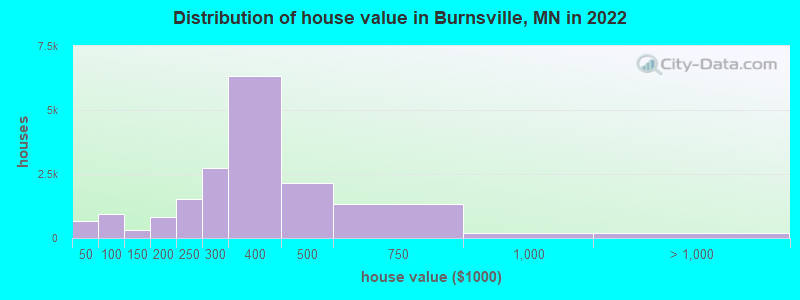
Home value of owner - occupied houses in 2022 in Burnsville, MN
-
- 123Less than $10,000
- 26$10,000 to $14,999
- 21$15,000 to $19,999
- 12$20,000 to $24,999
- 22$25,000 to $29,999
- 60$30,000 to $34,999
- 90$35,000 to $39,999
- 307$40,000 to $49,999
- 61$50,000 to $59,999
- 127$60,000 to $69,999
- 154$70,000 to $79,999
- 220$80,000 to $89,999
- 84$90,000 to $99,999
- 262$100,000 to $124,999
- 68$125,000 to $149,999
- 311$150,000 to $174,999
- 518$175,000 to $199,999
- 1,516$200,000 to $249,999
- 2,729$250,000 to $299,999
- 6,323$300,000 to $399,999
- 2,148$400,000 to $499,999
- 1,347$500,000 to $749,999
- 199$750,000 to $999,999
- 81$1,000,000 to $1,499,999
- 102$2,000,000 or more
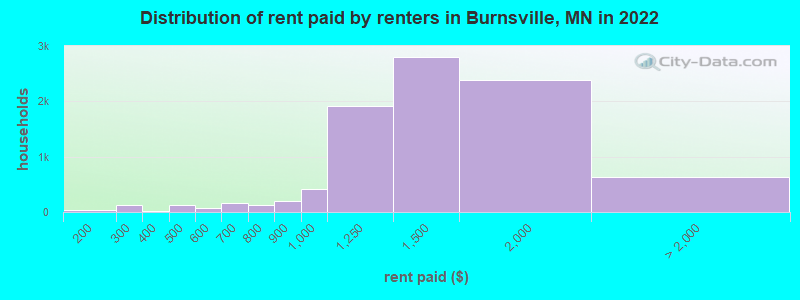
Rent paid by renters in 2022 in Burnsville, MN
-
- 35$150 to $199
- 107$200 to $249
- 16$250 to $299
- 15$300 to $349
- 73$400 to $449
- 62$450 to $499
- 51$500 to $549
- 17$550 to $599
- 89$600 to $649
- 67$650 to $699
- 84$700 to $749
- 45$750 to $799
- 194$800 to $899
- 413$900 to $999
- 1,911$1,000 to $1,249
- 2,797$1,250 to $1,499
- 2,388$1,500 to $1,999
- 276$2,000 to $2,499
- 69$2,500 to $2,999
- 76$3,000 to $3,499
- 34$3,500 or more
- 169No cash rent
Percentage of workers working in this county: 55.4%
Number of people working at home: 6,163 (17.8% of all workers)
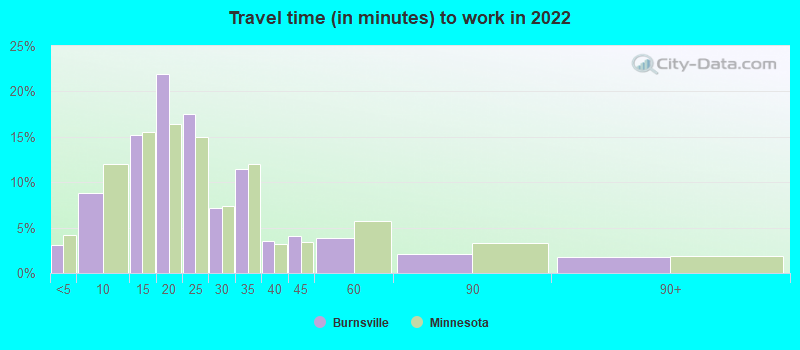
Travel time to work (commute)
- Less than 5 minutes: 907
- 5 to 9 minutes: 2,670
- 10 to 14 minutes: 3,847
- 15 to 19 minutes: 5,335
- 20 to 24 minutes: 4,368
- 25 to 29 minutes: 3,130
- 30 to 34 minutes: 3,851
- 35 to 39 minutes: 695
- 40 to 44 minutes: 1,065
- 45 to 59 minutes: 1,599
- 60 to 89 minutes: 470
- 90 or more minutes: 326
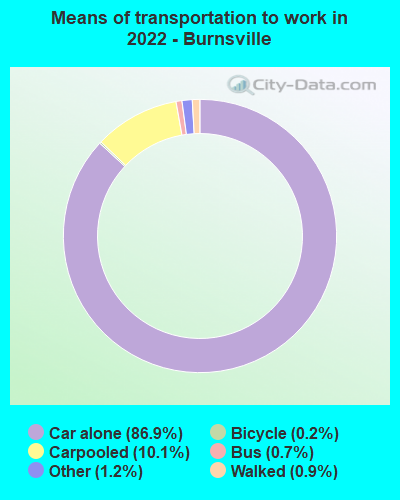
Means of transportation to work:
- Drove a car alone: 24,580 (68.6%)
- Carpooled: 3,327 (9.3%)
- Bus: 180 (0.5%)
- Taxi: 613 (1.7%)
- Bicycle: 37 (0.1%)
- Walked: 234 (0.7%)
- Worked at home: 6,163 (17.2%)
- Unemployment by race in 2022
- Unemployment rate for White non-Hispanic residents
- 4.3%Males
- 2.3%Females
- Unemployment rate for Black residents
- 4.6%Males
- 10.9%Females
- Unemployment rate for American Indian and Alaska Native residents
- 30.4%Males
- Unemployment rate for Asian residents
- 4.6%Males
- 5.7%Females
- Unemployment rate for other race residents
- 3.0%Males
- 1.2%Females
- Unemployment rate for two or more race residents
- 3.9%Males
- 2.8%Females
- Unemployment rate for Hispanic or Latino residents
- 3.9%Males
- 1.4%Females
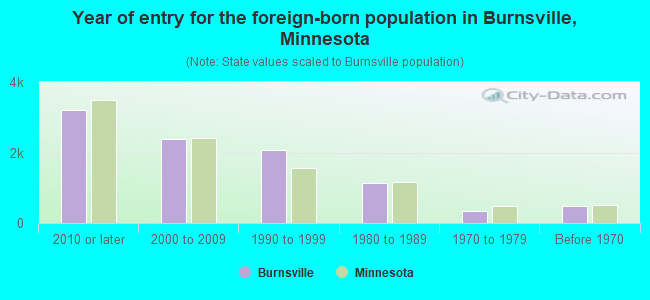
- Year of entry for the foreign-born population in Burnsville, Minnesota
- 3,1952010 or later
- 2,3942000 to 2009
- 2,0641990 to 1999
- 1,1351980 to 1989
- 3381970 to 1979
- 484Before 1970
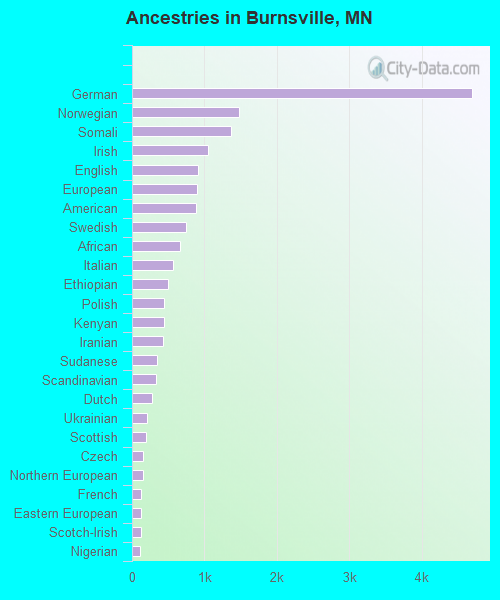
First ancestries reported:
- German: 4,694 (15.5%)
- Norwegian: 1,478 (4.9%)
- Somali: 1,363 (4.5%)
- Irish: 1,043 (3.5%)
- English: 916 (3.0%)
- European: 901 (3.0%)
- American: 884 (2.9%)
- Swedish: 748 (2.5%)
- African: 662 (2.2%)
- Italian: 561 (1.9%)
- Ethiopian: 500 (1.7%)
- Polish: 440 (1.5%)
- Kenyan: 440 (1.5%)
- Iranian: 433 (1.4%)
- Sudanese: 348 (1.2%)
- Scandinavian: 334 (1.1%)
- Dutch: 278 (0.9%)
- Ukrainian: 212 (0.7%)
- Scottish: 192 (0.6%)
- Czech: 158 (0.5%)
- Northern European: 152 (0.5%)
- French: 126 (0.4%)
- Eastern European: 121 (0.4%)
- Scotch-Irish: 119 (0.4%)
- Nigerian: 113 (0.4%)
- Russian: 78 (0.3%)
- Finnish: 78 (0.3%)
- French Canadian: 75 (0.2%)
- Iraqi: 71 (0.2%)
- Jamaican: 70 (0.2%)
- Slovak: 47 (0.2%)
- Danish: 45 (0.1%)
- British: 43 (0.1%)
- Egyptian: 37 (0.1%)
- Turkish: 35 (0.1%)
- Hungarian: 33 (0.1%)
- Lebanese: 30 (0.10%)
- Romanian: 29 (0.10%)
- Swiss: 26 (0.09%)
- Brazilian: 20 (0.07%)
- Canadian: 18 (0.06%)
- Bahamian: 18 (0.06%)
- Yugoslavian: 16 (0.05%)
- Slovene: 15 (0.05%)
- Liberian: 13 (0.04%)
- Basque: 13 (0.04%)
- Austrian: 13 (0.04%)
- Lithuanian: 11 (0.04%)
- Afghan: 10 (0.03%)
- Czechoslovakian: 9 (0.03%)
- Ghanaian: 7 (0.02%)
- Greek: 7 (0.02%)
- Syrian: 7 (0.02%)
- Slavic: 6 (0.02%)
- Moroccan: 6 (0.02%)
- Icelander: 6 (0.02%)
- Palestinian: 6 (0.02%)
- Welsh: 5 (0.02%)
- West Indian: 4 (0.01%)
Most common places of birth for foreign-born residents (%):
| Burnsville: | 16.4% (1,555) |
| Minnesota: | 12.1% (58,312) |
| Burnsville: | 16.3% (1,545) |
| Minnesota: | 8.0% (38,461) |
| Burnsville: | 5.3% (506) |
| Minnesota: | 3.3% (15,701) |
| Burnsville: | 5.3% (498) |
| Minnesota: | 1.8% (8,438) |
| Burnsville: | 5.0% (473) |
| Minnesota: | 3.8% (18,442) |
| Burnsville: | 3.9% (373) |
| Minnesota: | 0.4% (2,035) |
| Burnsville: | 2.9% (274) |
| Minnesota: | 2.0% (9,850) |
| Burnsville: | 2.7% (259) |
| Minnesota: | 2.4% (11,675) |
| Burnsville: | 2.7% (257) |
| Minnesota: | 0.9% (4,264) |
| Burnsville: | 2.6% (250) |
| Minnesota: | 6.7% (32,141) |
| Burnsville: | 2.4% (232) |
| Minnesota: | 5.1% (24,591) |
| Burnsville: | 2.4% (231) |
| Minnesota: | 1.8% (8,637) |
| Burnsville: | 2.2% (207) |
| Minnesota: | 4.0% (19,333) |
| Burnsville: | 2.1% (201) |
| Minnesota: | 0.4% (2,003) |
| Burnsville: | 1.9% (183) |
| Minnesota: | 1.0% (4,646) |
| Burnsville: | 1.9% (181) |
| Minnesota: | 5.1% (24,630) |
| Burnsville: | 1.8% (175) |
| Minnesota: | 0.6% (2,993) |
| Burnsville: | 1.8% (174) |
| Minnesota: | 0.1% (579) |
| Burnsville: | 1.8% (169) |
| Minnesota: | 0.4% (2,061) |
Place of birth for U.S.-born residents:
- This state: 36,412
- Other state: 17,880
- Northeast: 1,917
- Midwest: 10,318
- South: 3,375
- West: 2,279
84.8% of Burnsville residents lived in the same house 1 years ago.
Out of people who lived in different houses, 25.8% lived in this county.
Out of people who lived in different counties, 85.4% lived in Minnesota.
| Burnsville: | 84.8% |
| State average: | 87.4% |
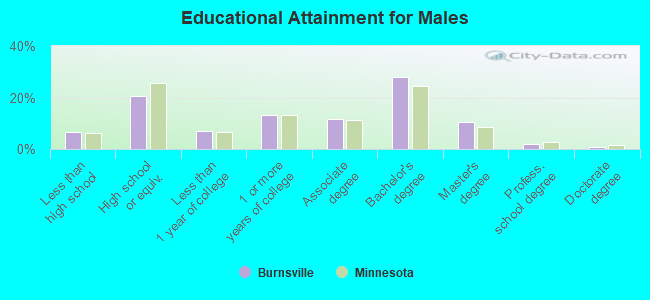
Education attainment for males 25 years and older:
- No schooling: 601
- Nursery to 4th grade: 80
- 5th and 6th grade: 186
- 7th and 8th grade: 85
- 9th grade: 115
- 10th grade: 48
- 11th grade: 157
- 12th grade, no diploma: 239
- High school graduate (or equivalency): 4,571
- Less than 1 year of college: 1,591
- Some college more than 1 year, no degree: 2,919
- Associate degree: 2,583
- Bachelor's degree: 6,222
- Master's degree: 2,341
- Professional school degree: 403
- Doctorate degree: 147
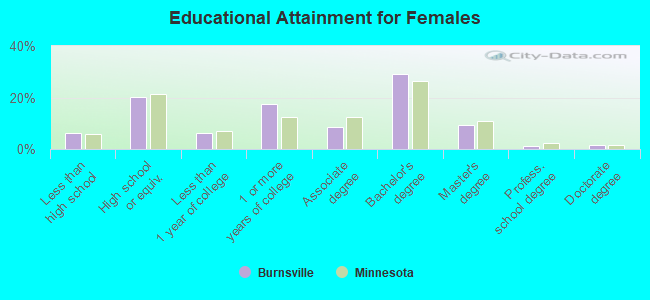
Education attainment for females 25 years and older:
- No schooling: 406
- Nursery to 4th grade: 2
- 5th and 6th grade: 219
- 7th and 8th grade: 160
- 9th grade: 54
- 10th grade: 195
- 11th grade: 184
- 12th grade, no diploma: 181
- High school graduate (or equivalency): 4,633
- Less than 1 year of college: 1,410
- Some college more than 1 year, no degree: 3,977
- Associate degree: 1,975
- Bachelor's degree: 6,701
- Master's degree: 2,165
- Professional school degree: 284
- Doctorate degree: 358
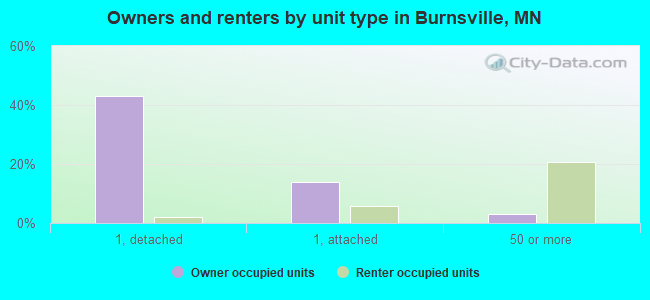
Housing units in structures:
- One, detached: 12,449
- One, attached: 4,926
- Two: 262
- 3 or 4: 592
- 5 to 9: 915
- 10 to 19: 322
- 20 to 49: 1,849
- 50 or more: 5,085
- Mobile homes: 538
Median worth of mobile homes: $51,911
Housing units lacking complete kitchen facilities in 2022: 0.5%
House/condo owner moved in on average 14 years ago
Renter moved in on average 1 years ago
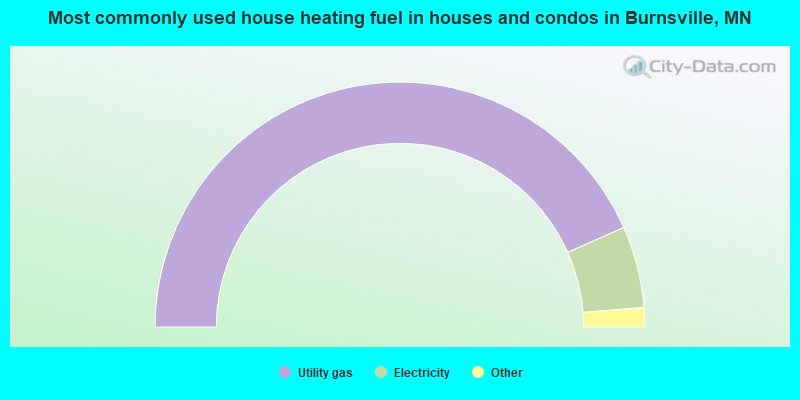
- 86.7%Utility gas
- 10.8%Electricity
- 1.0%Bottled, tank, or LP gas
- 0.5%Wood
- 0.5%No fuel used
- 0.2%Other fuel
- 0.2%Fuel oil, kerosene, etc.
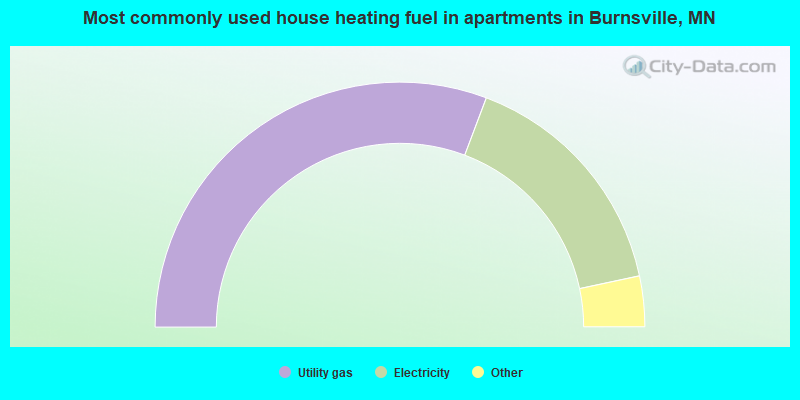
- 61.5%Utility gas
- 31.8%Electricity
- 2.5%Other fuel
- 2.3%No fuel used
- 1.9%Bottled, tank, or LP gas
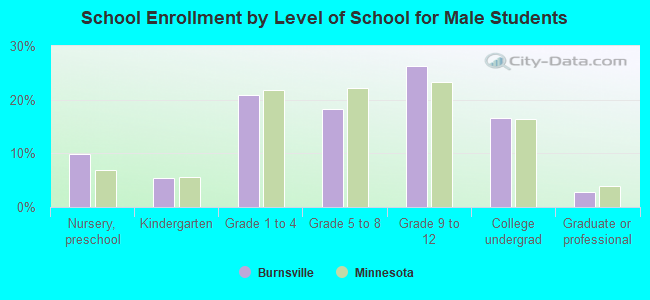
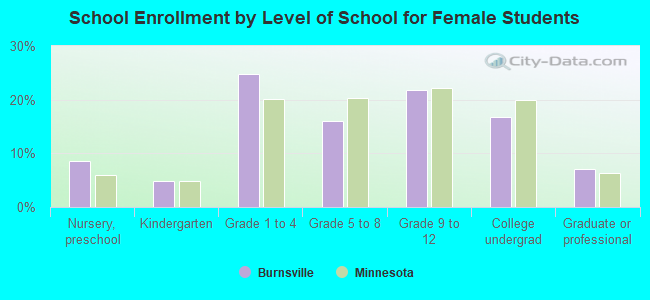
Private vs. public school enrollment:
| Here: | 7.0% |
| Minnesota: | 12.9% |
| Here: | 5.1% |
| Minnesota: | 8.6% |
| Here: | 18.2% |
| Minnesota: | 26.2% |