Burlington, OH (Ohio) Houses and Residents
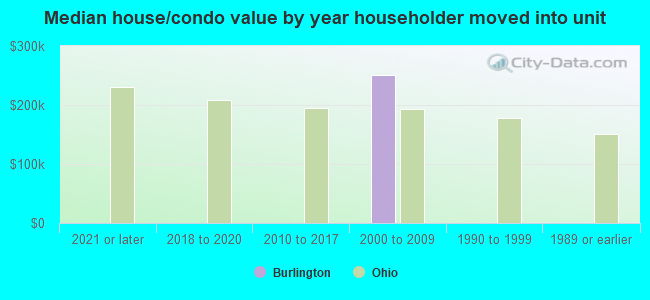
| Burlington: | $233,830 |
| Ohio: | $204,100 |
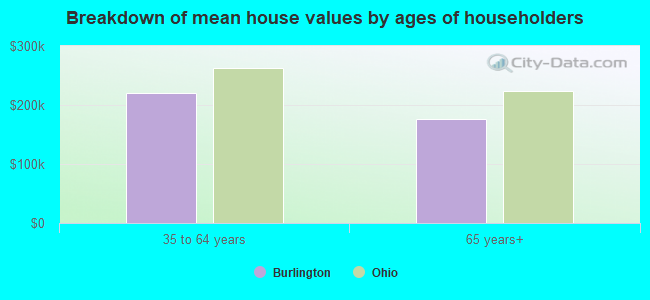
Mean price in 2022:
Detached houses: $201,781
Here: $201,781 State: $254,366 Townhouses or other attached units: $217,110
Here: $217,110 State: $225,733 Mobile homes: $32,435
Here: $32,435 State: $62,719
Total population: 2,676 (All urban)
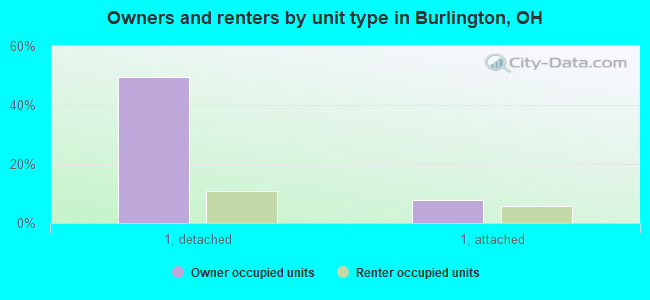
Houses: 1,538 (1,239 occupied: 508 owner occupied, 744 renter occupied)
| % of renters here: | 59% |
| State: | 33% |
Housing density: 1,080 houses/condos per square mile
Median price asked for vacant for-sale houses and condos in 2022: $228,745.
Median contract rent in 2022: $545
Median rent asked for vacant for-rent units in 2022: $608
Median gross rent in Burlington, OH in 2022: $692
Housing units in Burlington with a mortgage: 223 (0 second mortgage, 0 home equity loan, 0 both second mortgage and home equity loan)
Houses without a mortgage: 0
Median household income for houses/condos with a mortgage: $38,994
Median household income for apartments without a mortgage: $86,733
Median monthly housing costs: $672
Compare current foreclosures near Burlington, OH:
| Photo | Address | Area | Beds / Baths | Price | Details |
|---|---|---|---|---|---|

|
#1
& 3328 Crane Avenue
Huntington, WV 25705
|
950 sq. feet
|
1 baths 3 beds |
$42,500
|
show details |

|
#2
Twp. Rd 1366
South Point, OH 45680
|
1,144 sq. feet
|
1 baths 2 beds |
$124,900
|
show details |

|
#3
Township Rd 1007
Chesapeake, OH 45619
|
1,560 sq. feet
|
2 baths 3 beds |
$54,500
|
show details |

|
#4
Valley St
Catlettsburg, KY 41129
|
1,324 sq. feet
|
1 baths 3 beds |
$115,000
|
show details |

|
#5
Walnut St
Kenova, WV 25530
|
2,063 sq. feet
|
2 baths 4 beds |
$220,000
|
show details |

|
#6
Route 75
Kenova, WV 25530
|
1,580 sq. feet
|
2 baths 3 beds |
$174,995
|
show details |

|
#7
Jackson Ave
Huntington, WV 25704
|
1,450 sq. feet
|
2 baths 2 beds |
$145,000
|
show details |

|
#8
Co Rd 181
Ironton, OH 45638
|
988 sq. feet
|
1 baths 3 beds |
$124,900
|
show details |

|
#9
Doss Hill Rd
Barboursville, WV 25504
|
1,040 sq. feet
|
1 baths 2 beds |
$23,900
|
show details |

|
#10
Charleston Ave
Huntington, WV 25701
|
1,200 sq. feet
|
2 baths 4 beds |
$27,900
|
show details |
| Photo | Address | Area | Beds / Baths | Price | Details |
|---|---|---|---|---|---|

|
#11
Beech St
Huntington, WV 25701
|
1,524 sq. feet
|
1 baths 3 beds |
$9,900
|
show details |

|
#12
Ridge St
Russell, KY 41169
|
- sq. feet
|
1 baths 3 beds |
$44,900
|
show details |

|
#13
Olivia Jamison Rd
Wayne, WV 25570
|
- sq. feet
|
2 baths 3 beds |
$72,800
|
show details |

|
#14
4th Ave
Huntington, WV 25702
|
1,305 sq. feet
|
2 baths 3 beds |
$37,900
|
show details |

|
#15
S 5th St
Ironton, OH 45638
|
2,214 sq. feet
|
2 baths 3 beds |
$20,900
|
show details |

|
#16
County Road 1
South Point, OH 45680
|
1,152 sq. feet
|
1 baths 3 beds |
show details | |

|
#17
Howland Ave
Russell, KY 41169
|
1,216 sq. feet
|
1 baths 3 beds |
show details | |

|
#18
Doss Hill Rd
Barboursville, WV 25504
|
2,046 sq. feet
|
1 baths 2 beds |
show details | |

|
#19
State Route 5
Ashland, KY 41102
|
1,791 sq. feet
|
2 baths 2 beds |
show details | |

|
#20
Terrace Blvd
Ashland, KY 41102
|
960 sq. feet
|
1 baths 2 beds |
show details |
| Photo | Address | Area | Beds / Baths | Price | Details |
|---|---|---|---|---|---|

|
#21
Washington Ave
Huntington, WV 25704
|
1,664 sq. feet
|
1 baths 3 beds |
show details | |

|
#22
Hite Ave
Huntington, WV 25705
|
728 sq. feet
|
1 baths 2 beds |
show details | |

|
#23
State Route 141
Kitts Hill, OH 45645
|
1,396 sq. feet
|
1 baths 2 beds |
show details | |

|
#24
Richmond St
Huntington, WV 25702
|
1,896 sq. feet
|
2 baths 3 beds |
show details | |

|
#25
Central Ave
Ashland, KY 41101
|
2 sq. feet
|
1 baths 3 beds |
show details | |

|
#26
Nickel Plate Dr
Huntington, WV 25705
|
- sq. feet
|
4 baths 3 beds |
show details | |

|
#27
10th Ave
Huntington, WV 25701
|
2,128 sq. feet
|
2 baths 3 beds |
show details | |

|
#28
W Pea Ridge Rd
Huntington, WV 25705
|
2,738 sq. feet
|
3 baths 4 beds |
show details | |

|
#29
Township Road 301a
Ironton, OH 45638
|
1,363 sq. feet
|
1 baths 3 beds |
show details | |

|
#30
Countryside Dr
Ashland, KY 41102
|
1,040 sq. feet
|
1 baths 3 beds |
show details |
| Photo | Address | Area | Beds / Baths | Price | Details |
|---|---|---|---|---|---|

|
#31
County Road 15
South Point, OH 45680
|
2,368 sq. feet
|
2 baths 4 beds |
show details | |

|
#32
8th Street Rd
Huntington, WV 25701
|
1,279 sq. feet
|
1 baths 3 beds |
show details | |

|
#33
Township Road 1234
Proctorville, OH 45669
|
2,172 sq. feet
|
2 baths 3 beds |
show details | |

|
#34
Magnolia Ct
Ashland, KY 41102
|
3,756 sq. feet
|
2 baths 3 beds |
show details | |

|
#35
Yeich Ave # 1
Huntington, WV 25705
|
1,118 sq. feet
|
2 baths 5 beds |
show details | |

|
#36
24th St
Huntington, WV 25703
|
1,344 sq. feet
|
1 baths 3 beds |
show details | |

|
#37
County Road 115
Chesapeake, OH 45619
|
1,120 sq. feet
|
1 baths 3 beds |
show details | |

|
#38
Blackburn Ave
Ashland, KY 41101
|
1,152 sq. feet
|
1 baths 3 beds |
show details | |

|
#39
Norway Ave
Huntington, WV 25705
|
1,302 sq. feet
|
1 baths 3 beds |
show details | |

|
#40
Route 75
Huntington, WV 25704
|
1,092 sq. feet
|
1 baths 3 beds |
show details |
| Photo | Address | Area | Beds / Baths | Price | Details |
|---|---|---|---|---|---|

|
#41
Russell St
Ashland, KY 41101
|
900 sq. feet
|
1 baths 3 beds |
show details | |

|
#42
Roseland Ct
Huntington, WV 25705
|
2,052 sq. feet
|
2 baths 3 beds |
show details | |

|
#43
Camelot Dr
Huntington, WV 25701
|
2,600 sq. feet
|
2 baths 3 beds |
show details | |

|
#44
Heritage Park Rd
Huntington, WV 25704
|
1,360 sq. feet
|
2 baths 3 beds |
show details | |

|
#45
Wilson Ct
Huntington, WV 25701
|
1,248 sq. feet
|
1 baths 3 beds |
show details | |

|
#46
Jefferson Park Dr
Huntington, WV 25705
|
1,672 sq. feet
|
1 baths 3 beds |
show details | |

|
#47
County Road 105
Kitts Hill, OH 45645
|
2,115 sq. feet
|
1 baths 3 beds |
show details | |

|
#48
Leeward Ave
Huntington, WV 25705
|
728 sq. feet
|
1 baths 2 beds |
show details | |

|
#49
Meacham Dr
Barboursville, WV 25504
|
2,025 sq. feet
|
2 baths 3 beds |
show details | |

|
Check over 1 million property listings on Foreclosure.com!
|
browse all offers | |||

Latest news about housing in Burlington, OH collected exclusively by city-data.com from local newspapers, TV, and radio stations

 | Condos in the Florence (airport) area (9 replies) |
| Why buy in Cincinnati as opposed to northern KY? (30 replies) |
| School recommendations not based on ratings (17 replies) |
| Hebron? Burlington? Union? Best for families? (6 replies) |
| Pleasant ridge (5 replies) |
| May be moving to the Cincinnati area for work (Copy/Paste below) (3 replies) |

Median year apartment built: 1976
Household type by relationship:
Households: 2,775- Male householders: 371 (167 living alone), Female householders: 856 (401 living alone)
337 spouses (337 opposite-sex spouses), 47 unmarried partners, (47 opposite-sex unmarried partners), 773 children (773 natural, 0 adopted, 0 stepchildren), 69 grandchildren, 0 brothers or sisters, 39 parents, 0 foster children, 14 other relatives, 86 non-relatives
- In group quarters: 176
Size of family households: 122 2-persons, 296 3-persons, 153 4-persons, 30 5-persons.
Size of nonfamily households: 587 1-person, 59 2-persons.
235 married couples with children.
232 single-parent households (9 men, 223 women).
96.3% of residents of Burlington speak English at home.
1.7% of residents speak Spanish at home (100% speak English very well).
1.7% of residents speak other Indo-European language at home (29% speak English very well, 71% speak English well).
0.6% of residents speak other language at home (100% speak English very well).
Foreign born population: 95 (3.4%)
(69.5% of them are naturalized citizens)
| Here: | 6.4 |
| State: | 6.7 |
| Here: | 4.5 |
| State: | 4.4 |
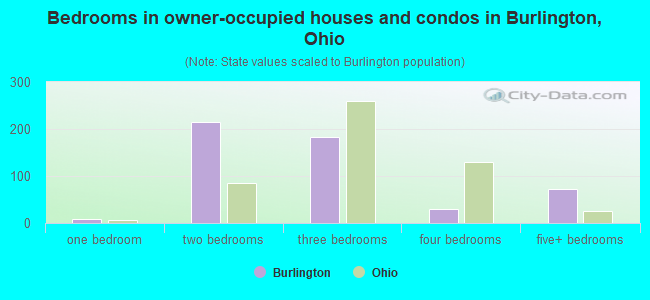
- Bedrooms in owner-occupied houses and condos in Burlington, Ohio
- 0no bedroom
- 91 bedroom
- 2142 bedrooms
- 1833 bedrooms
- 294 bedrooms
- 735+ bedrooms
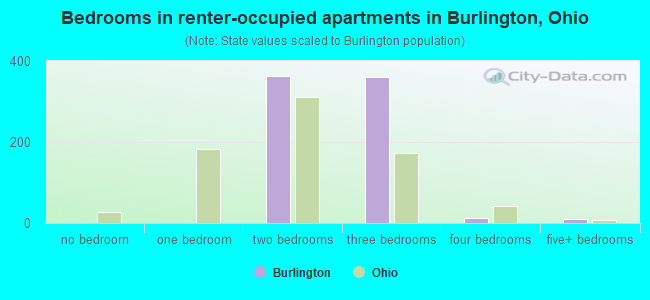
- Bedrooms in renter-occupied apartments in Burlington, Ohio
- 0no bedroom
- 01 bedroom
- 3622 bedrooms
- 3603 bedrooms
- 134 bedrooms
- 105+ bedrooms
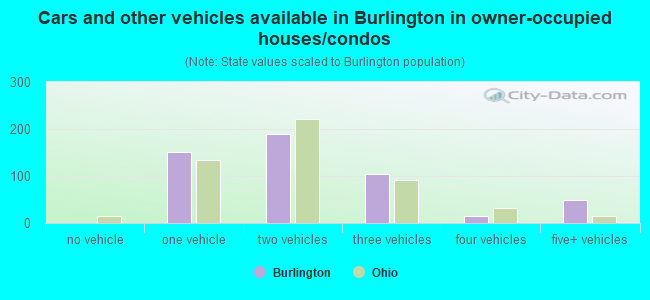
- Cars and other vehicles available in Burlington in owner-occupied houses/condos
- 0no vehicle
- 1521 vehicle
- 1892 vehicles
- 1043 vehicles
- 144 vehicles
- 495+ vehicles
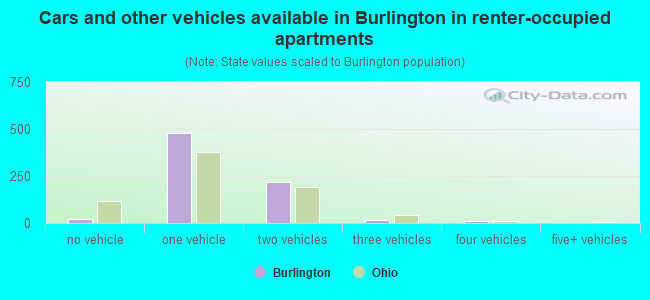
- Cars and other vehicles available in Burlington in renter-occupied apartments
- 23no vehicle
- 4771 vehicle
- 2192 vehicles
- 143 vehicles
- 114 vehicles
- 05+ vehicles
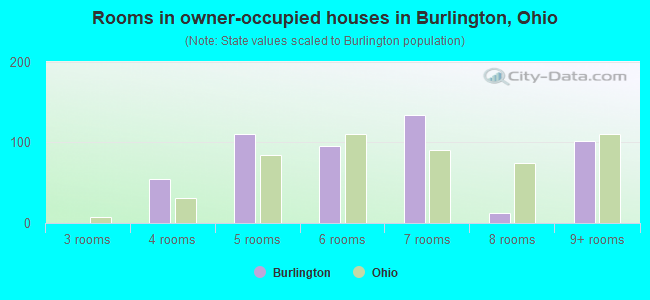
- Rooms in owner-occupied houses in Burlington, Ohio
- 01 room
- 02 rooms
- 03 rooms
- 544 rooms
- 1105 rooms
- 966 rooms
- 1347 rooms
- 128 rooms
- 1029+ rooms
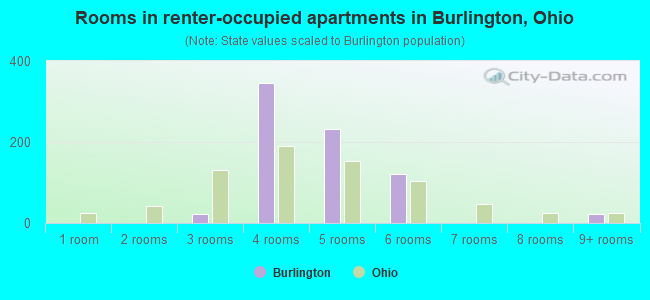
- Rooms in renter-occupied apartments in Burlington, Ohio
- 01 room
- 02 rooms
- 223 rooms
- 3454 rooms
- 2325 rooms
- 1226 rooms
- 07 rooms
- 08 rooms
- 229+ rooms
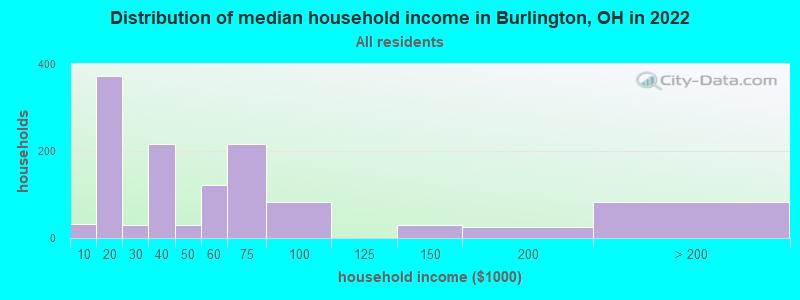
Burlington, OH household income distribution

- 33Less than $10,000
- 373$10,000 to $19,999
- 30$20,000 to $29,999
- 217$30,000 to $39,999
- 31$40,000 to $49,999
- 122$50,000 to $59,999
- 216$60,000 to $74,999
- 83$75,000 to $99,999
- 30$125,000 to $149,999
- 25$150,000 to $199,999
- 83$200,000 or more
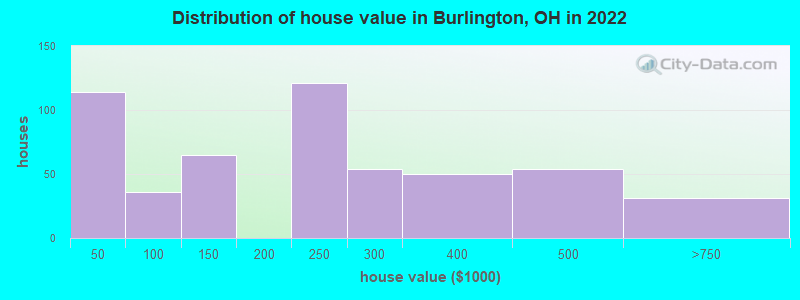
Home value of owner - occupied houses in 2022 in Burlington, OH
-
- 42Less than $10,000
- 14$10,000 to $14,999
- 57$20,000 to $24,999
- 8$50,000 to $59,999
- 18$60,000 to $69,999
- 9$90,000 to $99,999
- 53$100,000 to $124,999
- 11$125,000 to $149,999
- 120$200,000 to $249,999
- 53$250,000 to $299,999
- 50$300,000 to $399,999
- 54$400,000 to $499,999
- 31$500,000 to $749,999
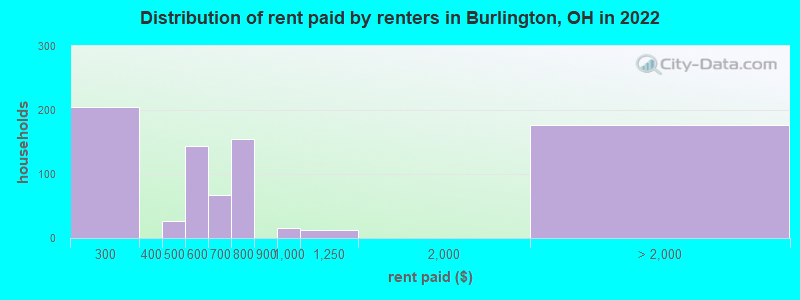
Rent paid by renters in 2022 in Burlington, OH
-
- 204$200 to $249
- 26$450 to $499
- 132$500 to $549
- 10$550 to $599
- 41$600 to $649
- 25$650 to $699
- 155$750 to $799
- 16$900 to $999
- 12$1,000 to $1,249
- 175No cash rent
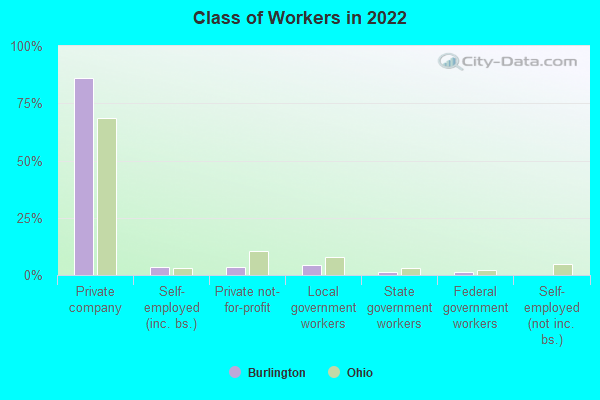
Percentage of workers working in this county: 40.4%
Number of people working at home: 61 (5.4% of all workers)
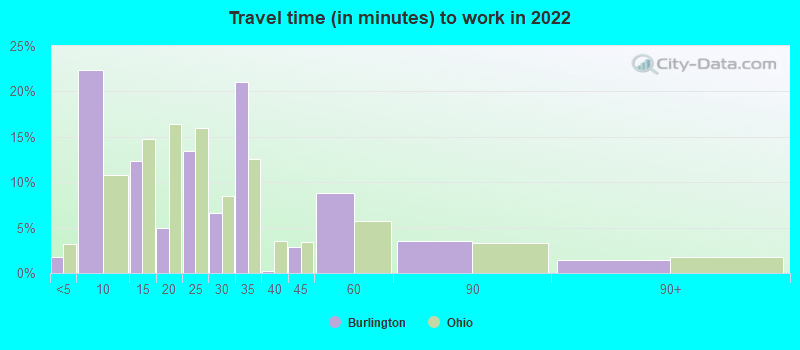
Travel time to work (commute)
- Less than 5 minutes: 25
- 5 to 9 minutes: 199
- 10 to 14 minutes: 87
- 15 to 19 minutes: 372
- 20 to 24 minutes: 220
- 25 to 29 minutes: 63
- 30 to 34 minutes: 26
- 35 to 39 minutes: 0
- 40 to 44 minutes: 0
- 45 to 59 minutes: 0
- 60 to 89 minutes: 43
- 90 or more minutes: 8
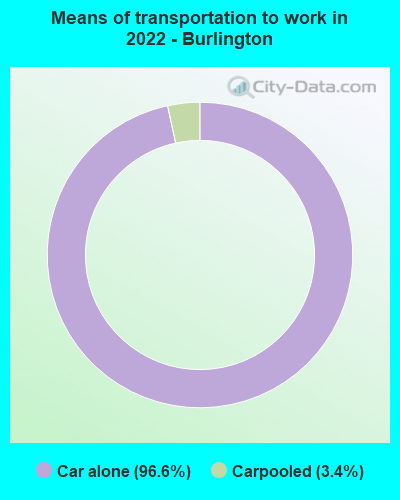
Means of transportation to work:
- Drove a car alone: 1,080 (88.9%)
- Carpooled: 40 (3.3%)
- Worked at home: 61 (5.0%)
- Unemployment by race in 2022
- Unemployment rate for White non-Hispanic residents
- 1.9%Males
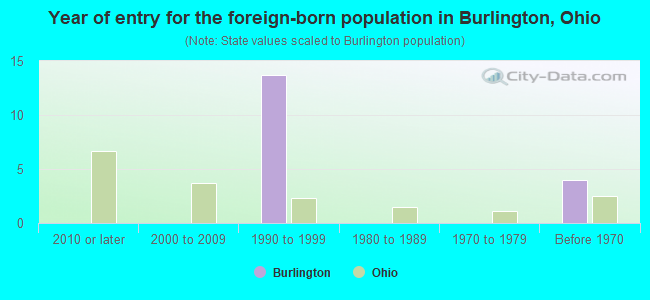
- Year of entry for the foreign-born population in Burlington, Ohio
- 02010 or later
- 02000 to 2009
- 141990 to 1999
- 01980 to 1989
- 01970 to 1979
- 4Before 1970
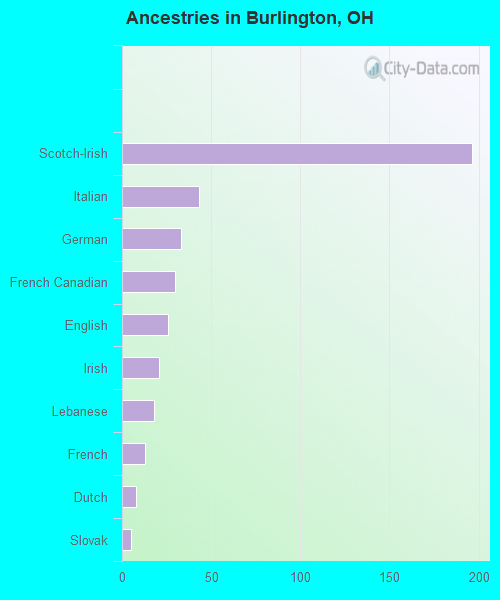
First ancestries reported:
- Scotch-Irish: 196 (30.9%)
- Italian: 43 (6.8%)
- German: 33 (5.2%)
- French Canadian: 30 (4.7%)
- English: 26 (4.1%)
- Irish: 21 (3.3%)
- Lebanese: 18 (2.8%)
- French: 13 (2.1%)
- Dutch: 8 (1.3%)
- Slovak: 5 (0.8%)
Most common places of birth for foreign-born residents (%):
| Burlington: | 44.2% (42) |
| Ohio: | 0.2% (950) |
| Burlington: | 30.5% (29) |
| Ohio: | 2.6% (14,988) |
| Burlington: | 12.6% (12) |
| Ohio: | 0.7% (3,862) |
Place of birth for U.S.-born residents:
- This state: 750
- Other state: 1,885
- Northeast: 45
- Midwest: 21
- South: 1,702
- West: 84
99.3% of Burlington residents lived in the same house 1 years ago.
Out of people who lived in different houses, 48.1% lived in this county.
| Burlington: | 99.3% |
| State average: | 87.8% |
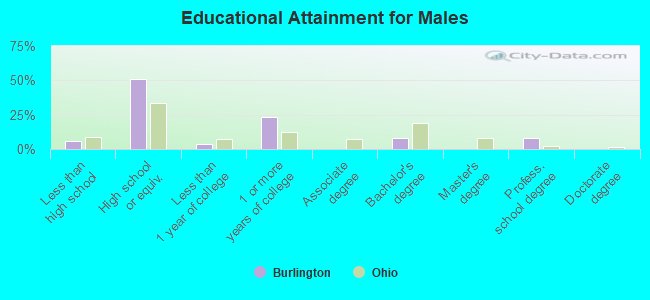
Education attainment for males 25 years and older:
- No schooling: 0
- Nursery to 4th grade: 0
- 5th and 6th grade: 0
- 7th and 8th grade: 4
- 9th grade: 0
- 10th grade: 0
- 11th grade: 6
- 12th grade, no diploma: 44
- High school graduate (or equivalency): 457
- Less than 1 year of college: 35
- Some college more than 1 year, no degree: 211
- Associate degree: 0
- Bachelor's degree: 70
- Master's degree: 0
- Professional school degree: 75
- Doctorate degree: 0
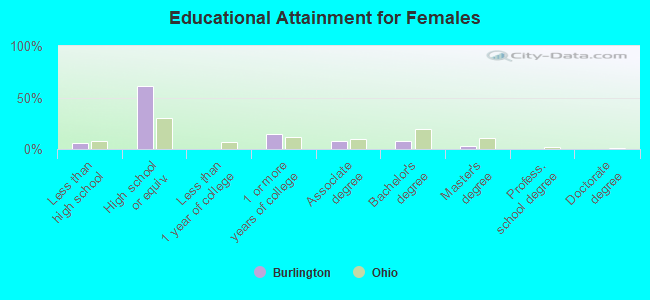
Education attainment for females 25 years and older:
- No schooling: 0
- Nursery to 4th grade: 0
- 5th and 6th grade: 0
- 7th and 8th grade: 6
- 9th grade: 6
- 10th grade: 4
- 11th grade: 13
- 12th grade, no diploma: 32
- High school graduate (or equivalency): 634
- Less than 1 year of college: 0
- Some college more than 1 year, no degree: 146
- Associate degree: 80
- Bachelor's degree: 81
- Master's degree: 35
- Professional school degree: 0
- Doctorate degree: 0


Housing units in structures:
- One, detached: 818
- One, attached: 12
- Two: 173
- 3 or 4: 93
- 20 to 49: 49
- Mobile homes: 391
Median worth of mobile homes: $22,361
Housing units lacking complete kitchen facilities in 2022: 18.2%
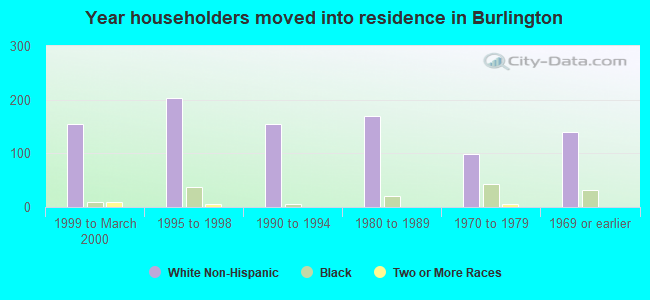
House/condo owner moved in on average 19 years ago
Renter moved in on average 11 years ago
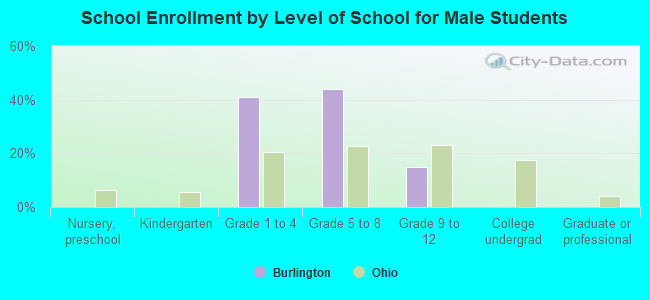
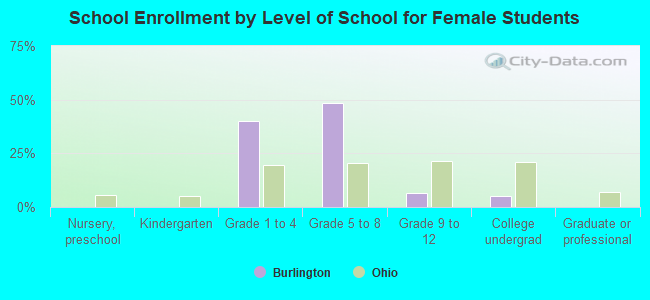
Private vs. public school enrollment:
| Here: | 46.8% |
| Ohio: | 16.0% |
| Here: | 0.0% |
| Ohio: | 13.1% |
| Here: | 0.0% |
| Ohio: | 22.3% |