Buffalo Valley, TN (Tennessee) Houses and Residents
| Buffalo Valley: | $250,948 |
| Tennessee: | $284,800 |
Total population: 3,516 (Urban population: 0, Rural population: 3,143 (235 farm, 2,908 nonfarm))
Houses: 1,409 (1,235 occupied: 1,064 owner occupied, 171 renter occupied)
| % of renters here: | 14% |
| State: | 33% |
Housing density: 17 houses/condos per square mile
Median price asked for vacant for-sale houses and condos in 2022 in this county: $167,017.
Median contract rent in 2022: $607 (lower quartile is $489, upper quartile is $886)
Median rent asked for vacant for-rent units in 2022: $605
Median gross rent in Buffalo Valley, TN in 2022: $834
Housing units in Buffalo Valley with a mortgage: 248 (17 second mortgage, 0 home equity loan, 11 both second mortgage and home equity loan)
Houses without a mortgage: 231


Household type by relationship:
Households: 69,606- In family households: 55,958 (13,458 male householders, 5,031 female householders)
13,979 spouses, 18,254 children (16,646 natural, 487 adopted, 1,121 stepchildren), 1,500 grandchildren, 613 brothers or sisters, 478 parents, foster children, 720 other relatives, 1,538 non-relatives
- In nonfamily households: 13,648 (4,833 male householders (3,468 living alone)), 5,608 female householders (4,636 living alone)), 3,207 nonrelatives
- In group quarters: 2,715 (722 institutionalized population)
9,630 married couples with children.
2,816 single-parent households (611 men, 2,205 women).
98.9% of residents of Buffalo Valley speak English at home.
1.0% of residents speak Spanish at home (90% speak English very well, 10% speak English not well).
0.2% of residents speak Asian or Pacific Island language at home (100% speak English not well).
Foreign born population: 48 (1.2%)
(39.6% of them are naturalized citizens)
| Here: | 5.5 |
| State: | 6.5 |
| Here: | 4.6 |
| State: | 4.4 |

- Bedrooms in owner-occupied houses and condos in Buffalo Valley, Tennessee
- 0no bedroom
- 351 bedroom
- 2922 bedrooms
- 5853 bedrooms
- 1244 bedrooms
- 285+ bedrooms

- Bedrooms in renter-occupied apartments in Buffalo Valley, Tennessee
- 2no bedroom
- 221 bedroom
- 742 bedrooms
- 643 bedrooms
- 94 bedrooms
- 05+ bedrooms

- Cars and other vehicles available in Buffalo Valley in owner-occupied houses/condos
- 55no vehicle
- 2211 vehicle
- 4722 vehicles
- 2403 vehicles
- 614 vehicles
- 155+ vehicles

- Cars and other vehicles available in Buffalo Valley in renter-occupied apartments
- 6no vehicle
- 691 vehicle
- 672 vehicles
- 243 vehicles
- 04 vehicles
- 55+ vehicles

- Rooms in owner-occupied houses in Buffalo Valley, Tennessee
- 01 room
- 152 rooms
- 283 rooms
- 2064 rooms
- 2435 rooms
- 2796 rooms
- 1597 rooms
- 628 rooms
- 729+ rooms

- Rooms in renter-occupied apartments in Buffalo Valley, Tennessee
- 21 room
- 92 rooms
- 73 rooms
- 624 rooms
- 535 rooms
- 236 rooms
- 157 rooms
- 08 rooms
- 09+ rooms


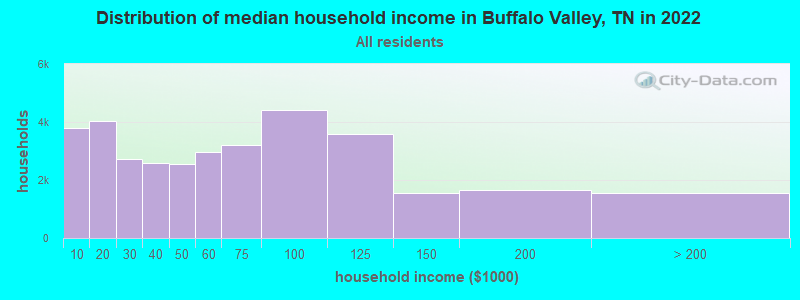
Buffalo Valley, TN household income distribution

- 3,778Less than $10,000
- 4,030$10,000 to $19,999
- 2,732$20,000 to $29,999
- 2,591$30,000 to $39,999
- 2,545$40,000 to $49,999
- 2,981$50,000 to $59,999
- 3,222$60,000 to $74,999
- 4,416$75,000 to $99,999
- 3,576$100,000 to $124,999
- 1,541$125,000 to $149,999
- 1,654$150,000 to $199,999
- 1,558$200,000 or more
Percentage of workers working in this county: 78.4%
Number of people working at home: 142 (9.8% of all workers)
Travel time to work (commute)
- Less than 5 minutes: 10
- 5 to 9 minutes: 63
- 10 to 14 minutes: 86
- 15 to 19 minutes: 181
- 20 to 24 minutes: 296
- 25 to 29 minutes: 137
- 30 to 34 minutes: 276
- 35 to 39 minutes: 27
- 40 to 44 minutes: 9
- 45 to 59 minutes: 43
- 60 to 89 minutes: 58
- 90 or more minutes: 27
Means of transportation to work:
- Drove a car alone: 1,062 (81.8%)
- Carpooled: 133 (10.2%)
- Bus or trolley bus: 3 (0.2%)
- Walked: 5 (0.4%)
- Other means: 10 (0.8%)
- Worked at home: 85 (6.5%)

- Year of entry for the foreign-born population in Buffalo Valley, Tennessee
- 01995 to March 2000
- 01990 to 1994
- 01985 to 1989
- 61980 to 1984
- 71975 to 1979
- 01970 to 1974
- 01965 to 1969
- 5Before 1965
Most common places of birth for foreign-born residents (%):
| Buffalo Valley: | 38.9% (7) |
| Tennessee: | 28.1% (44,682) |
| Buffalo Valley: | 33.3% (6) |
| Tennessee: | 5.2% (8,316) |
| Buffalo Valley: | 27.8% (5) |
| Tennessee: | 0.6% (974) |
Place of birth for U.S.-born residents:
- This state: 2,224
- Other state: 889
- Northeast: 76
- Midwest: 304
- South: 351
- West: 158
64% of Buffalo Valley residents lived in the same house 5 years ago.
Out of people who lived in different houses, 54% lived in this county.
Out of people who lived in different counties, 51% lived in Tennessee.
Education attainment for males 25 years and older:
- No schooling: 31
- Nursery to 4th grade: 14
- 5th and 6th grade: 44
- 7th and 8th grade: 199
- 9th grade: 34
- 10th grade: 64
- 11th grade: 34
- 12th grade, no diploma: 53
- High school graduate (or equivalency): 331
- Less than 1 year of college: 46
- Some college more than 1 year, no degree: 75
- Associate degree: 11
- Bachelor's degree: 110
- Master's degree: 21
- Professional school degree: 0
- Doctorate degree: 14

Education attainment for females 25 years and older:
- No schooling: 9
- Nursery to 4th grade: 11
- 5th and 6th grade: 66
- 7th and 8th grade: 147
- 9th grade: 43
- 10th grade: 52
- 11th grade: 49
- 12th grade, no diploma: 5
- High school graduate (or equivalency): 408
- Less than 1 year of college: 49
- Some college more than 1 year, no degree: 102
- Associate degree: 19
- Bachelor's degree: 94
- Master's degree: 38
- Professional school degree: 11
- Doctorate degree: 6


Housing units in structures:
- One, detached: 1,003
- One, attached: 5
- 3 or 4: 3
- 5 to 9: 6
- Mobile homes: 392
Median worth of mobile homes: $55,223
Housing units lacking complete kitchen facilities: 2.1%

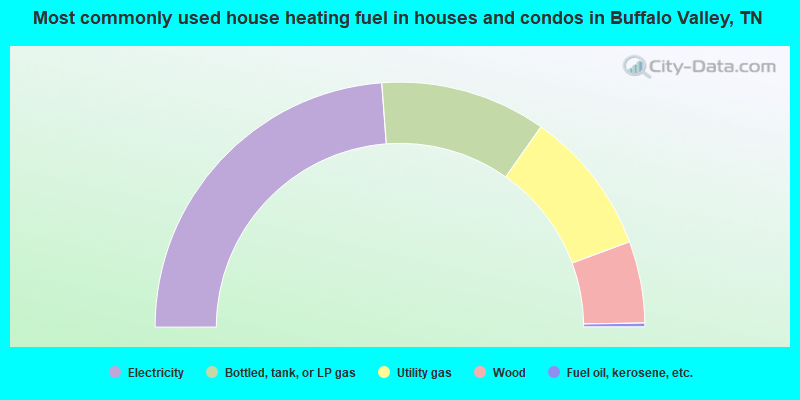
- 47.7%Electricity
- 21.9%Bottled, tank, or LP gas
- 19.2%Utility gas
- 10.8%Wood
- 0.5%Fuel oil, kerosene, etc.
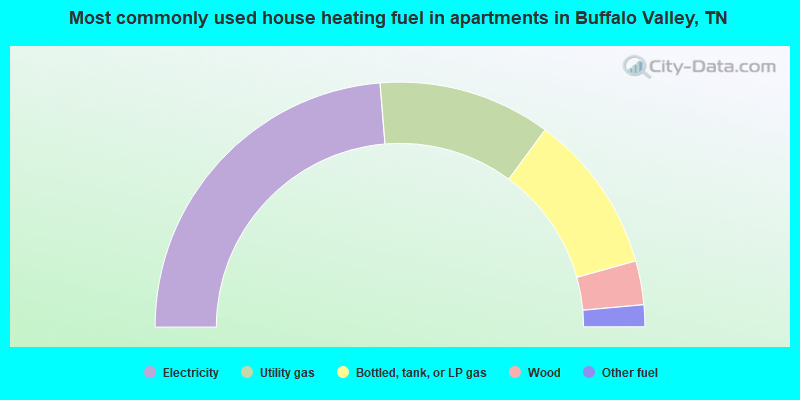
- 47.4%Electricity
- 22.8%Utility gas
- 21.1%Bottled, tank, or LP gas
- 5.8%Wood
- 2.9%Other fuel
Private vs. public school enrollment:
| Here: | 3.9% |
| Tennessee: | 9.5% |
| Here: | 10.4% |
| Tennessee: | 10.4% |
| Here: | 3.4% |
| Tennessee: | 22.8% |


