Buellton, CA (California) Houses and Residents
| Buellton: | $724,697 |
| California: | $715,900 |
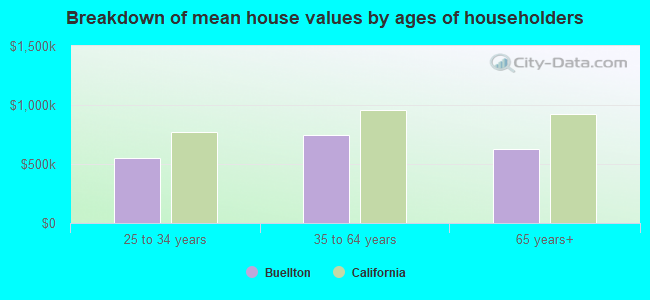
Mean price in 2022:
Detached houses: $786,460
Here: $786,460 State: $988,808 Townhouses or other attached units: $544,811
Here: $544,811 State: $838,546 In 5-or-more-unit structures: $319,416
Here: $319,416 State: $730,996 Mobile homes: $228,788
Here: $228,788 State: $184,506
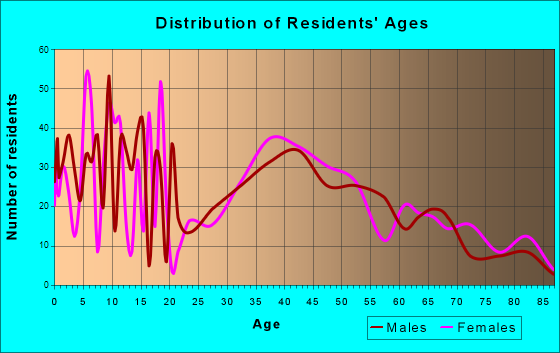
Total population: 5,044 (Urban population: 3,832 (all inside urban clusters), Rural population: 0)
Houses: 2,264 (1,954 occupied: 1,258 owner occupied, 707 renter occupied)
| % of renters here: | 36% |
| State: | 44% |
Housing density: 1,449 houses/condos per square mile
Median price asked for vacant for-sale houses and condos in 2022 in this county: $300,986.
Median contract rent in 2022: $1,975 (lower quartile is $1,507, upper quartile is over $2,000)
Median rent asked for vacant for-rent units in 2022: $1,046
Median gross rent in Buellton, CA in 2022: over $2,000
Housing units in Buellton with a mortgage: 819 (71 second mortgage, 0 home equity loan, 26 both second mortgage and home equity loan)
Houses without a mortgage: 0
Median household income for houses/condos with a mortgage: $146,698
Median household income for apartments without a mortgage: $49,423
Median monthly housing costs: $2,134
Compare current foreclosures near Buellton, CA:
| Photo | Address | Area | Beds / Baths | Price | Details |
|---|---|---|---|---|---|

|
#1
Elisa Ct
Buellton, CA 93427
|
1,310 sq. feet
|
2 baths 3 beds |
show details | |

|
#2
Kendale Rd
Buellton, CA 93427
|
1,310 sq. feet
|
2 baths 3 beds |
show details | |

|
#3
Kendale Rd
Buellton, CA 93427
|
1,310 sq. feet
|
2 baths 3 beds |
show details | |

|
#4
Elisa Ct
Buellton, CA 93427
|
- sq. feet
|
2 baths 3 beds |
show details | |

|
#5
W Highway 246, Spc 163
Buellton, CA 93427
|
- sq. feet
|
- baths - beds |
show details | |

|
#6
W Highway 246, Spc 82
Buellton, CA 93427
|
- sq. feet
|
- baths - beds |
show details | |

|
#7
N 6th St
Lompoc, CA 93436
|
1,316 sq. feet
|
2 baths 3 beds |
show details | |

|
#8
N Poppy St
Lompoc, CA 93436
|
1,320 sq. feet
|
2 baths 3 beds |
show details | |

|
#9
W Willow Ave
Lompoc, CA 93436
|
1,362 sq. feet
|
2 baths 4 beds |
show details | |

|
#10
N C St
Lompoc, CA 93436
|
- sq. feet
|
1 baths 3 beds |
show details |
| Photo | Address | Area | Beds / Baths | Price | Details |
|---|---|---|---|---|---|

|
#11
N Y St
Lompoc, CA 93436
|
- sq. feet
|
2 baths 4 beds |
show details | |

|
#12
N Y St
Lompoc, CA 93436
|
- sq. feet
|
2 baths 4 beds |
show details | |

|
#13
S N St
Lompoc, CA 93436
|
- sq. feet
|
2 baths 2 beds |
show details | |

|
#14
Alamo
Lompoc, CA 93436
|
- sq. feet
|
2 baths 3 beds |
show details | |

|
#15
N C St
Lompoc, CA 93436
|
- sq. feet
|
1 baths 3 beds |
show details | |

|
#16
E Cherry Ave
Lompoc, CA 93436
|
- sq. feet
|
2 baths 3 beds |
show details | |

|
#17
E Pine Ave Spc 71
Lompoc, CA 93436
|
- sq. feet
|
2 baths 2 beds |
show details | |

|
#18
N 1st Pl # L
Lompoc, CA 93436
|
- sq. feet
|
2 baths 3 beds |
show details | |

|
#19
E Pine Ave
Lompoc, CA 93436
|
- sq. feet
|
1 baths 3 beds |
show details | |

|
#20
Ridge Rd
Santa Ynez, CA 93460
|
- sq. feet
|
2 baths 2 beds |
show details |
| Photo | Address | Area | Beds / Baths | Price | Details |
|---|---|---|---|---|---|

|
#21
3rd St
Solvang, CA 93463
|
- sq. feet
|
3 baths 3 beds |
show details | |

|
#22
3rd St
Solvang, CA 93463
|
- sq. feet
|
3 baths 3 beds |
show details | |

|
#23
S B St Apt E
Lompoc, CA 93436
|
- sq. feet
|
- baths - beds |
show details | |

|
#24
N D St
Lompoc, CA 93436
|
- sq. feet
|
- baths - beds |
show details | |

|
#25
N D St
Lompoc, CA 93436
|
- sq. feet
|
- baths - beds |
show details | |

|
#26
N K St Apt B
Lompoc, CA 93436
|
- sq. feet
|
- baths - beds |
show details | |

|
#27
N L St
Lompoc, CA 93436
|
- sq. feet
|
- baths - beds |
show details | |

|
#28
W Laurel Ave # 6
Lompoc, CA 93436
|
- sq. feet
|
- baths - beds |
show details | |

|
#29
Highland Rd
Santa Ynez, CA 93460
|
- sq. feet
|
- baths - beds |
show details | |

|
#30
Briar Creek Way Apt 106
Lompoc, CA 93436
|
- sq. feet
|
- baths - beds |
show details |
| Photo | Address | Area | Beds / Baths | Price | Details |
|---|---|---|---|---|---|

|
#31
Milky Way
Lompoc, CA 93436
|
- sq. feet
|
- baths - beds |
show details | |

|
Check over 1 million property listings on Foreclosure.com!
|
browse all offers | |||

Latest news about housing in Buellton, CA collected exclusively by city-data.com from local newspapers, TV, and radio stations


Median year apartment built: 1992
Household type by relationship:
Households: 5,135- Male householders: 868 (158 living alone), Female householders: 1,054 (154 living alone)
1,115 spouses (1,115 opposite-sex spouses), 85 unmarried partners, (85 opposite-sex unmarried partners), 1,809 children (1,678 natural, 130 adopted, 0 stepchildren), 74 grandchildren, 0 brothers or sisters, 82 parents, 0 foster children, 43 other relatives, 0 non-relatives
Size of family households: 684 2-persons, 452 3-persons, 275 4-persons, 90 5-persons, 20 6-persons, 21 7-or-more-persons.
Size of nonfamily households: 314 1-person, 54 2-persons.
839 married couples with children.
275 single-parent households (64 men, 211 women).
78.8% of residents of Buellton speak English at home.
16.3% of residents speak Spanish at home (45% speak English very well, 21% speak English well, 27% speak English not well, 8% don't speak English at all).
1.9% of residents speak other Indo-European language at home (100% speak English very well).
1.2% of residents speak Asian or Pacific Island language at home (100% speak English very well).
0.9% of residents speak other language at home (100% speak English very well).
Foreign born population: 710 (13.8%)
(49.4% of them are naturalized citizens)
| Here: | 6.1 |
| State: | 6.0 |
| Here: | 4.9 |
| State: | 3.9 |
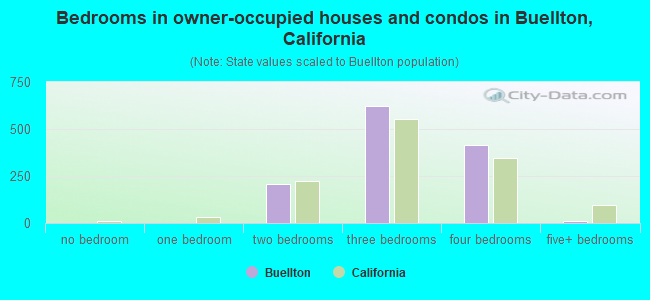
- Bedrooms in owner-occupied houses and condos in Buellton, California
- 0no bedroom
- 01 bedroom
- 2082 bedrooms
- 6223 bedrooms
- 4164 bedrooms
- 135+ bedrooms
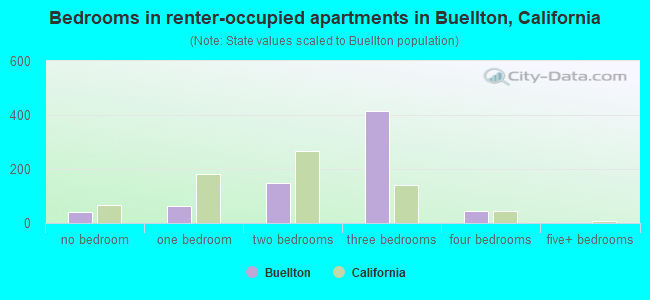
- Bedrooms in renter-occupied apartments in Buellton, California
- 40no bedroom
- 641 bedroom
- 1472 bedrooms
- 4133 bedrooms
- 444 bedrooms
- 05+ bedrooms
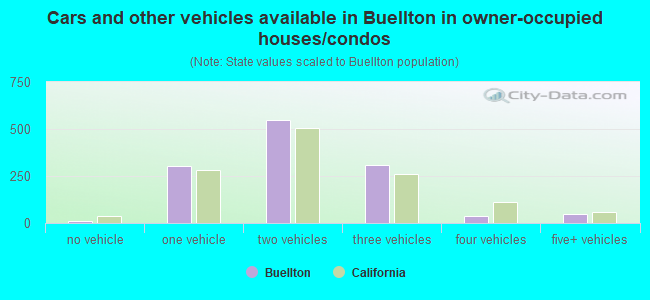
- Cars and other vehicles available in Buellton in owner-occupied houses/condos
- 13no vehicle
- 3041 vehicle
- 5482 vehicles
- 3063 vehicles
- 384 vehicles
- 505+ vehicles
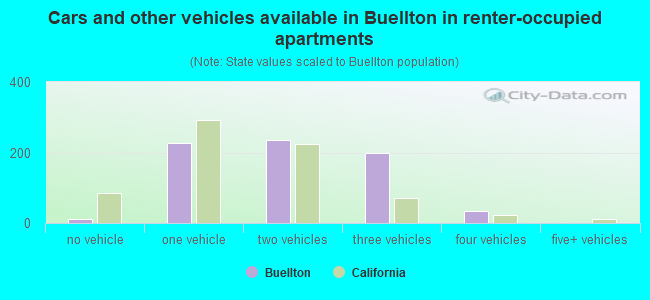
- Cars and other vehicles available in Buellton in renter-occupied apartments
- 12no vehicle
- 2261 vehicle
- 2352 vehicles
- 1993 vehicles
- 354 vehicles
- 05+ vehicles
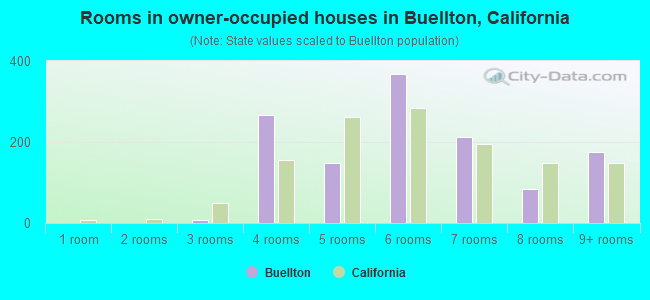
- Rooms in owner-occupied houses in Buellton, California
- 01 room
- 02 rooms
- 83 rooms
- 2674 rooms
- 1475 rooms
- 3676 rooms
- 2127 rooms
- 838 rooms
- 1759+ rooms
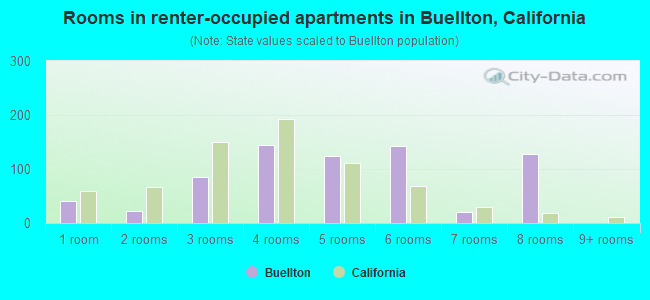
- Rooms in renter-occupied apartments in Buellton, California
- 401 room
- 222 rooms
- 863 rooms
- 1454 rooms
- 1245 rooms
- 1426 rooms
- 207 rooms
- 1288 rooms
- 09+ rooms
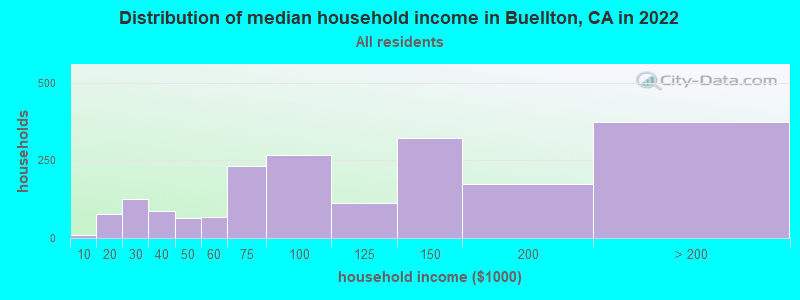
Buellton, CA household income distribution

- 11Less than $10,000
- 78$10,000 to $19,999
- 126$20,000 to $29,999
- 87$30,000 to $39,999
- 63$40,000 to $49,999
- 66$50,000 to $59,999
- 233$60,000 to $74,999
- 268$75,000 to $99,999
- 113$100,000 to $124,999
- 322$125,000 to $149,999
- 173$150,000 to $199,999
- 373$200,000 or more
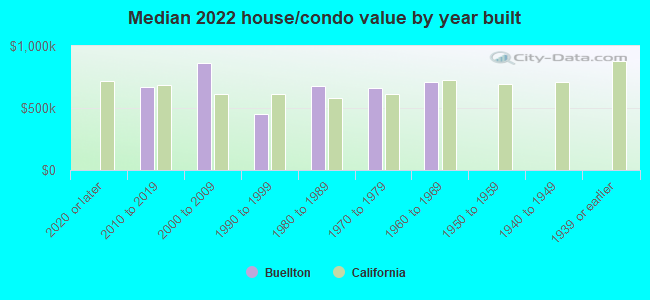
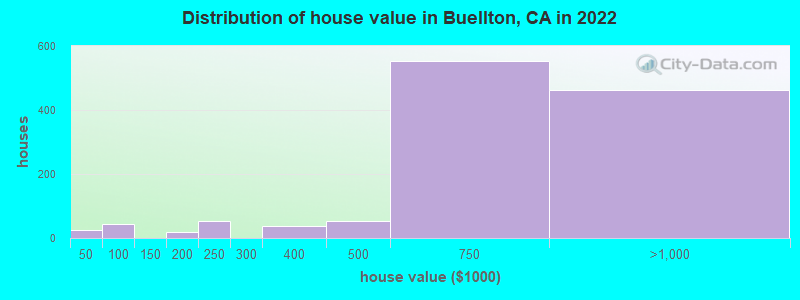
Home value of owner - occupied houses in 2022 in Buellton, CA
-
- 26Less than $10,000
- 23$60,000 to $69,999
- 20$80,000 to $89,999
- 19$175,000 to $199,999
- 51$200,000 to $249,999
- 39$300,000 to $399,999
- 53$400,000 to $499,999
- 554$500,000 to $749,999
- 457$750,000 to $999,999
- 6$1,000,000 to $1,499,999
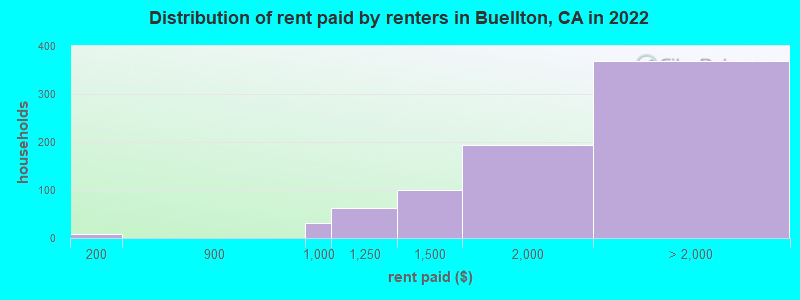
Rent paid by renters in 2022 in Buellton, CA
-
- 9$150 to $199
- 30$900 to $999
- 62$1,000 to $1,249
- 99$1,250 to $1,499
- 193$1,500 to $1,999
- 145$2,000 to $2,499
- 124$2,500 to $2,999
- 98$3,000 to $3,499
Percentage of workers working in this county: 96.5%
Number of people working at home: 457 (15.0% of all workers)
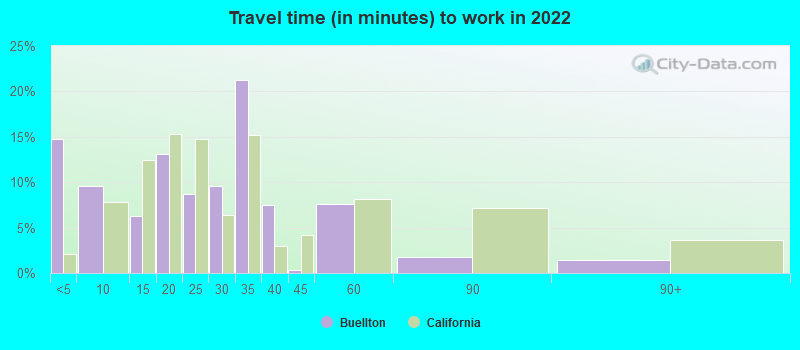
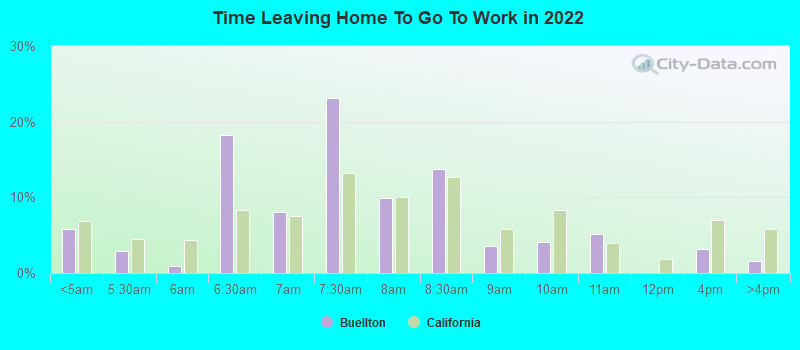
Travel time to work (commute)
- Less than 5 minutes: 254
- 5 to 9 minutes: 211
- 10 to 14 minutes: 304
- 15 to 19 minutes: 259
- 20 to 24 minutes: 116
- 25 to 29 minutes: 12
- 30 to 34 minutes: 238
- 35 to 39 minutes: 123
- 40 to 44 minutes: 154
- 45 to 59 minutes: 673
- 60 to 89 minutes: 45
- 90 or more minutes: 50
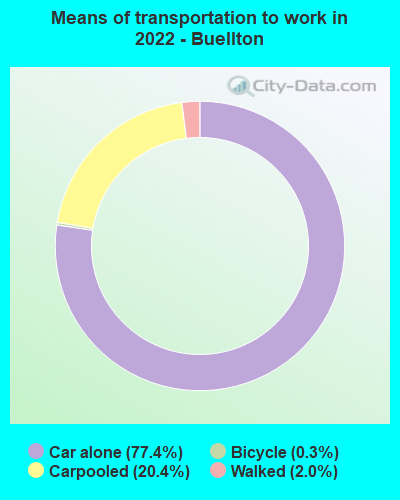
Means of transportation to work:
- Drove a car alone: 1,751 (63.4%)
- Carpooled: 427 (15.5%)
- Bicycle: 6 (0.2%)
- Walked: 67 (2.4%)
- Worked at home: 457 (16.5%)
- Unemployment by race in 2022
- Unemployment rate for White non-Hispanic residents
- 0.5%Males
- 2.5%Females
- Unemployment rate for other race residents
- 20.5%Males
- 14.2%Females
- Unemployment rate for two or more race residents
- 7.0%Males
- Unemployment rate for Hispanic or Latino residents
- 8.2%Males
- 4.4%Females
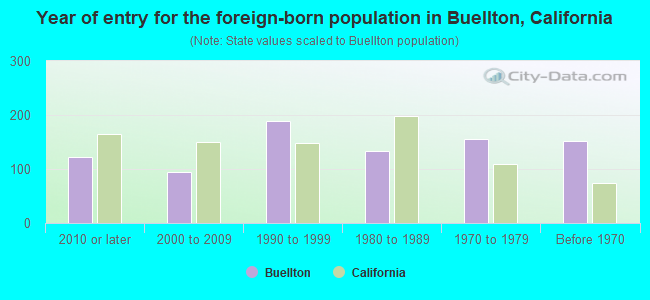
- Year of entry for the foreign-born population in Buellton, California
- 1232010 or later
- 942000 to 2009
- 1881990 to 1999
- 1331980 to 1989
- 1551970 to 1979
- 152Before 1970
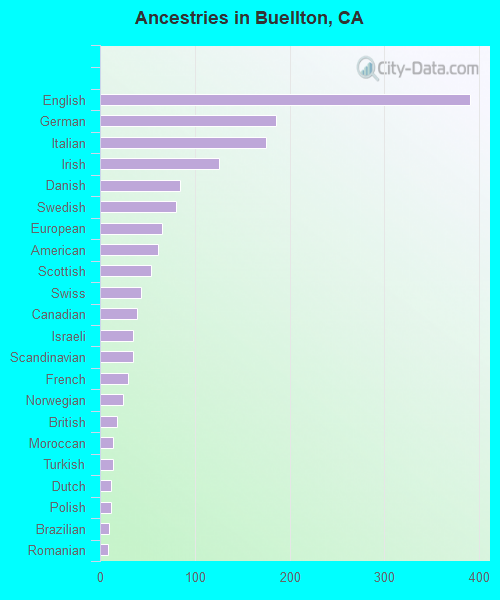
First ancestries reported:
- English: 391 (18.0%)
- German: 186 (8.6%)
- Italian: 175 (8.1%)
- Irish: 126 (5.8%)
- Danish: 84 (3.9%)
- Swedish: 80 (3.7%)
- European: 65 (3.0%)
- American: 61 (2.8%)
- Scottish: 54 (2.5%)
- Swiss: 43 (2.0%)
- Canadian: 39 (1.8%)
- Israeli: 35 (1.6%)
- Scandinavian: 35 (1.6%)
- French: 30 (1.4%)
- Norwegian: 24 (1.1%)
- British: 18 (0.8%)
- Moroccan: 14 (0.6%)
- Turkish: 14 (0.6%)
- Dutch: 12 (0.6%)
- Polish: 12 (0.6%)
- Brazilian: 10 (0.5%)
- Romanian: 8 (0.4%)
Most common places of birth for foreign-born residents (%):
| Buellton: | 44.1% (330) |
| California: | 37.2% (3,881,193) |
| Buellton: | 7.0% (52) |
| California: | 0.5% (55,249) |
| Buellton: | 6.7% (50) |
| California: | 1.2% (127,477) |
| Buellton: | 6.6% (49) |
| California: | 0.6% (57,953) |
| Buellton: | 5.7% (43) |
| California: | 0.6% (60,582) |
| Buellton: | 5.2% (39) |
| California: | 0.6% (66,590) |
| Buellton: | 4.9% (37) |
| California: | 0.3% (33,029) |
| Buellton: | 3.6% (27) |
| California: | 4.2% (440,287) |
| Buellton: | 2.5% (19) |
| California: | 7.8% (818,297) |
| Buellton: | 2.1% (16) |
| California: | 0.0% (2,887) |
| Buellton: | 1.7% (13) |
| California: | 0.7% (74,025) |
| Buellton: | 1.6% (12) |
| California: | 1.0% (105,215) |
Place of birth for U.S.-born residents:
- This state: 3,146
- Other state: 1,217
- Northeast: 165
- Midwest: 579
- South: 205
- West: 202
93.4% of Buellton residents lived in the same house 1 years ago.
Out of people who lived in different houses, 49.6% lived in this county.
| Buellton: | 93.4% |
| State average: | 88.9% |
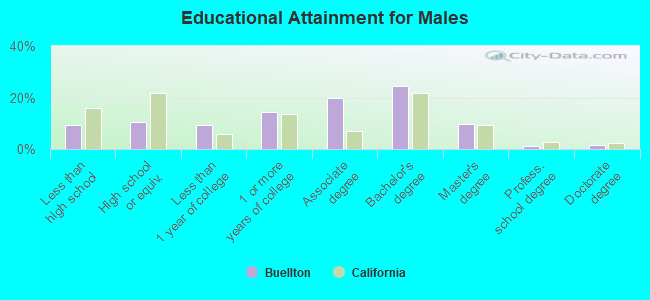
Education attainment for males 25 years and older:
- No schooling: 25
- Nursery to 4th grade: 0
- 5th and 6th grade: 0
- 7th and 8th grade: 39
- 9th grade: 25
- 10th grade: 0
- 11th grade: 57
- 12th grade, no diploma: 26
- High school graduate (or equivalency): 191
- Less than 1 year of college: 171
- Some college more than 1 year, no degree: 263
- Associate degree: 364
- Bachelor's degree: 446
- Master's degree: 178
- Professional school degree: 21
- Doctorate degree: 30
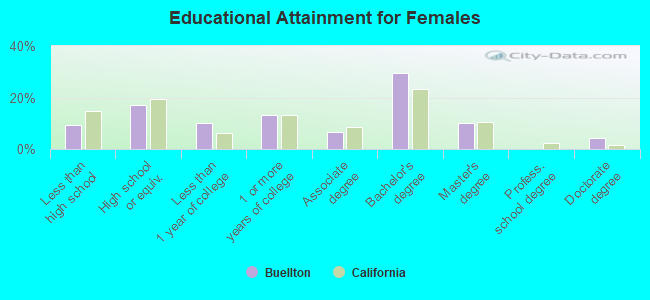
Education attainment for females 25 years and older:
- No schooling: 56
- Nursery to 4th grade: 113
- 5th and 6th grade: 0
- 7th and 8th grade: 0
- 9th grade: 0
- 10th grade: 0
- 11th grade: 0
- 12th grade, no diploma: 0
- High school graduate (or equivalency): 317
- Less than 1 year of college: 185
- Some college more than 1 year, no degree: 243
- Associate degree: 123
- Bachelor's degree: 547
- Master's degree: 188
- Professional school degree: 0
- Doctorate degree: 80
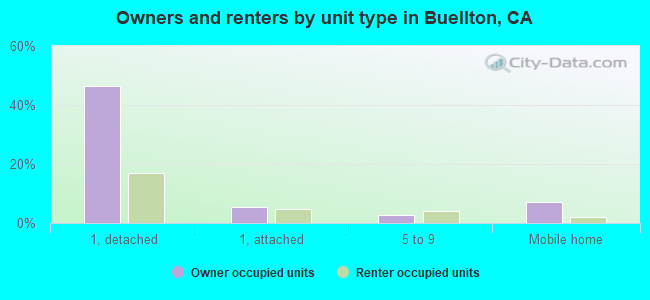
Housing units in structures:
- One, detached: 1,320
- One, attached: 253
- 5 to 9: 152
- 10 to 19: 18
- 20 to 49: 131
- 50 or more: 11
- Mobile homes: 376
Median worth of mobile homes: $222,690
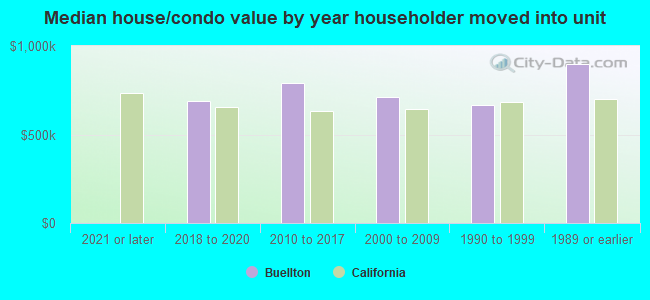
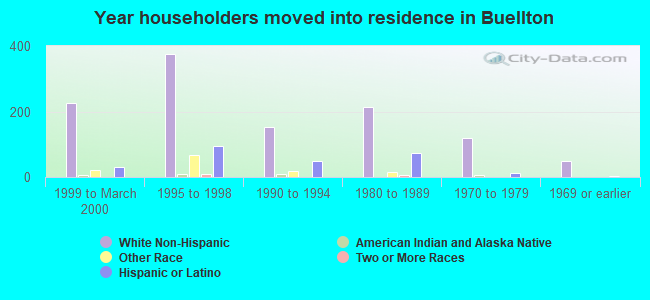
House/condo owner moved in on average 10 years ago
Renter moved in on average 3 years ago
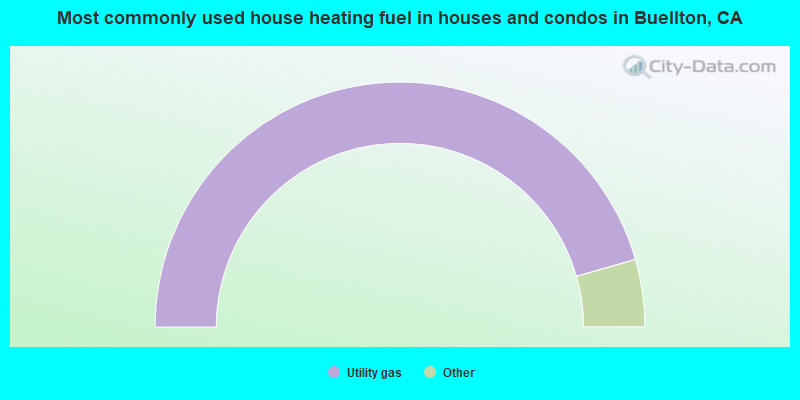
- 91.2%Utility gas
- 3.6%Electricity
- 2.8%No fuel used
- 2.5%Solar energy
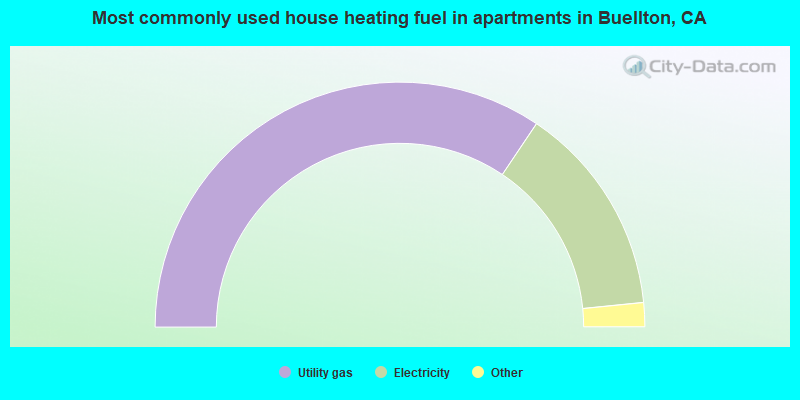
- 68.9%Utility gas
- 28.0%Electricity
- 1.7%Solar energy
- 1.4%Bottled, tank, or LP gas
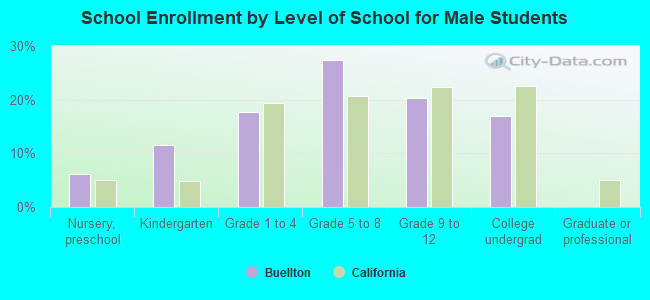
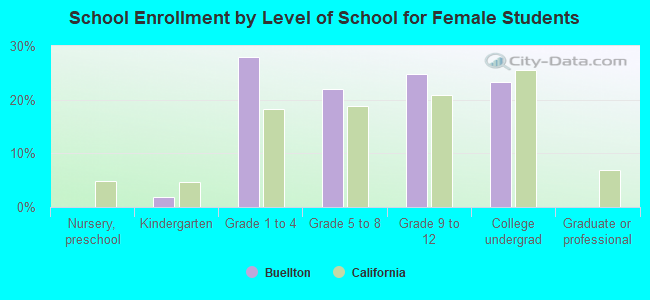
Private vs. public school enrollment:
| Here: | 28.0% |
| California: | 10.5% |
| Here: | 12.1% |
| California: | 8.5% |
| Here: | 33.8% |
| California: | 15.9% |