Bryantsville, KY (Kentucky) Houses and Residents
| Bryantsville: | $225,897 |
| Kentucky: | $196,300 |
Total population: 5,017 (Urban population: 0, Rural population: 4,389 (212 farm, 4,177 nonfarm))
Houses: 1,851 (1,608 occupied: 1,377 owner occupied, 231 renter occupied)
| % of renters here: | 14% |
| State: | 31% |
Housing density: 32 houses/condos per square mile
Median price asked for vacant for-sale houses and condos in 2022 in this county: $264,169.
Median contract rent in 2022: $705 (lower quartile is $649, upper quartile is $815)
Median rent asked for vacant for-rent units in 2022: $758
Median gross rent in Bryantsville, KY in 2022: $988
Housing units in Bryantsville with a mortgage: 754 (121 second mortgage, 63 home equity loan, 7 both second mortgage and home equity loan)
Houses without a mortgage: 163
Compare current foreclosures near Bryantsville, KY:
| Photo | Address | Area | Beds / Baths | Price | Details |
|---|---|---|---|---|---|

|
#1
Pam Dr
Lancaster, KY 40444
|
1,417 sq. feet
|
2 baths 3 beds |
$170,000
|
show details |

|
#2
Cottage St
Nicholasville, KY 40356
|
1 sq. feet
|
1 baths 1 beds |
$62,500
|
show details |

|
#3
Richmond St
Lancaster, KY 40444
|
3,293 sq. feet
|
3 baths 4 beds |
$250,000
|
show details |

|
#4
Feathers Ln
Danville, KY 40422
|
1,003 sq. feet
|
1 baths 3 beds |
$54,500
|
show details |

|
#5
Fall Lick Rd
Crab Orchard, KY 40419
|
1,475 sq. feet
|
2 baths 4 beds |
show details | |

|
#6
Hickory Hill Dr
Nicholasville, KY 40356
|
1,563 sq. feet
|
1 baths 3 beds |
show details | |

|
#7
Ridgecrest Dr
Nicholasville, KY 40356
|
1,560 sq. feet
|
2 baths 3 beds |
show details | |

|
#8
Cardinal Dr
Harrodsburg, KY 40330
|
1,218 sq. feet
|
1 baths 2 beds |
show details | |

|
#9
Runyon Rd
Harrodsburg, KY 40330
|
1,936 sq. feet
|
2 baths 3 beds |
show details | |

|
#10
Talmage Mayo Rd
Harrodsburg, KY 40330
|
1,352 sq. feet
|
1 baths 3 beds |
show details |
| Photo | Address | Area | Beds / Baths | Price | Details |
|---|---|---|---|---|---|

|
#11
Tabler Ave
Harrodsburg, KY 40330
|
624 sq. feet
|
1 baths 2 beds |
show details | |

|
#12
Allison Cir
Nicholasville, KY 40356
|
1,339 sq. feet
|
2 baths 3 beds |
show details | |

|
#13
Ridge Rd
Harrodsburg, KY 40330
|
1,000 sq. feet
|
1 baths 3 beds |
show details | |

|
#14
Beechmont Dr
Nicholasville, KY 40356
|
1,036 sq. feet
|
1 baths 3 beds |
show details | |

|
#15
Rolling Acres Dr
Nicholasville, KY 40356
|
1,080 sq. feet
|
1 baths 3 beds |
show details | |

|
#16
Liberty St
Nicholasville, KY 40356
|
1,066 sq. feet
|
1 baths 3 beds |
show details | |

|
#17
Greenbriar Dr
Harrodsburg, KY 40330
|
1,167 sq. feet
|
1 baths 2 beds |
show details | |

|
#18
Greenbriar Dr
Harrodsburg, KY 40330
|
1,134 sq. feet
|
1 baths 3 beds |
show details | |

|
#19
Barbaro Ln
Nicholasville, KY 40356
|
1,148 sq. feet
|
2 baths 4 beds |
show details | |

|
#20
Locust Hts
Nicholasville, KY 40356
|
1,408 sq. feet
|
1 baths 2 beds |
show details |
| Photo | Address | Area | Beds / Baths | Price | Details |
|---|---|---|---|---|---|

|
#21
High St
Harrodsburg, KY 40330
|
1,128 sq. feet
|
1 baths 3 beds |
show details | |

|
#22
Alpine Way
Nicholasville, KY 40356
|
1,025 sq. feet
|
1 baths 3 beds |
show details | |

|
#23
Shun Pike
Nicholasville, KY 40356
|
1,215 sq. feet
|
1 baths 3 beds |
show details | |

|
#24
Bohon Rd
Harrodsburg, KY 40330
|
1,623 sq. feet
|
3 baths 4 beds |
show details | |

|
#25
Kimberly Heights Dr
Nicholasville, KY 40356
|
1,512 sq. feet
|
2 baths 3 beds |
show details | |

|
#26
Oakwood Dr
Nicholasville, KY 40356
|
1,225 sq. feet
|
1 baths 3 beds |
show details | |

|
#27
Laurel Ln
Nicholasville, KY 40356
|
1,188 sq. feet
|
1 baths 3 beds |
show details | |

|
#28
College Mnr
Harrodsburg, KY 40330
|
1,604 sq. feet
|
2 baths 3 beds |
show details | |

|
#29
Barberry Ln
Nicholasville, KY 40356
|
1,257 sq. feet
|
1 baths 3 beds |
show details | |

|
#30
Dry Branch Rd
Richmond, KY 40475
|
- sq. feet
|
2 baths 3 beds |
show details |
| Photo | Address | Area | Beds / Baths | Price | Details |
|---|---|---|---|---|---|

|
#31
Greenbriar St
Nicholasville, KY 40356
|
1,542 sq. feet
|
1 baths 3 beds |
show details | |

|
#32
Christopher Dr
Nicholasville, KY 40356
|
1,336 sq. feet
|
2 baths 3 beds |
show details | |

|
#33
W Brown St
Nicholasville, KY 40356
|
1,092 sq. feet
|
1 baths 2 beds |
show details | |

|
#34
Greenbriar St
Nicholasville, KY 40356
|
2,144 sq. feet
|
1 baths 3 beds |
show details | |

|
#35
Briarwood Dr
Nicholasville, KY 40356
|
1,250 sq. feet
|
1 baths 3 beds |
show details | |

|
#36
Bellechase Ln
Nicholasville, KY 40356
|
1,096 sq. feet
|
1 baths 3 beds |
show details | |

|
#37
Brome Dr
Nicholasville, KY 40356
|
2,134 sq. feet
|
2 baths 4 beds |
show details | |

|
#38
Linden Ave
Harrodsburg, KY 40330
|
1,720 sq. feet
|
1 baths 3 beds |
show details | |

|
#39
Mount Lebanon Pike
Nicholasville, KY 40356
|
1,512 sq. feet
|
2 baths 3 beds |
show details | |

|
#40
N College St
Harrodsburg, KY 40330
|
2,038 sq. feet
|
2 baths 3 beds |
show details |
| Photo | Address | Area | Beds / Baths | Price | Details |
|---|---|---|---|---|---|

|
#41
Price Ave
Harrodsburg, KY 40330
|
1,112 sq. feet
|
1 baths 3 beds |
show details | |

|
#42
Garden Park Dr
Nicholasville, KY 40356
|
1,150 sq. feet
|
1 baths 3 beds |
show details | |

|
#43
N Greenville St
Harrodsburg, KY 40330
|
980 sq. feet
|
1 baths 3 beds |
show details | |

|
#44
Pacer Rd
Wilmore, KY 40390
|
2,890 sq. feet
|
2 baths 4 beds |
show details | |

|
#45
Edwards Rd
Nicholasville, KY 40356
|
1,008 sq. feet
|
1 baths 3 beds |
show details | |

|
#46
Foxwood Dr
Nicholasville, KY 40356
|
1,637 sq. feet
|
1 baths 3 beds |
show details | |

|
#47
Thames Cir
Nicholasville, KY 40356
|
2,162 sq. feet
|
2 baths 4 beds |
show details | |

|
#48
Mingo Rd
Nicholasville, KY 40356
|
2,296 sq. feet
|
3 baths 4 beds |
show details | |

|
#49
Peachtree Rd
Nicholasville, KY 40356
|
1,105 sq. feet
|
2 baths 3 beds |
show details | |

|
Check over 1 million property listings on Foreclosure.com!
|
browse all offers | |||

Household type by relationship:
Households: 16,803- In family households: 14,672 (3,586 male householders, 1,308 female householders)
3,917 spouses, 4,495 children (4,048 natural, 154 adopted, 293 stepchildren), 452 grandchildren, 120 brothers or sisters, 119 parents, foster children, 181 other relatives, 397 non-relatives
- In nonfamily households: 2,131 (832 male householders (673 living alone)), 942 female householders (818 living alone)), 357 nonrelatives
- In group quarters: 109 (95 institutionalized population)
2,653 married couples with children.
630 single-parent households (128 men, 502 women).
97.4% of residents of Bryantsville speak English at home.
1.7% of residents speak Spanish at home (37% speak English very well, 9% speak English well, 10% speak English not well, 44% don't speak English at all).
0.8% of residents speak other Indo-European language at home (84% speak English very well, 16% speak English well).
0.1% of residents speak other language at home (100% speak English well).
Foreign born population: 167 (3.6%)
(25.1% of them are naturalized citizens)
| Here: | 7.7 |
| State: | 6.4 |
| Here: | 5.0 |
| State: | 4.4 |

- Bedrooms in owner-occupied houses and condos in Bryantsville, Kentucky
- 5no bedroom
- 361 bedroom
- 2112 bedrooms
- 8573 bedrooms
- 2304 bedrooms
- 385+ bedrooms

- Bedrooms in renter-occupied apartments in Bryantsville, Kentucky
- 5no bedroom
- 331 bedroom
- 1092 bedrooms
- 743 bedrooms
- 104 bedrooms
- 05+ bedrooms

- Cars and other vehicles available in Bryantsville in owner-occupied houses/condos
- 25no vehicle
- 2501 vehicle
- 7692 vehicles
- 2523 vehicles
- 534 vehicles
- 285+ vehicles

- Cars and other vehicles available in Bryantsville in renter-occupied apartments
- 23no vehicle
- 721 vehicle
- 1142 vehicles
- 163 vehicles
- 64 vehicles
- 05+ vehicles

- Rooms in owner-occupied houses in Bryantsville, Kentucky
- 01 room
- 192 rooms
- 223 rooms
- 1304 rooms
- 2965 rooms
- 4266 rooms
- 2257 rooms
- 1408 rooms
- 1199+ rooms

- Rooms in renter-occupied apartments in Bryantsville, Kentucky
- 51 room
- 62 rooms
- 203 rooms
- 724 rooms
- 575 rooms
- 296 rooms
- 377 rooms
- 58 rooms
- 09+ rooms


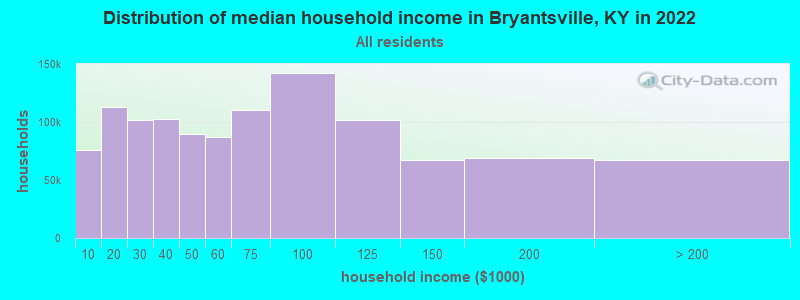
Bryantsville, KY household income distribution

- 66,272Less than $10,000
- 107,521$10,000 to $19,999
- 90,602$20,000 to $29,999
- 95,990$30,000 to $39,999
- 73,353$40,000 to $49,999
- 80,590$50,000 to $59,999
- 92,454$60,000 to $74,999
- 128,129$75,000 to $99,999
- 91,562$100,000 to $124,999
- 56,181$125,000 to $149,999
- 55,681$150,000 to $199,999
- 47,866$200,000 or more
Percentage of workers working in this county: 24.0%
Number of people working at home: 198 (8.6% of all workers)
Travel time to work (commute)
- Less than 5 minutes: 52
- 5 to 9 minutes: 108
- 10 to 14 minutes: 137
- 15 to 19 minutes: 162
- 20 to 24 minutes: 321
- 25 to 29 minutes: 116
- 30 to 34 minutes: 351
- 35 to 39 minutes: 49
- 40 to 44 minutes: 79
- 45 to 59 minutes: 479
- 60 to 89 minutes: 188
- 90 or more minutes: 96
Means of transportation to work:
- Drove a car alone: 1,681 (75.4%)
- Carpooled: 424 (19.0%)
- Bus or trolley bus: 6 (0.3%)
- Walked: 27 (1.2%)
- Worked at home: 92 (4.1%)


- Year of entry for the foreign-born population in Bryantsville, Kentucky
- 441995 to March 2000
- 51990 to 1994
- 141985 to 1989
- 01980 to 1984
- 51975 to 1979
- 91970 to 1974
- 71965 to 1969
- 11Before 1965
Most common places of birth for foreign-born residents (%):
| Bryantsville: | 47.4% (45) |
| Kentucky: | 19.3% (15,511) |
| Bryantsville: | 21.1% (20) |
| Kentucky: | 4.3% (3,464) |
| Bryantsville: | 13.7% (13) |
| Kentucky: | 8.3% (6,658) |
| Bryantsville: | 7.4% (7) |
| Kentucky: | 6.2% (4,983) |
| Bryantsville: | 5.3% (5) |
| Kentucky: | 1.2% (925) |
| Bryantsville: | 5.3% (5) |
| Kentucky: | 0.8% (627) |
Place of birth for U.S.-born residents:
- This state: 3,351
- Other state: 931
- Northeast: 138
- Midwest: 359
- South: 363
- West: 71
48% of Bryantsville residents lived in the same house 5 years ago.
Out of people who lived in different houses, 28% lived in this county.
Out of people who lived in different counties, 85% lived in Kentucky.
Education attainment for males 25 years and older:
- No schooling: 12
- Nursery to 4th grade: 15
- 5th and 6th grade: 30
- 7th and 8th grade: 85
- 9th grade: 72
- 10th grade: 50
- 11th grade: 24
- 12th grade, no diploma: 104
- High school graduate (or equivalency): 520
- Less than 1 year of college: 121
- Some college more than 1 year, no degree: 198
- Associate degree: 66
- Bachelor's degree: 121
- Master's degree: 25
- Professional school degree: 6
- Doctorate degree: 6

Education attainment for females 25 years and older:
- No schooling: 7
- Nursery to 4th grade: 0
- 5th and 6th grade: 17
- 7th and 8th grade: 80
- 9th grade: 60
- 10th grade: 23
- 11th grade: 50
- 12th grade, no diploma: 82
- High school graduate (or equivalency): 577
- Less than 1 year of college: 111
- Some college more than 1 year, no degree: 233
- Associate degree: 113
- Bachelor's degree: 74
- Master's degree: 33
- Professional school degree: 5
- Doctorate degree: 0


Housing units in structures:
- One, detached: 1,529
- One, attached: 15
- Two: 12
- 3 or 4: 4
- Mobile homes: 291
Median worth of mobile homes: $73,158
Housing units lacking complete kitchen facilities: 0.9%


- 67.8%Electricity
- 15.8%Bottled, tank, or LP gas
- 11.3%Wood
- 2.9%Fuel oil, kerosene, etc.
- 2.3%Utility gas

- 40.3%Electricity
- 35.9%Bottled, tank, or LP gas
- 13.9%Wood
- 5.6%Fuel oil, kerosene, etc.
- 4.3%Utility gas
Private vs. public school enrollment:
| Here: | 6.4% |
| Kentucky: | 11.9% |
| Here: | 6.0% |
| Kentucky: | 10.6% |
| Here: | 11.8% |
| Kentucky: | 18.1% |


