Broomall, PA (Pennsylvania) Houses and Residents
Estimated median house or condo value in 2022: $463,222 (it was $169,000 in 2000 )
Broomall:
$463,222Pennsylvania:
$245,500
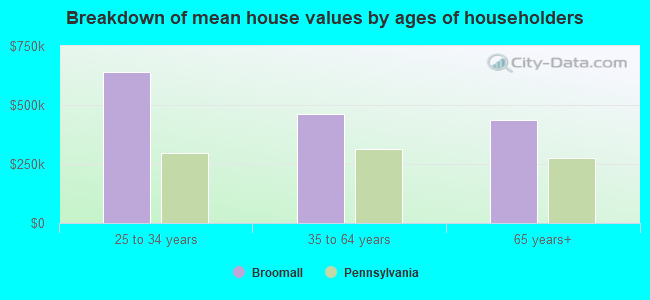
Lower value quartile - upper value quartile: $384,870 - $519,103Mean price in 2022: Detached houses: $464,908 Here:
$464,908State:
$317,202
Townhouses or other attached units: $391,447 Here:
$391,447State:
$254,369
In 2-unit structures: $616,241 Here:
$616,241State:
$249,182
In 3-to-4-unit structures: $263,120 Here:
$263,120State:
$297,446
In 5-or-more-unit structures: $150,740 Here:
$150,740State:
$320,068
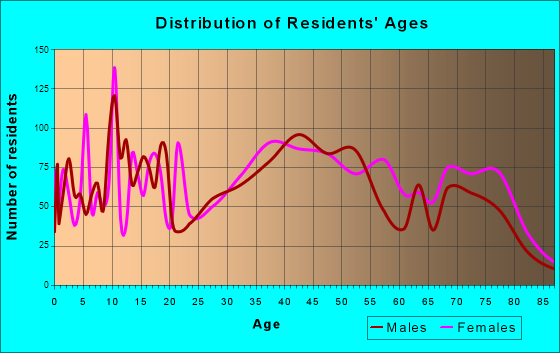
Total population: 10,789 (All urban)
Houses: 4,053 (3,926 occupied: 3,135 owner occupied, 793 renter occupied )
% of renters here:
20%State:
31%
Housing density: 1,397 houses/condos per square mile
Median price asked for vacant for-sale houses and condos in 2022 in this county: $246,679.
Median contract rent in 2022: $1,559 (lower quartile is $1,292, upper quartile is over $2,000)
Median rent asked for vacant for-rent units in 2022: $1,325
Median gross rent in Broomall, PA in 2022: $1,717
Housing units in Broomall with a mortgage: 1,950 (278 second mortgage, 0 home equity loan, 275 both second mortgage and home equity loan )Houses without a mortgage: 121
Median household income for houses/condos with a mortgage: $149,735
Median household income for apartments without a mortgage: $92,678
Median monthly housing costs: $1,689
Data:
Median house or condo value ($)
Median house or condo value ($ change since 2000)
Median house or condo value ($) - White
Median house or condo value ($) - Black or African American
Median house or condo value ($) - Asian
Median house or condo value ($) - Hispanic or Latino
Median house or condo value ($) - American Indian and Alaska Native
Median house or condo value ($) - Multirace
Median house or condo value ($) - Other Race
Median price asked for mobile homes ($)
Household density (households per square mile)
Mean house or condo value by units in structure - 1, detached ($)
Mean house or condo value by units in structure - 1, attached ($)
Mean house or condo value by units in structure - 2 ($)
Mean house or condo value by units in structure by units in structure - 3 or 4 ($)
Mean house or condo value by units in structure - 5 or more ($)
Mean house or condo value by units in structure - Boat, RV, van, etc. ($)
Mean house or condo value by units in structure - Mobile home ($)
Median contract rent ($)
Median contract rent - Lower quartile ($)
Median contract rent - Upper quartile ($)
Median gross rent ($)
Urban houses (%)
Rural houses (%)
Houses occupied (%)
Houses occupied (% change since 2000)
Houses owner occupied (%)
Houses owner occupied (% change since 2000)
Houses renter occupied (%)
Houses renter occupied (% change since 2000)
Vacant housing units - For rent (%)
Vacant housing units - For rent (% change since 2000)
Vacant housing units - For sale only (%)
Vacant housing units - For sale only (% change since 2000)
Vacant housing units - Rented or sold, not occupied (%)
Vacant housing units - Rented or sold, not occupied (% change since 2000)
Vacant housing units - For seasonal, recreational, or occasional use (%)
Vacant housing units - For seasonal, recreational, or occasional use (% change since 2000)
Vacant housing units - For migrant workers (%)
Vacant housing units - For migrant workers (% change since 2000)
Vacant housing units - Other vacant (%)
Vacant housing units - Other vacant (% change since 2000)
Median monthly housing costs ($)
Median household income for houses/condos with a mortgage ($)
Median household income for houses/condos without a mortgage ($)
Median household income ($)
Median household income ($) - White
Median household income ($) - Black or African American
Median household income ($) - Asian
Median household income ($) - Hispanic or Latino
Median household income ($) - American Indian and Alaska Native
Median household income ($) - Multirace
Median household income ($) - Other Race
Mortgage status - with mortgage (%)
Mortgage status - with second mortgage (%)
Mortgage status - with home equity loan (%)
Mortgage status - with both second mortgage and home equity loan (%)
Mortgage status - without a mortgage (%)
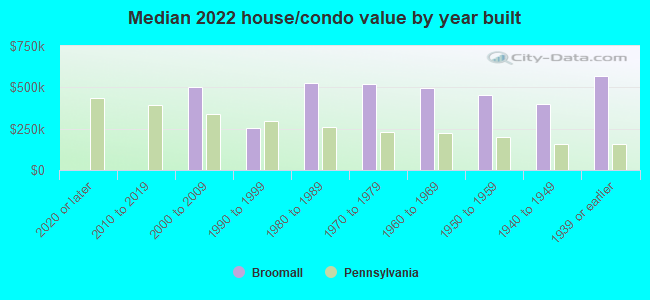
Median year house/condo built
Median year apartment built
Household type by relationship - Male householder living alone (%)
Household type by relationship - Male householder not living alone (%)
Household type by relationship - Female householder living alone (%)
Household type by relationship - Female householder not living alone (%)
Household type by relationship - Opposite-Sex spouse (%)
Household type by relationship - Same-Sex spouse (%)
Household type by relationship - Opposite-Sex unmarried partner (%)
Household type by relationship - Same-Sex unmarried partner (%)
Household type by relationship - In group quarters (%)
Size of family households - 2-person household (%)
Size of family households - 3-person household (%)
Size of family households - 4-person household (%)
Size of family households - 5-person household (%)
Size of family households - 6-person household (%)
Size of family households - 7-or-more-person household (%)
Size of nonfamily households - 1-person household (%)
Size of nonfamily households - 2-person household (%)
Size of nonfamily households - 3-person household (%)
Size of nonfamily households - 4-person household (%)
Size of nonfamily households - 5-person household (%)
Size of nonfamily households - 6-person household (%)
Size of nonfamily households - 7-or-moreperson household (%)
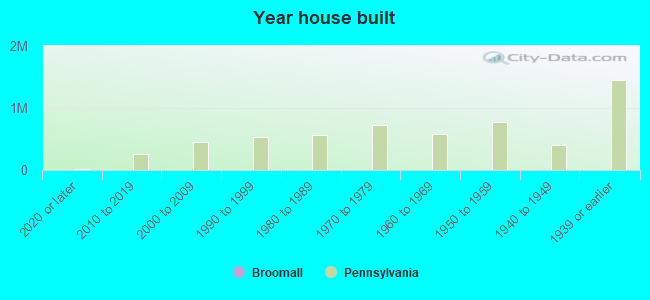
Year house built - Built 2010 or later (%)
Year house built - Built 2000 to 2009 (%)
Year house built - Built 1990 to 1999 (%)
Year house built - Built 1980 to 1989 (%)
Year house built - Built 1970 to 1979 (%)
Year house built - Built 1960 to 1969 (%)
Year house built - Built 1950 to 1959 (%)
Year house built - Built 1940 to 1949 (%)
Year house built - Built 1939 or earlier (%)
Median number of rooms in houses and condos
Median number of rooms in apartments
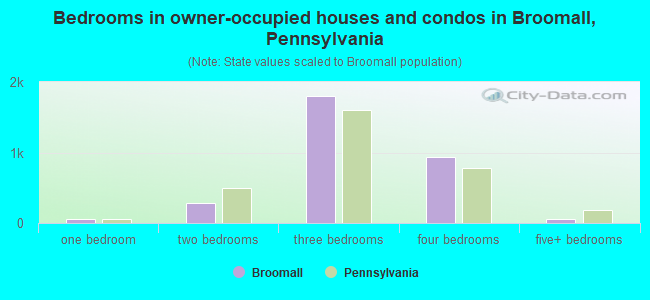
Median number of bedrooms in owner occupied houses
Mean number of bedrooms in owner occupied houses
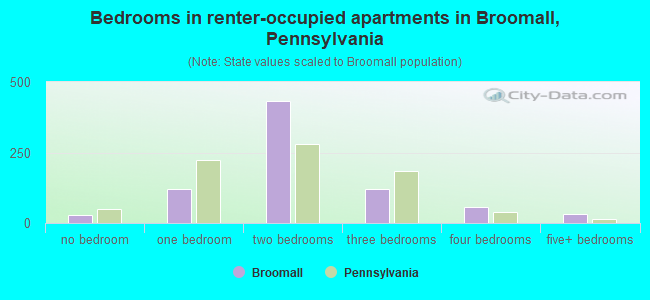
Median number of bedrooms in renter occupied houses
Mean number of bedrooms in renter occupied houses
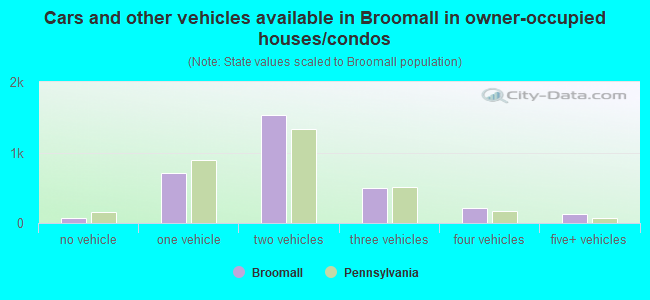
Median number of vehichles in owner occupied houses
Mean number of vehichles in owner occupied houses
Median number of vehichles in renter occupied houses
Mean number of vehichles in renter occupied houses
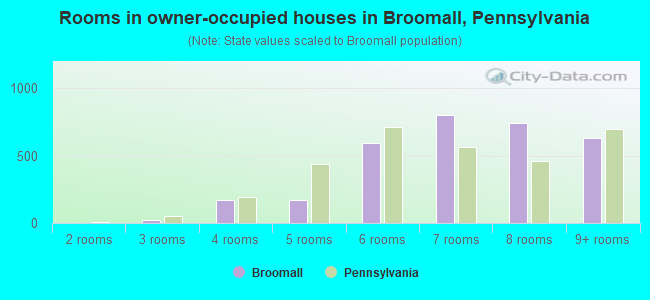
Rooms in owner-occupied houses - 1 room (%)
Rooms in owner-occupied houses - 2 rooms (%)
Rooms in owner-occupied houses - 3 rooms (%)
Rooms in owner-occupied houses - 4 rooms (%)
Rooms in owner-occupied houses - 5 rooms (%)
Rooms in owner-occupied houses - 6 rooms (%)
Rooms in owner-occupied houses - 7 rooms (%)
Rooms in owner-occupied houses - 8 rooms (%)
Rooms in owner-occupied houses - 9+ rooms (%)
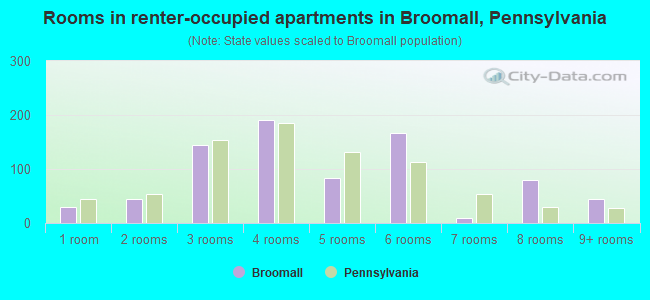
Rooms in renter-occupied houses - 1 room (%)
Rooms in renter-occupied houses - 2 rooms (%)
Rooms in renter-occupied houses - 3 rooms (%)
Rooms in renter-occupied houses - 4 rooms (%)
Rooms in renter-occupied houses - 5 rooms (%)
Rooms in renter-occupied houses - 6 rooms (%)
Rooms in renter-occupied houses - 7 rooms (%)
Rooms in renter-occupied houses - 8 rooms (%)
Rooms in renter-occupied houses - 9+ rooms (%)
Bedrooms in owner-occupied houses - no bedrooms (%)
Bedrooms in owner-occupied houses - 1 bedroom (%)
Bedrooms in owner-occupied houses - 2 bedrooms (%)
Bedrooms in owner-occupied houses - 3 bedrooms (%)
Bedrooms in owner-occupied houses - 4 bedrooms (%)
Bedrooms in owner-occupied houses - 5+ bedrooms (%)
Bedrooms in renter-occupied houses - no bedrooms (%)
Bedrooms in renter-occupied houses - 1 bedroom (%)
Bedrooms in renter-occupied houses - 2 bedrooms (%)
Bedrooms in renter-occupied houses - 3 bedrooms (%)
Bedrooms in renter-occupied houses - 4 bedrooms (%)
Bedrooms in renter-occupied houses - 5+ bedrooms (%)
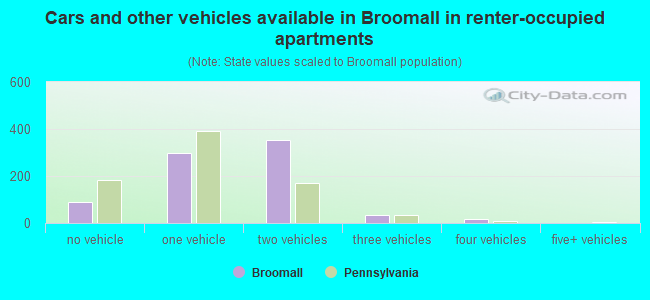
Vehicles available in owner-occupied houses - no vehicle available (%)
Vehicles available in owner-occupied houses - 1 vehicle available(%)
Vehicles available in owner-occupied houses - 2 Vehicles available (%)
Vehicles available in owner-occupied houses - 3 Vehicles available (%)
Vehicles available in owner-occupied houses - 4 Vehicles available (%)
Vehicles available in owner-occupied houses - 5+ Vehicles available (%)
Vehicles available in renter-occupied houses - no vehicle available (%)
Vehicles available in renter-occupied houses - 1 vehicle available (%)
Vehicles available in renter-occupied houses - 2 Vehicles available (%)
Vehicles available in renter-occupied houses - 3 Vehicles available (%)
Vehicles available in renter-occupied houses - 4 Vehicles available (%)
Vehicles available in renter-occupied houses - 5+ Vehicles available (%)
Housing units in structures - 1, detached (%)
Housing units in structures - 1, attached (%)
Housing units in structures - 2 (%)
Housing units in structures - 3 or 4 (%)
Housing units in structures - 5 to 9 (%)
Housing units in structures - 10 to 19 (%)
Housing units in structures - 20 to 49 (%)
Housing units in structures - 50 or more (%)
Housing units in structures - Mobile home (%)
Housing units in structures - Boat, RV, van, etc. (%)
Housing units in structures - Owners - 1, detached (%)
Housing units in structures - Owners - 1, attached (%)
Housing units in structures - Owners - 2 (%)
Housing units in structures - Owners - 3 or 4 (%)
Housing units in structures - Owners - 5 to 9 (%)
Housing units in structures - Owners - 10 to 19 (%)
Housing units in structures - Owners - 20 to 49 (%)
Housing units in structures - Owners - 50 or more (%)
Housing units in structures - Owners - Mobile home (%)
Housing units in structures - Owners - Boat, RV, van, etc. (%)
Housing units in structures - Renters - 1, detached (%)
Housing units in structures - Renters - 1, attached (%)
Housing units in structures - Renters - 2 (%)
Housing units in structures - Renters - 3 or 4 (%)
Housing units in structures - Renters - 5 to 9 (%)
Housing units in structures - Renters - 10 to 19 (%)
Housing units in structures - Renters - 20 to 49 (%)
Housing units in structures - Renters - 50 or more (%)
Housing units in structures - Renters - Mobile home (%)
Housing units in structures - Renters - Boat, RV, van, etc. (%)
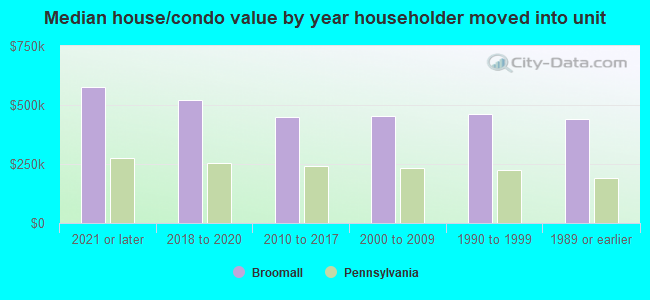
House/condo owner moved in on average (years ago)
Renter moved in on average (years ago)
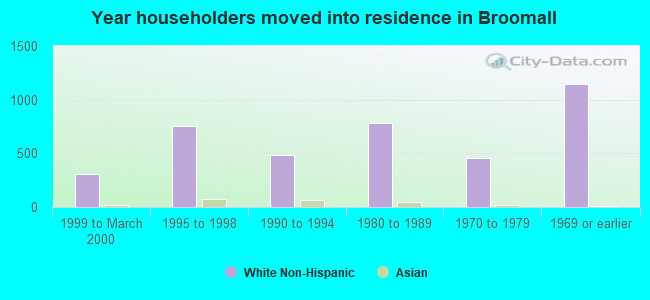
Year householder moved into unit - Moved in 1999 to March 2000 (%)
Year householder moved into unit - Moved in 1999 to March 2000 (%) - White
Year householder moved into unit - Moved in 1999 to March 2000 (%) - Black or African American
Year householder moved into unit - Moved in 1999 to March 2000 (%) - Asian
Year householder moved into unit - Moved in 1999 to March 2000 (%) - Hispanic or Latino
Year householder moved into unit - Moved in 1999 to March 2000 (%) - American Indian and Alaska Native
Year householder moved into unit - Moved in 1999 to March 2000 (%) - Multirace
Year householder moved into unit - Moved in 1999 to March 2000 (%) - Other Race
Year householder moved into unit - Moved in 1995 to 1998 (%)
Year householder moved into unit - Moved in 1995 to 1998 (%) - White
Year householder moved into unit - Moved in 1995 to 1998 (%) - Black or African American
Year householder moved into unit - Moved in 1995 to 1998 (%) - Asian
Year householder moved into unit - Moved in 1995 to 1998 (%) - Hispanic or Latino
Year householder moved into unit - Moved in 1995 to 1998 (%) - American Indian and Alaska Native
Year householder moved into unit - Moved in 1995 to 1998 (%) - Multirace
Year householder moved into unit - Moved in 1995 to 1998 (%) - Other Race
Year householder moved into unit - Moved in 1990 to 1994 (%)
Year householder moved into unit - Moved in 1990 to 1994 (%) - White
Year householder moved into unit - Moved in 1990 to 1994 (%) - Black or African American
Year householder moved into unit - Moved in 1990 to 1994 (%) - Asian
Year householder moved into unit - Moved in 1990 to 1994 (%) - Hispanic or Latino
Year householder moved into unit - Moved in 1990 to 1994 (%) - American Indian and Alaska Native
Year householder moved into unit - Moved in 1990 to 1994 (%) - Multirace
Year householder moved into unit - Moved in 1990 to 1994 (%) - Other Race
Year householder moved into unit - Moved in 1980 to 1989 (%)
Year householder moved into unit - Moved in 1980 to 1989 (%) - White
Year householder moved into unit - Moved in 1980 to 1989 (%) - Black or African American
Year householder moved into unit - Moved in 1980 to 1989 (%) - Asian
Year householder moved into unit - Moved in 1980 to 1989 (%) - Hispanic or Latino
Year householder moved into unit - Moved in 1980 to 1989 (%) - American Indian and Alaska Native
Year householder moved into unit - Moved in 1980 to 1989 (%) - Multirace
Year householder moved into unit - Moved in 1980 to 1989 (%) - Other Race
Year householder moved into unit - Moved in 1970 to 1979 (%)
Year householder moved into unit - Moved in 1970 to 1979 (%) - White
Year householder moved into unit - Moved in 1970 to 1979 (%) - Black or African American
Year householder moved into unit - Moved in 1970 to 1979 (%) - Asian
Year householder moved into unit - Moved in 1970 to 1979 (%) - Hispanic or Latino
Year householder moved into unit - Moved in 1970 to 1979 (%) - American Indian and Alaska Native
Year householder moved into unit - Moved in 1970 to 1979 (%) - Multirace
Year householder moved into unit - Moved in 1970 to 1979 (%) - Other Race
Year householder moved into unit - Moved in 1969 or earlier (%)
Year householder moved into unit - Moved in 1969 or earlier (%) - White
Year householder moved into unit - Moved in 1969 or earlier (%) - Black or African American
Year householder moved into unit - Moved in 1969 or earlier (%) - Asian
Year householder moved into unit - Moved in 1969 or earlier (%) - Hispanic or Latino
Year householder moved into unit - Moved in 1969 or earlier (%) - American Indian and Alaska Native
Year householder moved into unit - Moved in 1969 or earlier (%) - Multirace
Year householder moved into unit - Moved in 1969 or earlier (%) - Other Race
Housing units lacking complete plumbing facilities (%)
Housing units lacking complete kitchen facilities (%)
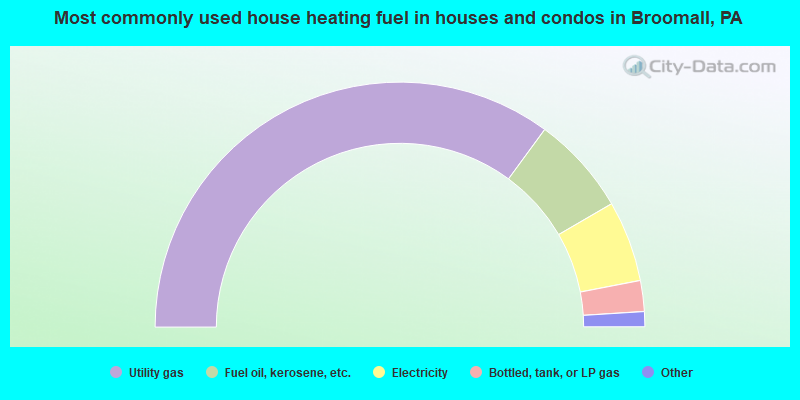
House heating fuel used in houses and condos - Utility gas (%)
House heating fuel used in houses and condos - Bottled, tank, or LP gas (%)
House heating fuel used in houses and condos - Electricity (%)
House heating fuel used in houses and condos - Fuel oil, kerosene, etc. (%)
House heating fuel used in houses and condos - Coal or coke (%)
House heating fuel used in houses and condos - Wood (%)
House heating fuel used in houses and condos - Solar energy (%)
House heating fuel used in houses and condos - Other fuel (%)
House heating fuel used in houses and condos - No fuel used (%)
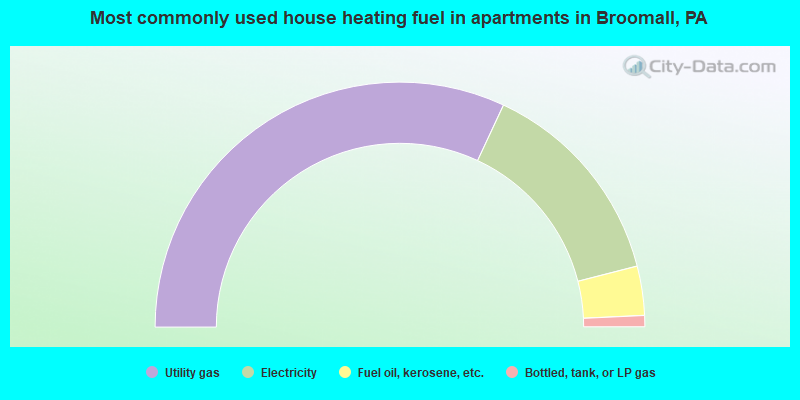
House heating fuel used in apartments - Utility gas (%)
House heating fuel used in apartments - Bottled, tank, or LP gas (%)
House heating fuel used in apartments - Electricity (%)
House heating fuel used in apartments - Fuel oil, kerosene, etc. (%)
House heating fuel used in apartments - Coal or coke (%)
House heating fuel used in apartments - Wood (%)
House heating fuel used in apartments - Solar energy (%)
House heating fuel used in apartments - Other fuel (%)
House heating fuel used in apartments - No fuel used (%)
Latest news about housing in Broomall, PA collected exclusively by city-data.com from local newspapers, TV, and radio stations
Median year house/condo built: 1957Median year apartment built: 1966Household type by relationship:
Households: 10,660
Male householders: 2,025 (238 living alone ), Female householders: 1,886 (547 living alone )2,422 spouses (2,409 opposite-sex spouses ), 186 unmarried partners , (186 opposite-sex unmarried partners ), 3,413 children (3,287 natural , 31 adopted , 93 stepchildren ), 314 grandchildren , 17 brothers or sisters , 134 parents , 0 foster children , 85 other relatives , 143 non-relatives In group quarters: 27
Size of family households: 1,252 2-persons , 730 3-persons , 524 4-persons , 312 5-persons , 63 6-persons , 24 7-or-more-persons .
Size of nonfamily households: 826 1-person , 178 2-persons .
1,683 married couples with children. single-parent households (77 men , 156 women ).
87.1% of residents of Broomall speak English at home. of residents speak Spanish at home (45% speak English very well , 55% speak English well ).of residents speak other Indo-European language at home (78% speak English very well , 18% speak English well , 3% speak English not well ).of residents speak Asian or Pacific Island language at home (63% speak English very well , 11% speak English well , 23% speak English not well , 2% don't speak English at all ).of residents speak other language at home (53% speak English very well , 38% speak English well , 9% speak English not well ).
Foreign born population: 943 (8.8%)of them are naturalized citizens )
Median number of rooms in houses and condos:
Median number of rooms in apartments
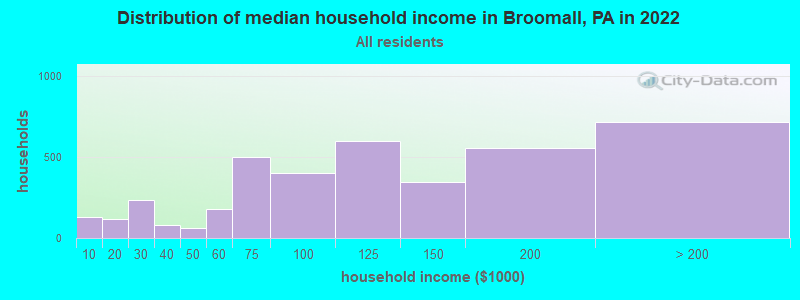
Broomall, PA household income distribution 132 Less than $10,000119 $10,000 to $19,999237 $20,000 to $29,99981 $30,000 to $39,99962 $40,000 to $49,999180 $50,000 to $59,999501 $60,000 to $74,999401 $75,000 to $99,999598 $100,000 to $124,999344 $125,000 to $149,999555 $150,000 to $199,999718 $200,000 or more
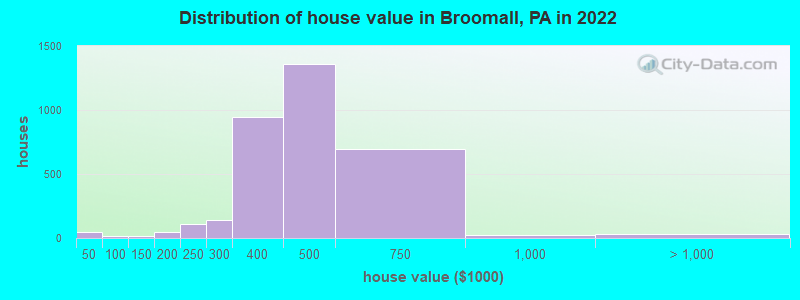
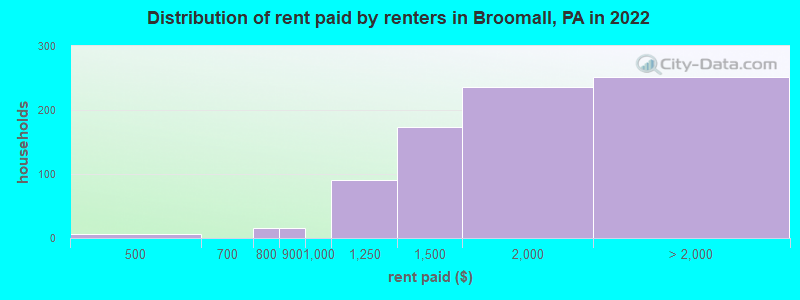
Home value of owner - occupied houses in 2022 in Broomall, PA 8 Less than $10,00028 $25,000 to $29,99913 $40,000 to $49,99912 $100,000 to $124,9994 $125,000 to $149,99910 $150,000 to $174,99937 $175,000 to $199,999108 $200,000 to $249,999138 $250,000 to $299,999944 $300,000 to $399,9991,361 $400,000 to $499,999696 $500,000 to $749,99921 $750,000 to $999,99933 $2,000,000 or moreRent paid by renters in 2022 in Broomall, PA 6 $450 to $49916 $700 to $74916 $800 to $89990 $1,000 to $1,249174 $1,250 to $1,499236 $1,500 to $1,999214 $2,000 to $2,4997 $2,500 to $2,99929 No cash rent
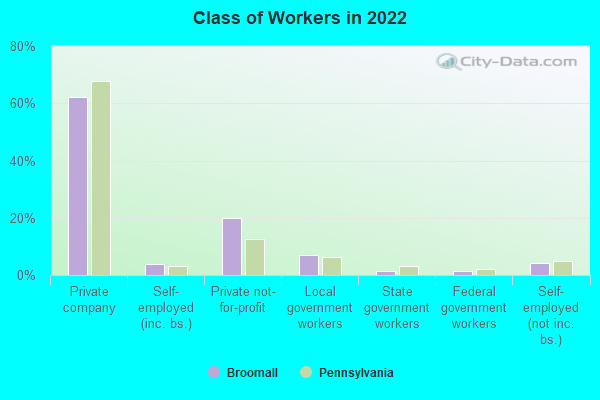
Percentage of workers working in this county: 55.9%Number of people working at home: 853 (15.1% of all workers )
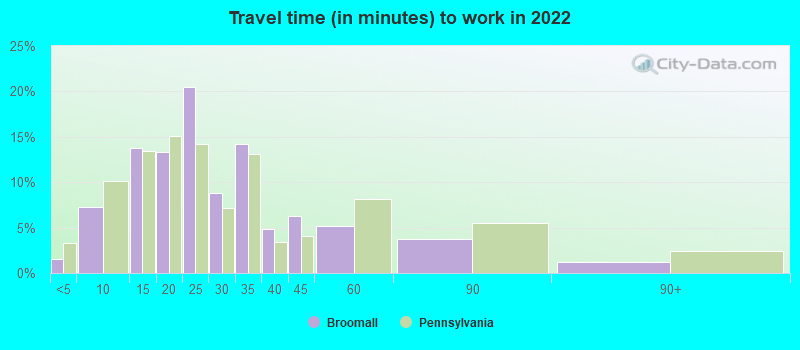
Travel time to work (commute)
Less than 5 minutes: 545 to 9 minutes: 39010 to 14 minutes: 60015 to 19 minutes: 72720 to 24 minutes: 65025 to 29 minutes: 41030 to 34 minutes: 84235 to 39 minutes: 13140 to 44 minutes: 23445 to 59 minutes: 34160 to 89 minutes: 34390 or more minutes: 110
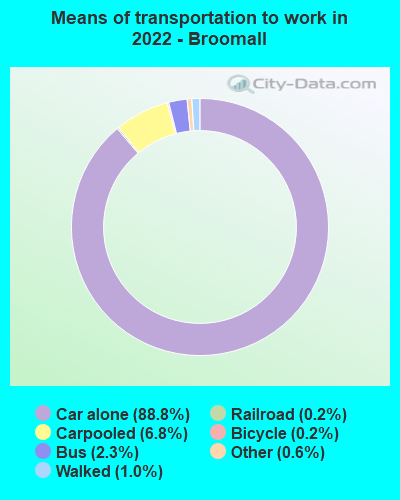
Means of transportation to work:
Drove a car alone: 5,006 (76.1%)Carpooled: 357 (5.4%)Bus : 77 (1.2%)Light rail, streetcar or trolley : 14 (0.2%)Taxi: 59 (0.9%)Bicycle: 13 (0.2%)Walked: 67 (1.0%)Worked at home: 853 (13.0%)
Unemployment by race in 2022
Unemployment rate for White non-Hispanic residents 1.9% Males1.3% FemalesUnemployment rate for Black residents 15.6% Males17.7% FemalesUnemployment rate for Asian residents 1.8% Males2.7% FemalesUnemployment rate for other race residents 10.1% MalesUnemployment rate for two or more race residents 28.2% Males39.8% FemalesUnemployment rate for Hispanic or Latino residents 4.0% Males
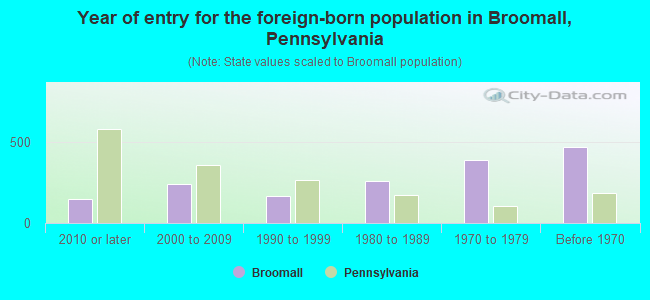
Year of entry for the foreign-born population in Broomall, Pennsylvania
148 2010 or later 239 2000 to 2009 164 1990 to 1999 261 1980 to 1989 388 1970 to 1979 468 Before 1970
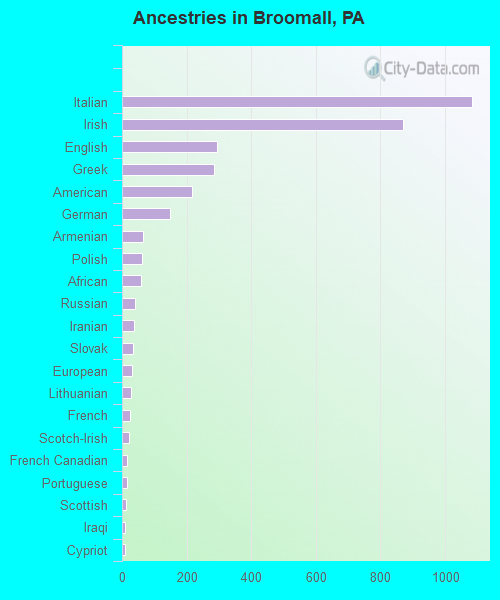
First ancestries reported:
Italian: 1,082 (25.5%)
Irish: 871 (20.5%)
English: 294 (6.9%)
Greek: 286 (6.7%)
American: 216 (5.1%)
German: 149 (3.5%)
Armenian: 64 (1.5%)
Polish: 63 (1.5%)
African: 59 (1.4%)
Russian: 41 (1.0%)
Iranian: 37 (0.9%)
Slovak: 35 (0.8%)
European: 30 (0.7%)
Lithuanian: 28 (0.7%)
French: 26 (0.6%)
Scotch-Irish: 22 (0.5%)
French Canadian: 14 (0.3%)
Portuguese: 14 (0.3%)
Scottish: 11 (0.3%)
Iraqi: 10 (0.2%)
Cypriot: 10 (0.2%)
Welsh: 9 (0.2%)
Northern European: 8 (0.2%)
Ukrainian: 8 (0.2%)
Croatian: 7 (0.2%)
Dutch: 6 (0.1%)
Swedish: 3 (0.07%)
Lebanese: 1 (0.02%) Most common places of birth for foreign-born residents (%): Korea Broomall:
20.4% (215)Pennsylvania:
2.9% (27,433)
China, excluding Hong Kong and Taiwan Broomall:
15.7% (165)Pennsylvania:
7.2% (67,704)
India Broomall:
11.8% (124)Pennsylvania:
10.7% (100,596)
Vietnam Broomall:
9.6% (101)Pennsylvania:
3.3% (31,542)
Ireland Broomall:
6.7% (70)Pennsylvania:
0.4% (4,198)
Iran Broomall:
4.0% (42)Pennsylvania:
0.4% (4,204)
Italy Broomall:
4.0% (42)Pennsylvania:
1.8% (16,884)
Greece Broomall:
3.4% (36)Pennsylvania:
0.6% (5,438)
United Kingdom, excluding England and Scotland Broomall:
3.1% (33)Pennsylvania:
1.1% (10,331)
Brazil Broomall:
2.7% (28)Pennsylvania:
1.4% (13,077)
Iraq Broomall:
2.5% (26)Pennsylvania:
0.3% (2,395)
Europe, n.e.c. Broomall:
1.8% (19)Pennsylvania:
0.0% (167)
Switzerland Broomall:
1.8% (19)Pennsylvania:
0.1% (826)
Place of birth for U.S.-born residents:
This state: 8,326Other state: 1,264Northeast: 548Midwest: 221South: 340West: 154 91.0% of Broomall residents lived in the same house 1 years ago.
Out of people who lived in different houses, 39.0% lived in this county.
Out of people who lived in different counties, 75.3% lived in Pennsylvania.
Broomall:
91.0%State average:
89.3%
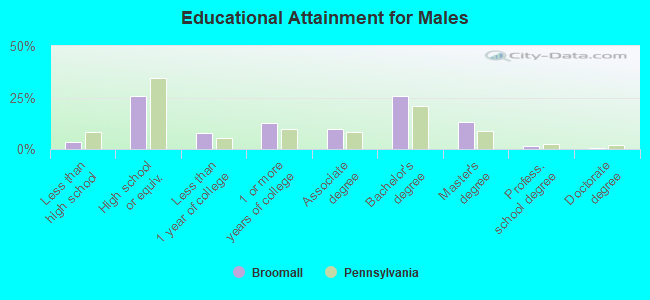
Education attainment for males 25 years and older:
No schooling: 37Nursery to 4th grade: 85th and 6th grade: 17th and 8th grade: 09th grade: 5310th grade: 1011th grade: 012th grade, no diploma: 6High school graduate (or equivalency): 917Less than 1 year of college: 286Some college more than 1 year, no degree: 457Associate degree: 348Bachelor's degree: 926Master's degree: 473Professional school degree: 56Doctorate degree: 20
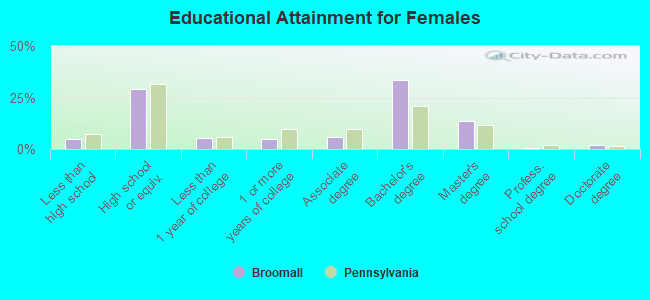
Education attainment for females 25 years and older:
No schooling: 9Nursery to 4th grade: 135th and 6th grade: 417th and 8th grade: 249th grade: 1710th grade: 3911th grade: 712th grade, no diploma: 51High school graduate (or equivalency): 1,168Less than 1 year of college: 214Some college more than 1 year, no degree: 199Associate degree: 236Bachelor's degree: 1,359Master's degree: 550Professional school degree: 28Doctorate degree: 88
Housing units in structures:
One, detached: 3,208One, attached: 71Two: 1383 or 4: 21810 to 19: 5620 to 49: 20550 or more: 114Mobile homes: 40Housing units lacking complete plumbing facilities in 2022: 1.3%Housing units lacking complete kitchen facilities in 2022: 1.8%House/condo owner moved in on average 19 years ago
Renter moved in on average 3 years ago
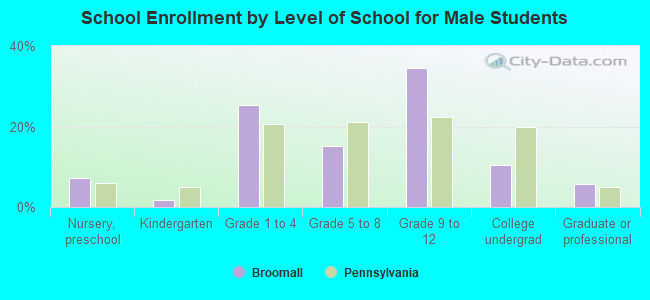
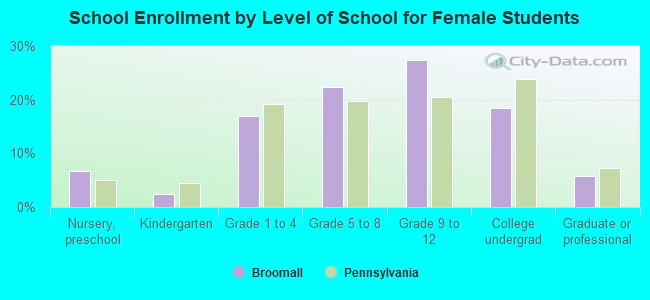
Private vs. public school enrollment:
Students in private schools in grades 1 to 8 (elementary and middle school): 152 Here:
17.3%Pennsylvania:
15.7%
Students in private schools in grades 9 to 12 (high school): 69 Here:
10.1%Pennsylvania:
13.4%
Students in private undergraduate colleges: 83 Here:
26.3%Pennsylvania:
39.8%