Housing density: 13,184 houses/condos per square mile
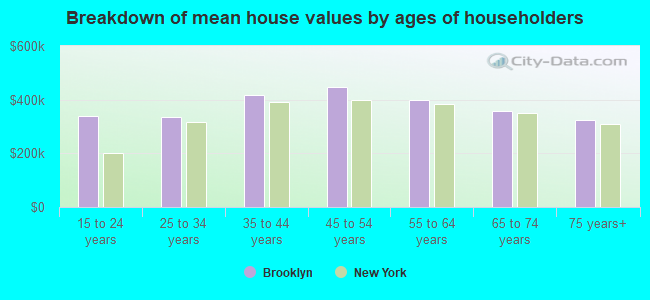
Median price asked for vacant for-sale houses and condos in 2022 in this county: $877,448.
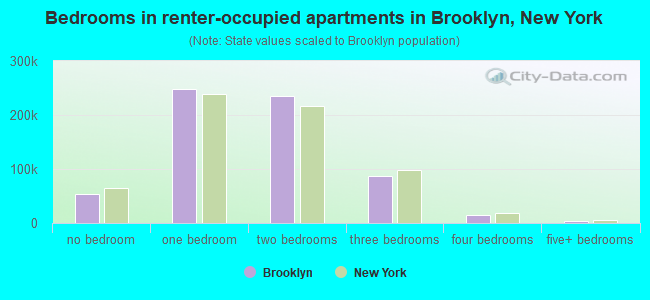
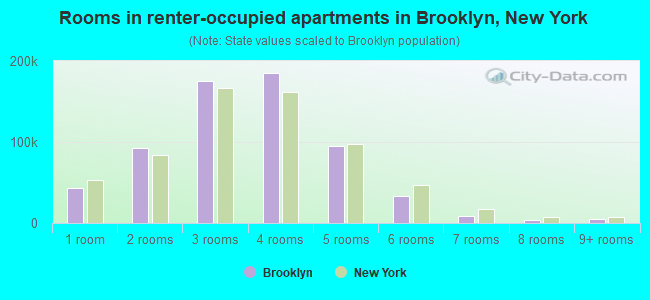
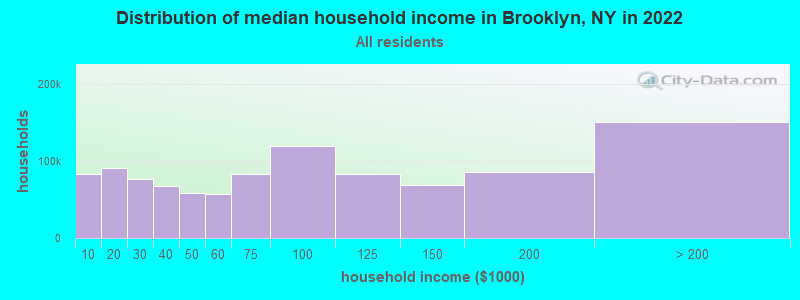
Median contract rent in 2022: $1,578 (lower quartile is $1,034, upper quartile is over $2,000)
Median rent asked for vacant for-rent units in 2022: $1,644
Median gross rent in Brooklyn, NY in 2022: $1,688
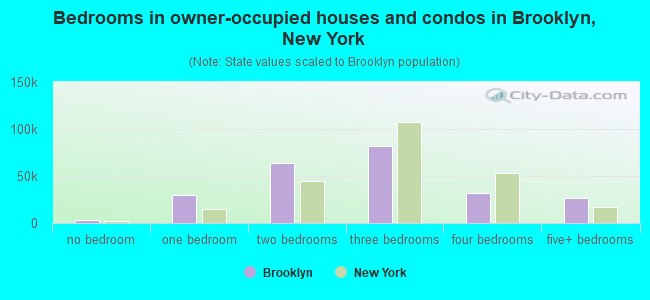
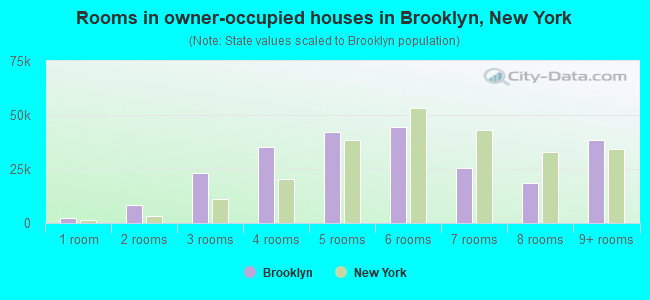
Housing units in Brooklyn with a mortgage: 59,793 (5,098 second mortgage, 4,512 home equity loan, 183 both second mortgage and home equity loan) Houses without a mortgage: 29,251
In family households: 2,019,974 (294,400 male householders, 278,963 female householders)
333,127 spouses, 783,215 children (755,146 natural, 13,321 adopted, 14,748 stepchildren), 69,604 grandchildren, 53,395 brothers or sisters, 46,312 parents, foster children, 73,365 other relatives, 67,068 non-relatives
In nonfamily households: 449,117 (150,518 male householders (109,973 living alone)), 192,975 female householders (156,263 living alone)), 105,624 nonrelatives
In group quarters: 35,609 (13,297 institutionalized population)
342,412 married couples with children.
219,229 single-parent households (26,770 men, 192,459 women).
53.3% of residents of Brooklyn speak English at home.
18.0% of residents speak Spanish at home (52% speak English very well, 21% speak English well, 19% speak English not well, 8% don't speak English at all).
20.0% of residents speak other Indo-European language at home (49% speak English very well, 28% speak English well, 18% speak English not well, 5% don't speak English at all).
5.9% of residents speak Asian or Pacific Island language at home (30% speak English very well, 26% speak English well, 28% speak English not well, 16% don't speak English at all).
2.9% of residents speak other language at home (65% speak English very well, 24% speak English well, 10% speak English not well, 2% don't speak English at all).
Foreign born population: 907,780 (35.0%)
(63.3% of them are naturalized citizens)
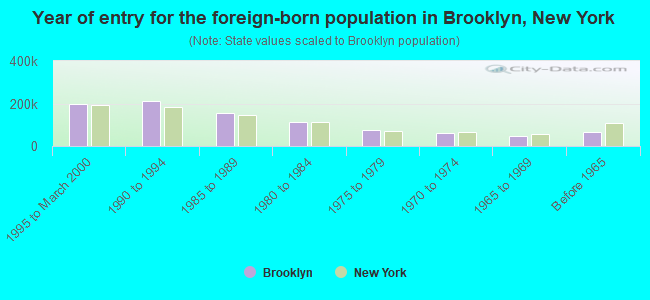
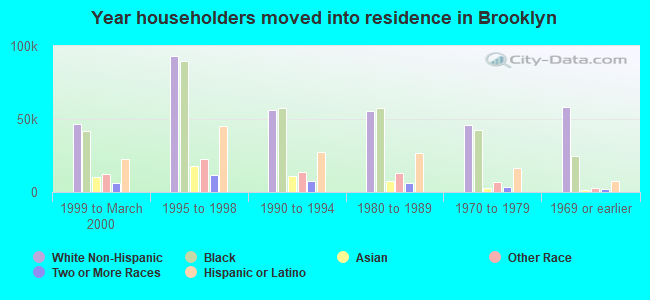
Year of entry for the foreign-born population in Brooklyn, New York
197,2051995 to March 2000
213,8981990 to 1994
155,5641985 to 1989
114,8181980 to 1984
73,2431975 to 1979
62,4131970 to 1974
46,4851965 to 1969
68,143Before 1965
Most common places of birth for foreign-born residents (%):
Jamaica
Brooklyn:
7.9% (73,580)
New York:
5.9% (226,470)
China, excluding Hong Kong and Taiwan
Brooklyn:
7.8% (72,673)
New York:
6.0% (233,766)
Haiti
Brooklyn:
6.6% (61,267)
New York:
3.2% (125,475)
Dominican Republic
Brooklyn:
6.4% (59,362)
New York:
10.5% (408,086)
Ukraine
Brooklyn:
6.0% (55,573)
New York:
2.1% (82,238)
Trinidad and Tobago
Brooklyn:
5.6% (52,256)
New York:
2.5% (98,473)
Russia
Brooklyn:
5.6% (51,781)
New York:
2.4% (94,595)
Guyana
Brooklyn:
5.0% (46,425)
New York:
3.7% (142,154)
Other Caribbean
Brooklyn:
4.6% (42,498)
New York:
2.0% (78,538)
Mexico
Brooklyn:
4.3% (39,605)
New York:
4.2% (161,189)
Poland
Brooklyn:
3.8% (35,382)
New York:
2.4% (93,187)
Italy
Brooklyn:
2.7% (24,719)
New York:
3.8% (147,729)
Ecuador
Brooklyn:
2.2% (20,256)
New York:
3.6% (139,226)
Barbados
Brooklyn:
2.1% (19,249)
New York:
0.8% (30,660)
Pakistan
Brooklyn:
1.8% (16,872)
New York:
1.3% (51,055)
Other Eastern Europe
Brooklyn:
1.8% (16,565)
New York:
1.4% (53,825)
Panama
Brooklyn:
1.6% (15,055)
New York:
0.7% (26,202)
Place of birth for U.S.-born residents:
This state: 1,227,839
Other state: 200,277
Northeast: 47,307
Midwest: 24,602
South: 112,338
West: 16,030
68% of Brooklyn residents lived in the same house 5 years ago. Out of people who lived in different houses, 76% lived in this county. Out of people who lived in different counties, 62% lived in New York.
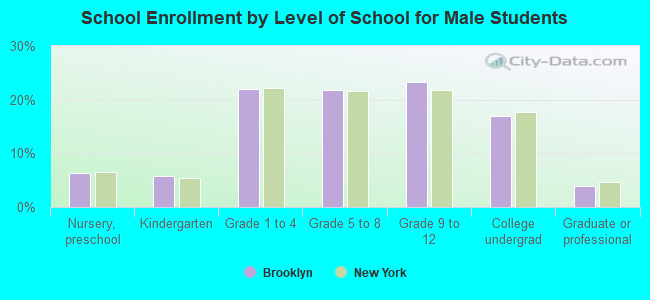
Education attainment for males 25 years and older:
No schooling: 23,076
Nursery to 4th grade: 8,307
5th and 6th grade: 25,113
7th and 8th grade: 31,587
9th grade: 22,267
10th grade: 25,273
11th grade: 23,687
12th grade, no diploma: 54,784
High school graduate (or equivalency): 179,520
Less than 1 year of college: 31,491
Some college more than 1 year, no degree: 70,916
Associate degree: 36,593
Bachelor's degree: 95,341
Master's degree: 39,394
Professional school degree: 17,854
Doctorate degree: 6,856
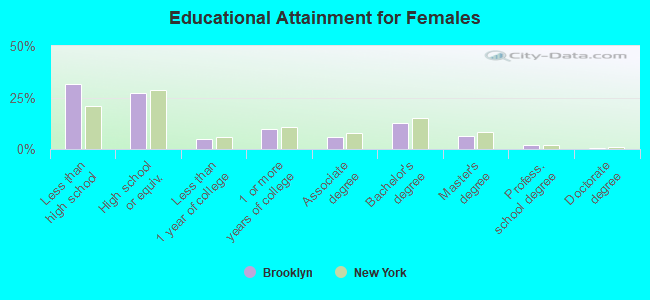
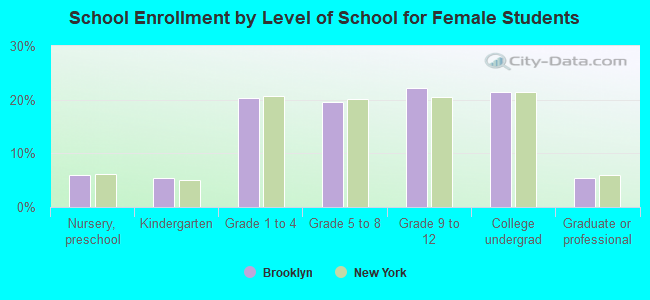
Education attainment for females 25 years and older:
No schooling: 30,268
Nursery to 4th grade: 12,096
5th and 6th grade: 30,905
7th and 8th grade: 41,838
9th grade: 28,325
10th grade: 29,472
11th grade: 31,735
12th grade, no diploma: 65,573
High school graduate (or equivalency): 235,348
Less than 1 year of college: 39,790
Some college more than 1 year, no degree: 83,519
Associate degree: 52,137
Bachelor's degree: 106,762
Master's degree: 53,592
Professional school degree: 14,988
Doctorate degree: 4,463
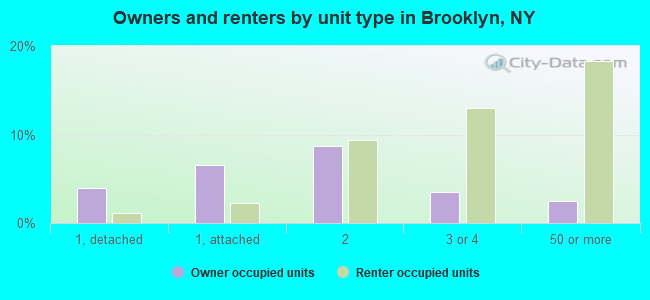
Housing units in structures:
One, detached: 46,988
One, attached: 80,622
Two: 168,830
3 or 4: 159,419
5 to 9: 103,325
10 to 19: 55,451
20 to 49: 126,382
50 or more: 188,964
Mobile homes: 637
Boats, RVs, vans, etc.: 248
Median worth of mobile homes: $95,900
Housing units lacking complete plumbing facilities: 1.7%
Housing units lacking complete kitchen facilities: 1.5%