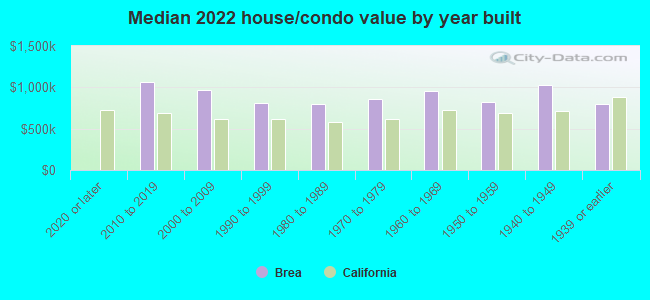
Brea, CA (California) Houses and Residents
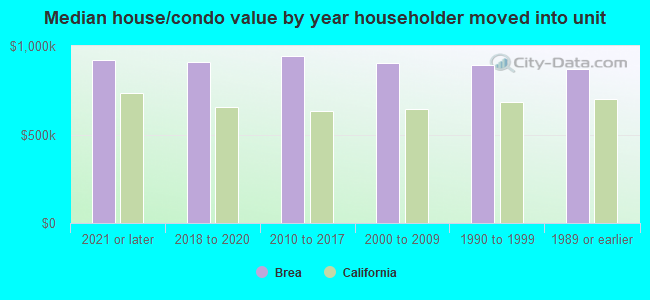
| Brea: | $910,042 |
| California: | $715,900 |
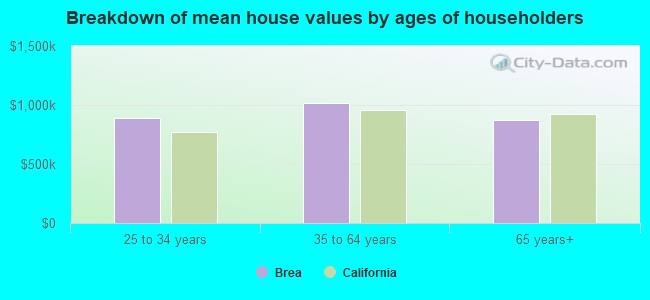
Mean price in 2022:
Detached houses: $1,064,736
Here: $1,064,736 State: $988,808 Townhouses or other attached units: $627,095
Here: $627,095 State: $838,546 In 3-to-4-unit structures: $371,438
Here: $371,438 State: $824,253 In 5-or-more-unit structures: $570,304
Here: $570,304 State: $730,996 Mobile homes: $128,749
Here: $128,749 State: $184,506
Total population: 41,508 (Urban population: 34,463, Rural population: 659 (16 farm, 643 nonfarm))
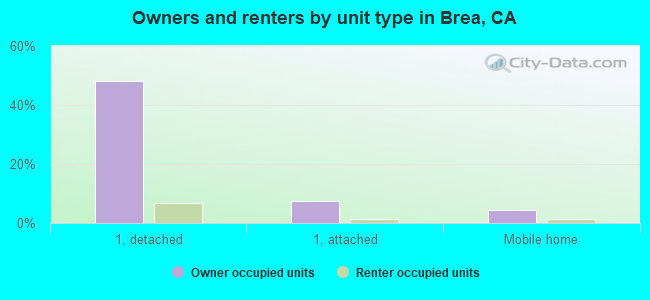
Houses: 17,484 (16,682 occupied: 10,210 owner occupied, 6,536 renter occupied)
| % of renters here: | 39% |
| State: | 44% |
Housing density: 1,658 houses/condos per square mile
Median price asked for vacant for-sale houses and condos in 2022: $1,040,610.
Median contract rent in 2022: over $2,000 (lower quartile is $1,597, upper quartile is over $2,000)
Median rent asked for vacant for-rent units in 2022: $1,961
Median gross rent in Brea, CA in 2022: over $2,000
Housing units in Brea with a mortgage: 7,022 (621 second mortgage, 0 home equity loan, 539 both second mortgage and home equity loan)
Houses without a mortgage: 88
Median household income for houses/condos with a mortgage: $160,747
Median household income for apartments without a mortgage: $95,115
Median monthly housing costs: $2,304
Compare current foreclosures in Brea, CA:
| Photo | Address | Area | Beds / Baths | Price | Details |
|---|---|---|---|---|---|

|
#1
Chestnut Ave
Brea, CA 92821
|
2,222 sq. feet
|
3 baths 5 beds |
show details | |

|
#2
Briarwood Dr
Brea, CA 92821
|
1,361 sq. feet
|
2 baths 3 beds |
show details | |

|
#3
Walling Ave
Brea, CA 92821
|
1,262 sq. feet
|
1 baths 3 beds |
show details | |

|
#4
S Madrona Ave # B
Brea, CA 92821
|
325 sq. feet
|
2 baths 7 beds |
show details | |

|
#5
Verbena Ln
Brea, CA 92823
|
1,662 sq. feet
|
2 baths 3 beds |
show details | |

|
#6
Delphia Ave
Brea, CA 92821
|
2,292 sq. feet
|
2 baths 4 beds |
show details | |

|
#7
Mango St
Brea, CA 92821
|
1,043 sq. feet
|
1 baths 2 beds |
show details | |

|
#8
Bluegrass St
Brea, CA 92821
|
3,419 sq. feet
|
3 baths 4 beds |
show details | |

|
#9
Leafwood Ct
Brea, CA 92821
|
1,497 sq. feet
|
3 baths 3 beds |
show details | |

|
#10
Skywood St
Brea, CA 92821
|
1,493 sq. feet
|
2 baths 3 beds |
show details |
| Photo | Address | Area | Beds / Baths | Price | Details |
|---|---|---|---|---|---|

|
#11
De Jur St
Brea, CA 92821
|
1,398 sq. feet
|
2 baths 4 beds |
show details | |

|
#12
Laurel Ave
Brea, CA 92821
|
972 sq. feet
|
1 baths 2 beds |
show details | |

|
#13
E Ash St
Brea, CA 92821
|
870 sq. feet
|
2 baths 3 beds |
show details | |

|
#14
E Imperial Hwy # 1078
Brea, CA 92821
|
- sq. feet
|
- baths - beds |
show details | |

|
#15
W Central Ave # 6
Brea, CA 92821
|
- sq. feet
|
- baths - beds |
show details | |

|
#16
W Imperial Hwy Ste H242
Brea, CA 92821
|
- sq. feet
|
- baths - beds |
show details | |

|
#17
W Central Ave Spc 4
Brea, CA 92821
|
- sq. feet
|
- baths - beds |
show details | |

|
#18
E Imperial Hwy Ste D5
Brea, CA 92821
|
- sq. feet
|
- baths - beds |
show details | |

|
#19
S Brea Blvd Apt 314
Brea, CA 92821
|
- sq. feet
|
- baths - beds |
show details | |

|
#20
S Poplar Ave Apt 6
Brea, CA 92821
|
- sq. feet
|
- baths - beds |
show details |
| Photo | Address | Area | Beds / Baths | Price | Details |
|---|---|---|---|---|---|

|
#21
S Walnut Ave Apt D
Brea, CA 92821
|
- sq. feet
|
- baths - beds |
show details | |

|
#22
Elm Cir
Brea, CA 92823
|
- sq. feet
|
- baths - beds |
show details | |

|
#23
Discovery Ln Unit 431
Brea, CA 92821
|
- sq. feet
|
- baths - beds |
show details | |

|
#24
E Pacific Ct
Brea, CA 92821
|
- sq. feet
|
- baths - beds |
show details | |

|
#25
E Date St Apt B7
Brea, CA 92821
|
- sq. feet
|
- baths - beds |
show details | |

|
#26
W Lambert Rd Apt 28
Brea, CA 92821
|
- sq. feet
|
- baths - beds |
show details | |

|
#27
W Lambert Rd Apt 64
Brea, CA 92821
|
- sq. feet
|
- baths - beds |
show details | |

|
#28
S Randolph Ave Ste 120
Brea, CA 92821
|
- sq. feet
|
- baths - beds |
show details | |

|
#29
Saint Crispen Ave
Brea, CA 92821
|
- sq. feet
|
- baths - beds |
show details | |

|
#30
Adelante St
Brea, CA 92823
|
- sq. feet
|
- baths - beds |
show details |
| Photo | Address | Area | Beds / Baths | Price | Details |
|---|---|---|---|---|---|

|
#31
Sanabria Ln
Brea, CA 92821
|
- sq. feet
|
- baths - beds |
show details | |

|
#32
E Birch St Apt B106
Brea, CA 92821
|
- sq. feet
|
- baths - beds |
show details | |

|
#33
Hudson St
Brea, CA 92821
|
- sq. feet
|
- baths - beds |
show details | |

|
#34
Site Dr Spc 177
Brea, CA 92821
|
- sq. feet
|
- baths - beds |
show details | |

|
#35
Allyson Ct
Brea, CA 92821
|
- sq. feet
|
- baths - beds |
show details | |

|
#36
Studio Dr
Brea, CA 92821
|
- sq. feet
|
- baths - beds |
show details | |

|
#37
Site Dr Spc 23
Brea, CA 92821
|
- sq. feet
|
- baths - beds |
show details | |

|
#38
E Imperial Hwy
Brea, CA 92821
|
- sq. feet
|
- baths - beds |
show details | |

|
Check over 1 million property listings on Foreclosure.com!
|
browse all offers | |||

Latest news about housing in Brea, CA collected exclusively by city-data.com from local newspapers, TV, and radio stations


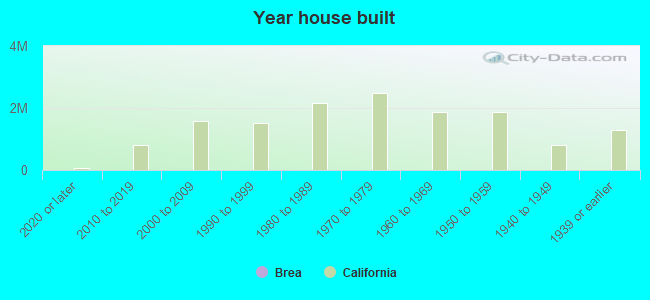
Median year apartment built: 1979
Household type by relationship:
Households: 46,742- Male householders: 8,314 (1,233 living alone), Female householders: 8,014 (1,976 living alone)
9,443 spouses (9,410 opposite-sex spouses), 822 unmarried partners, (804 opposite-sex unmarried partners), 14,708 children (14,002 natural, 254 adopted, 452 stepchildren), 1,062 grandchildren, 847 brothers or sisters, 1,101 parents, 56 foster children, 829 other relatives, 1,387 non-relatives
- In group quarters: 151
Size of family households: 4,875 2-persons, 2,878 3-persons, 2,697 4-persons, 1,227 5-persons, 348 6-persons, 302 7-or-more-persons.
Size of nonfamily households: 3,343 1-person, 824 2-persons, 148 3-persons, 63 4-persons, 27 5-persons.
7,008 married couples with children.
1,700 single-parent households (170 men, 1,530 women).
62.5% of residents of Brea speak English at home.
15.8% of residents speak Spanish at home (72% speak English very well, 16% speak English well, 9% speak English not well, 2% don't speak English at all).
3.9% of residents speak other Indo-European language at home (81% speak English very well, 10% speak English well, 9% speak English not well).
16.2% of residents speak Asian or Pacific Island language at home (58% speak English very well, 25% speak English well, 15% speak English not well, 1% don't speak English at all).
0.9% of residents speak other language at home (76% speak English very well, 15% speak English well, 9% speak English not well).
Foreign born population: 11,456 (24.5%)
(58.3% of them are naturalized citizens)
| Here: | 6.3 |
| State: | 6.0 |
| Here: | 3.9 |
| State: | 3.9 |
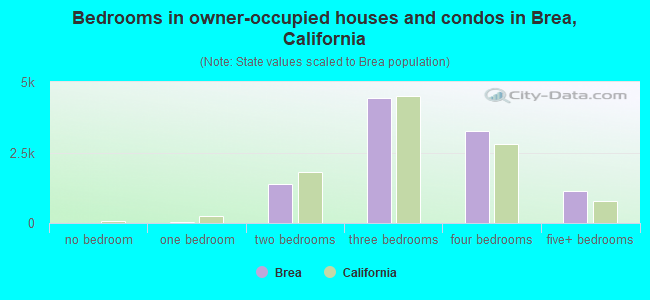
- Bedrooms in owner-occupied houses and condos in Brea, California
- 1no bedroom
- 191 bedroom
- 1,3722 bedrooms
- 4,4243 bedrooms
- 3,2584 bedrooms
- 1,1365+ bedrooms
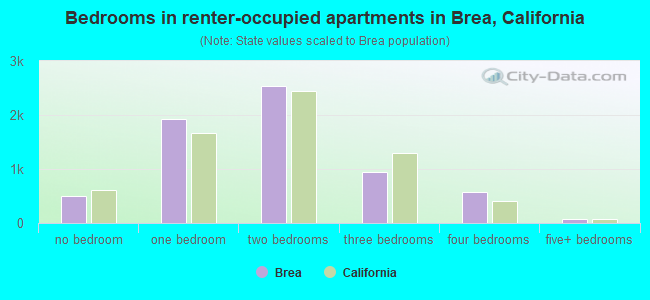
- Bedrooms in renter-occupied apartments in Brea, California
- 501no bedroom
- 1,9171 bedroom
- 2,5282 bedrooms
- 9533 bedrooms
- 5694 bedrooms
- 685+ bedrooms
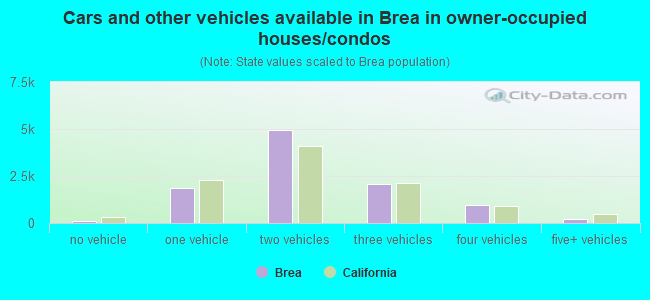
- Cars and other vehicles available in Brea in owner-occupied houses/condos
- 98no vehicle
- 1,8631 vehicle
- 4,9612 vehicles
- 2,0973 vehicles
- 9744 vehicles
- 2195+ vehicles
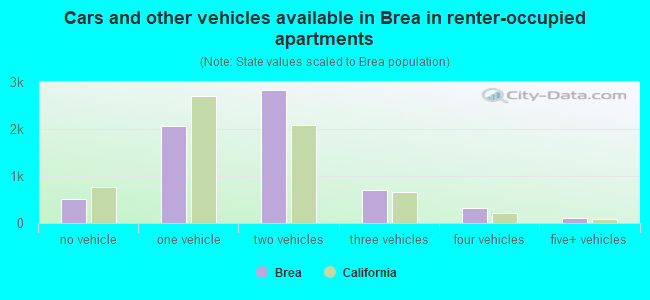
- Cars and other vehicles available in Brea in renter-occupied apartments
- 514no vehicle
- 2,0601 vehicle
- 2,8222 vehicles
- 7003 vehicles
- 3284 vehicles
- 1125+ vehicles
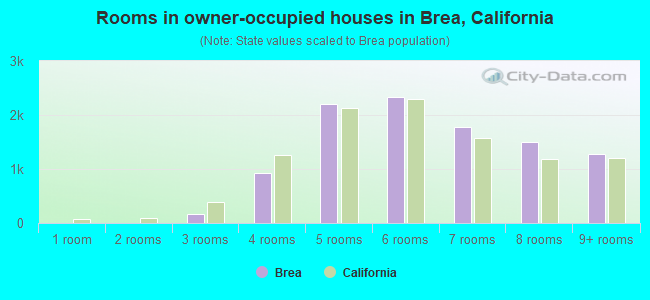
- Rooms in owner-occupied houses in Brea, California
- 11 room
- 82 rooms
- 1663 rooms
- 9224 rooms
- 2,2035 rooms
- 2,3406 rooms
- 1,7857 rooms
- 1,5048 rooms
- 1,2809+ rooms
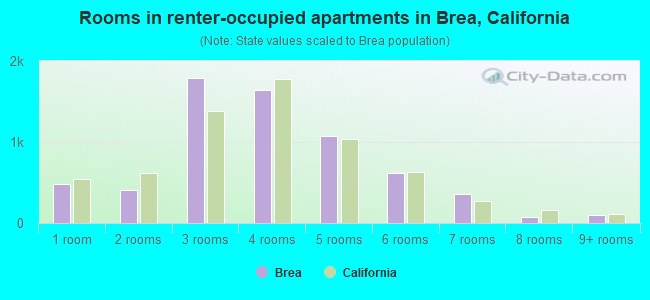
- Rooms in renter-occupied apartments in Brea, California
- 4831 room
- 4082 rooms
- 1,7953 rooms
- 1,6414 rooms
- 1,0775 rooms
- 6126 rooms
- 3557 rooms
- 718 rooms
- 949+ rooms
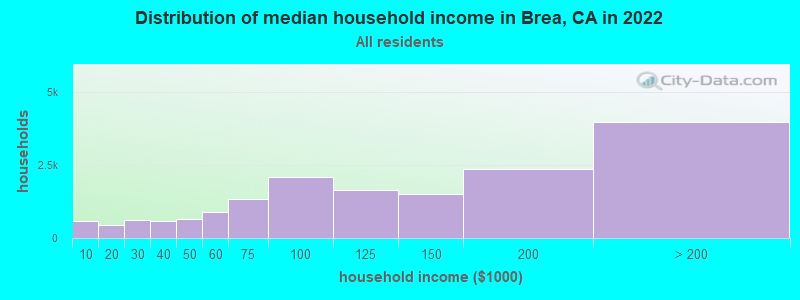
Brea, CA household income distribution

- 595Less than $10,000
- 447$10,000 to $19,999
- 621$20,000 to $29,999
- 594$30,000 to $39,999
- 649$40,000 to $49,999
- 900$50,000 to $59,999
- 1,318$60,000 to $74,999
- 2,098$75,000 to $99,999
- 1,644$100,000 to $124,999
- 1,503$125,000 to $149,999
- 2,351$150,000 to $199,999
- 3,970$200,000 or more
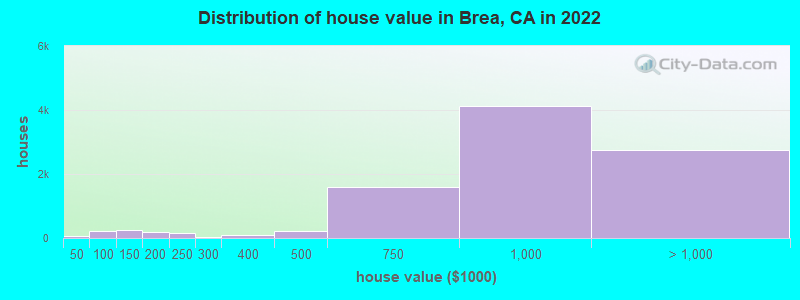
Home value of owner - occupied houses in 2022 in Brea, CA
-
- 43Less than $10,000
- 6$15,000 to $19,999
- 10$35,000 to $39,999
- 56$70,000 to $79,999
- 78$80,000 to $89,999
- 77$90,000 to $99,999
- 117$100,000 to $124,999
- 133$125,000 to $149,999
- 173$150,000 to $174,999
- 24$175,000 to $199,999
- 157$200,000 to $249,999
- 37$250,000 to $299,999
- 82$300,000 to $399,999
- 230$400,000 to $499,999
- 1,603$500,000 to $749,999
- 4,116$750,000 to $999,999
- 1,813$1,000,000 to $1,499,999
- 684$1,500,000 to $1,999,999
- 250$2,000,000 or more
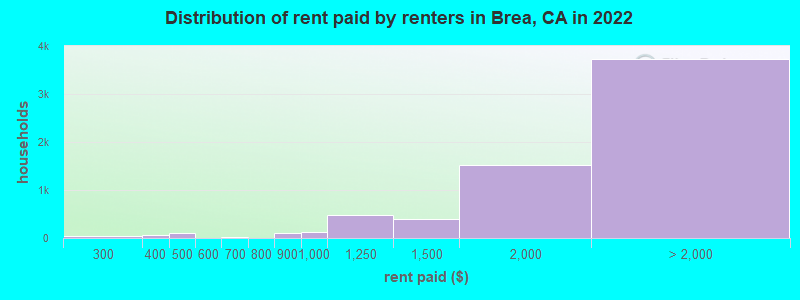
Rent paid by renters in 2022 in Brea, CA
-
- 38$250 to $299
- 15$300 to $349
- 45$350 to $399
- 112$400 to $449
- 5$550 to $599
- 10$650 to $699
- 95$800 to $899
- 123$900 to $999
- 487$1,000 to $1,249
- 395$1,250 to $1,499
- 1,519$1,500 to $1,999
- 1,953$2,000 to $2,499
- 806$2,500 to $2,999
- 589$3,000 to $3,499
- 201$3,500 or more
- 181No cash rent
Percentage of workers working in this county: 71.4%
Number of people working at home: 3,206 (13.5% of all workers)
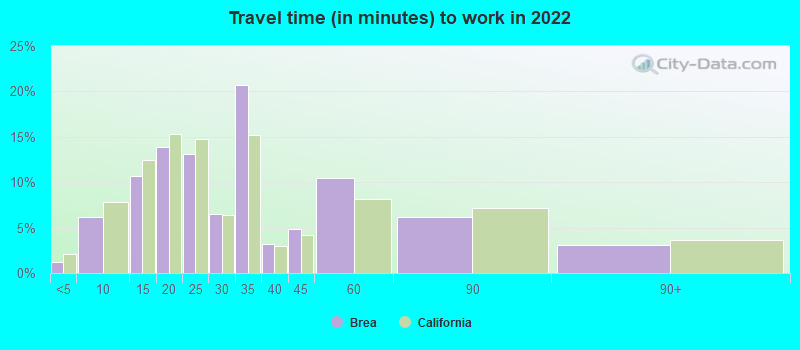
Travel time to work (commute)
- Less than 5 minutes: 254
- 5 to 9 minutes: 1,459
- 10 to 14 minutes: 2,096
- 15 to 19 minutes: 2,341
- 20 to 24 minutes: 2,427
- 25 to 29 minutes: 1,327
- 30 to 34 minutes: 3,294
- 35 to 39 minutes: 1,031
- 40 to 44 minutes: 1,145
- 45 to 59 minutes: 2,291
- 60 to 89 minutes: 1,924
- 90 or more minutes: 520
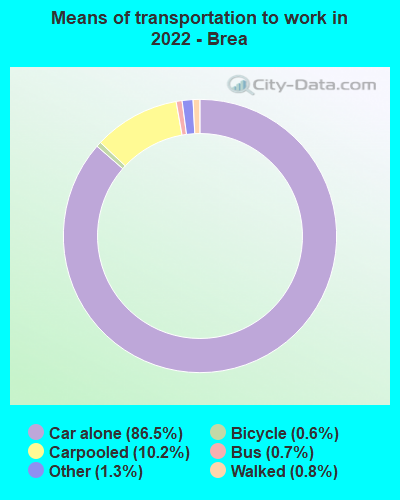
Means of transportation to work:
- Drove a car alone: 35,490 (77.8%)
- Carpooled: 4,545 (10.0%)
- Bus: 256 (0.6%)
- Subway or elevated rail: 3 (0.0%)
- Taxi: 595 (1.3%)
- Bicycle: 270 (0.6%)
- Walked: 307 (0.7%)
- Worked at home: 3,206 (7.0%)
- Unemployment by race in 2022
- Unemployment rate for White non-Hispanic residents
- 5.7%Males
- 4.1%Females
- Unemployment rate for Black residents
- 56.2%Males
- 17.6%Females
- Unemployment rate for Asian residents
- 2.8%Males
- 0.7%Females
- Unemployment rate for other race residents
- 1.4%Males
- 4.4%Females
- Unemployment rate for two or more race residents
- 2.7%Males
- 5.5%Females
- Unemployment rate for Hispanic or Latino residents
- 3.3%Males
- 5.7%Females
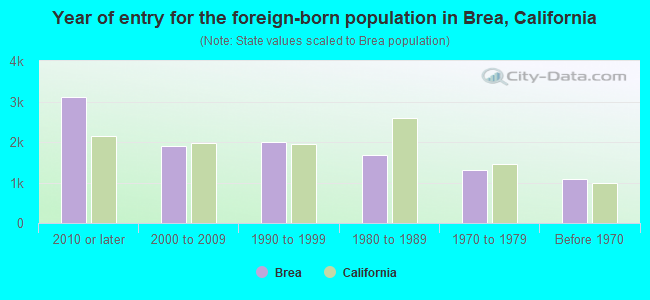
- Year of entry for the foreign-born population in Brea, California
- 3,1122010 or later
- 1,9132000 to 2009
- 2,0061990 to 1999
- 1,6891980 to 1989
- 1,3191970 to 1979
- 1,086Before 1970
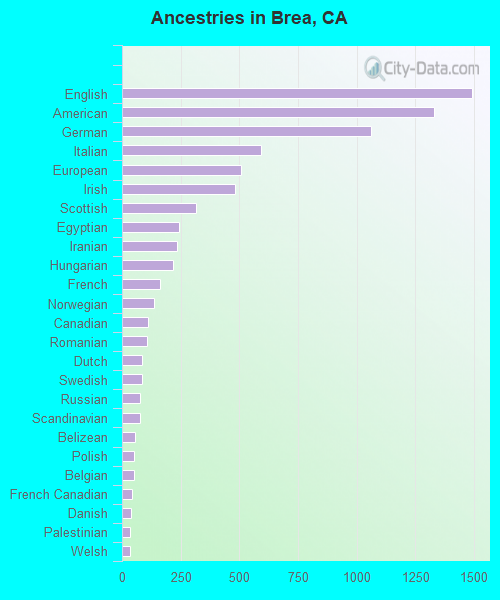
First ancestries reported:
- English: 1,490 (5.3%)
- American: 1,330 (4.7%)
- German: 1,060 (3.7%)
- Italian: 591 (2.1%)
- European: 509 (1.8%)
- Irish: 480 (1.7%)
- Scottish: 316 (1.1%)
- Egyptian: 242 (0.9%)
- Iranian: 233 (0.8%)
- Hungarian: 216 (0.8%)
- French: 161 (0.6%)
- Norwegian: 135 (0.5%)
- Canadian: 109 (0.4%)
- Romanian: 108 (0.4%)
- Dutch: 87 (0.3%)
- Swedish: 86 (0.3%)
- Russian: 78 (0.3%)
- Scandinavian: 75 (0.3%)
- Belizean: 57 (0.2%)
- Polish: 50 (0.2%)
- Belgian: 50 (0.2%)
- French Canadian: 41 (0.1%)
- Danish: 37 (0.1%)
- Palestinian: 35 (0.1%)
- Welsh: 35 (0.1%)
- Scotch-Irish: 31 (0.1%)
- Eastern European: 27 (0.10%)
- Portuguese: 24 (0.08%)
- Celtic: 22 (0.08%)
- Northern European: 19 (0.07%)
- Czechoslovakian: 19 (0.07%)
- Croatian: 19 (0.07%)
- Lebanese: 17 (0.06%)
- Finnish: 16 (0.06%)
- Israeli: 16 (0.06%)
- African: 15 (0.05%)
- British: 14 (0.05%)
- Swiss: 14 (0.05%)
- Armenian: 10 (0.04%)
- Serbian: 10 (0.04%)
- Greek: 9 (0.03%)
- Syrian: 8 (0.03%)
- Afghan: 6 (0.02%)
- Basque: 4 (0.01%)
Most common places of birth for foreign-born residents (%):
| Brea: | 24.9% (2,847) |
| California: | 3.0% (315,248) |
| Brea: | 21.0% (2,410) |
| California: | 37.2% (3,881,193) |
| Brea: | 7.3% (834) |
| California: | 5.2% (539,184) |
| Brea: | 7.1% (816) |
| California: | 7.8% (818,297) |
| Brea: | 5.5% (627) |
| California: | 6.6% (684,672) |
| Brea: | 3.9% (448) |
| California: | 1.7% (176,274) |
| Brea: | 2.3% (263) |
| California: | 0.5% (55,249) |
| Brea: | 1.7% (196) |
| California: | 2.8% (290,436) |
| Brea: | 1.6% (181) |
| California: | 1.0% (105,215) |
| Brea: | 1.6% (180) |
| California: | 1.2% (127,477) |
Place of birth for U.S.-born residents:
- This state: 27,540
- Other state: 6,868
- Northeast: 1,639
- Midwest: 2,198
- South: 1,632
- West: 1,401
87.5% of Brea residents lived in the same house 1 years ago.
Out of people who lived in different houses, 38.2% lived in this county.
Out of people who lived in different counties, 79.9% lived in California.
| Brea: | 87.5% |
| State average: | 88.9% |
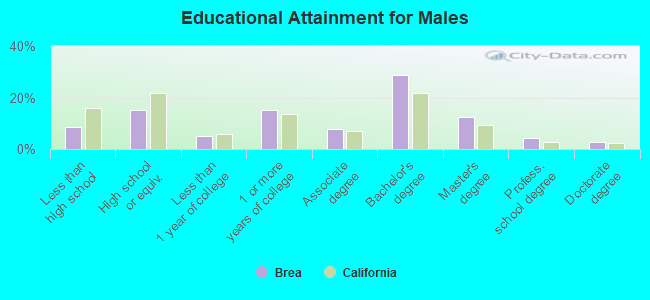
Education attainment for males 25 years and older:
- No schooling: 297
- Nursery to 4th grade: 120
- 5th and 6th grade: 74
- 7th and 8th grade: 143
- 9th grade: 107
- 10th grade: 60
- 11th grade: 131
- 12th grade, no diploma: 384
- High school graduate (or equivalency): 2,387
- Less than 1 year of college: 785
- Some college more than 1 year, no degree: 2,378
- Associate degree: 1,202
- Bachelor's degree: 4,467
- Master's degree: 1,942
- Professional school degree: 653
- Doctorate degree: 444
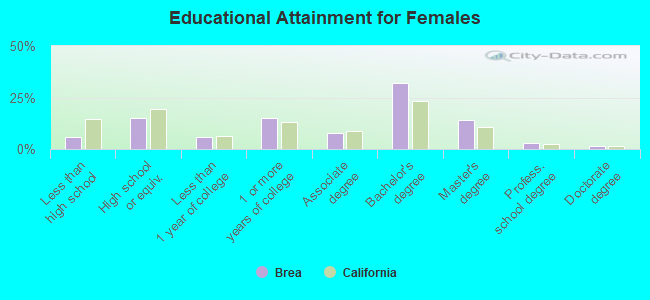
Education attainment for females 25 years and older:
- No schooling: 123
- Nursery to 4th grade: 159
- 5th and 6th grade: 145
- 7th and 8th grade: 163
- 9th grade: 101
- 10th grade: 64
- 11th grade: 63
- 12th grade, no diploma: 162
- High school graduate (or equivalency): 2,624
- Less than 1 year of college: 990
- Some college more than 1 year, no degree: 2,603
- Associate degree: 1,381
- Bachelor's degree: 5,534
- Master's degree: 2,445
- Professional school degree: 473
- Doctorate degree: 292


Housing units in structures:
- One, detached: 9,362
- One, attached: 1,967
- Two: 82
- 3 or 4: 578
- 5 to 9: 1,138
- 10 to 19: 593
- 20 to 49: 853
- 50 or more: 2,099
- Mobile homes: 808
Median worth of mobile homes: $204,081
Housing units lacking complete kitchen facilities in 2022: 2.6%
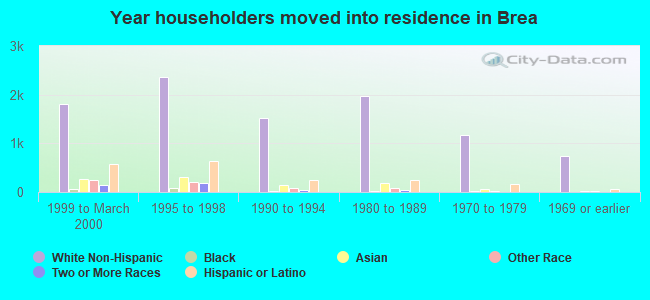
House/condo owner moved in on average 11 years ago
Renter moved in on average 1 years ago
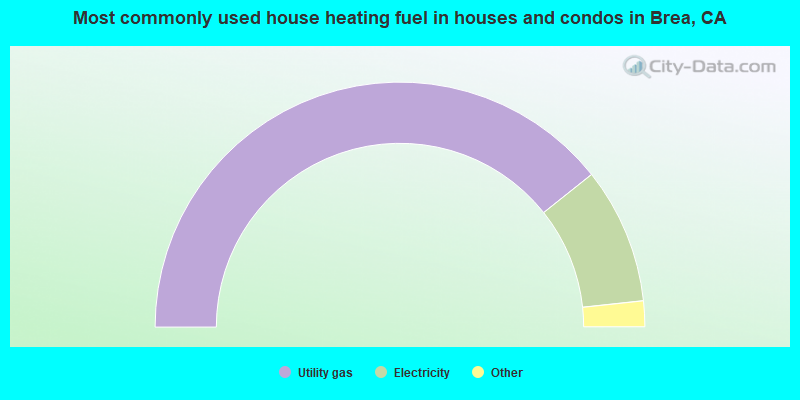
- 78.6%Utility gas
- 18.0%Electricity
- 1.2%No fuel used
- 1.1%Solar energy
- 1.0%Bottled, tank, or LP gas
- 0.1%Other fuel
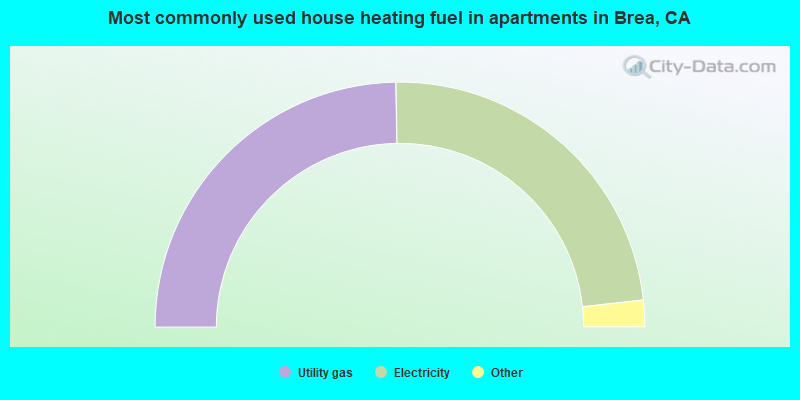
- 49.5%Utility gas
- 47.0%Electricity
- 1.7%Bottled, tank, or LP gas
- 0.8%Fuel oil, kerosene, etc.
- 0.7%Wood
- 0.3%No fuel used
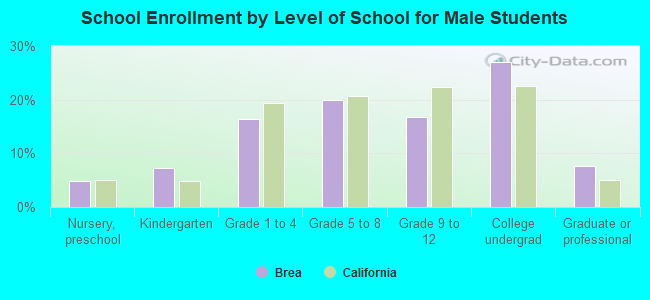
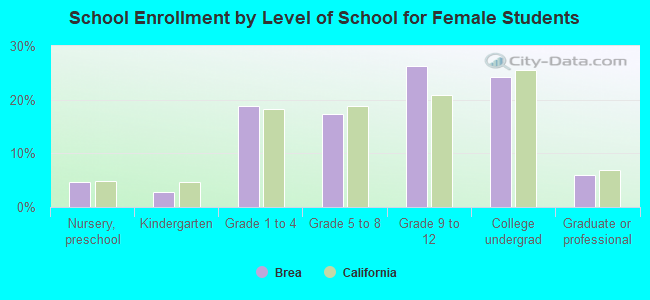
Private vs. public school enrollment:
| Here: | 15.0% |
| California: | 10.5% |
| Here: | 10.3% |
| California: | 8.5% |
| Here: | 16.3% |
| California: | 15.9% |