Housing density: 964 houses/condos per square mile
Median price asked for vacant for-sale houses and condos in 2022 in this county: $751,928.
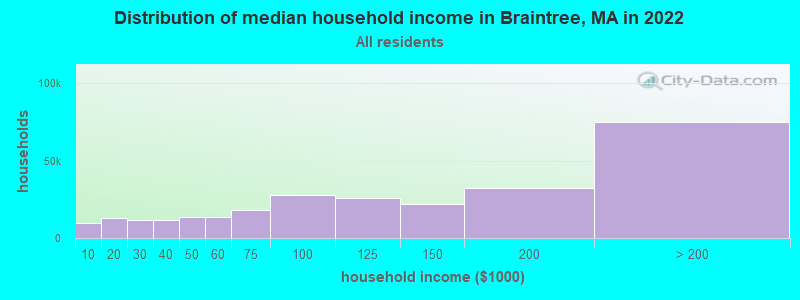
Median contract rent in 2022: $1,558 (lower quartile is $1,006, upper quartile is over $2,000)
Median rent asked for vacant for-rent units in 2022: $1,562
Median gross rent in Braintree, MA in 2022: $1,690
Housing units in Braintree with a mortgage: 5,792 (370 second mortgage, 881 home equity loan, 9 both second mortgage and home equity loan) Houses without a mortgage: 2,958
In family households: 540,608 (116,996 male householders, 51,907 female householders)
134,066 spouses, 197,825 children (189,784 natural, 4,588 adopted, 3,453 stepchildren), 7,406 grandchildren, 6,062 brothers or sisters, 7,064 parents, foster children, 5,893 other relatives, 9,006 non-relatives
In nonfamily households: 112,631 (36,559 male householders (27,334 living alone)), 52,452 female householders (43,798 living alone)), 23,620 nonrelatives
In group quarters: 17,611 (8,991 institutionalized population)
123,500 married couples with children.
20,654 single-parent households (3,498 men, 17,156 women).
91.1% of residents of Braintree speak English at home.
1.4% of residents speak Spanish at home (63% speak English very well, 16% speak English well, 20% speak English not well).
5.3% of residents speak other Indo-European language at home (75% speak English very well, 17% speak English well, 8% speak English not well).
2.0% of residents speak Asian or Pacific Island language at home (52% speak English very well, 34% speak English well, 8% speak English not well, 7% don't speak English at all).
0.3% of residents speak other language at home (86% speak English very well, 14% speak English well).
Foreign born population: 5,079 (13.5%)
(75.2% of them are naturalized citizens)
Year of entry for the foreign-born population in Braintree, Massachusetts
2471995 to March 2000
3481990 to 1994
3351985 to 1989
3121980 to 1984
2521975 to 1979
1851970 to 1974
3051965 to 1969
730Before 1965
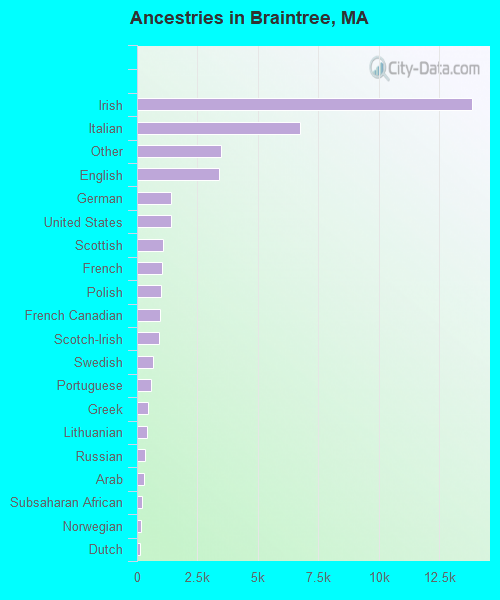
First ancestries reported:
Irish: 13,858 (35.7%)
Italian: 6,752 (17.4%)
Other: 3,472 (8.9%)
English: 3,391 (8.7%)
German: 1,414 (3.6%)
United States: 1,398 (3.6%)
Scottish: 1,072 (2.8%)
French: 1,026 (2.6%)
Polish: 991 (2.6%)
French Canadian: 938 (2.4%)
Scotch-Irish: 922 (2.4%)
Swedish: 652 (1.7%)
Portuguese: 578 (1.5%)
Greek: 443 (1.1%)
Lithuanian: 417 (1.1%)
Russian: 319 (0.8%)
Arab: 309 (0.8%)
Subsaharan African: 210 (0.5%)
Norwegian: 176 (0.5%)
Dutch: 127 (0.3%)
Hungarian: 80 (0.2%)
Czech: 66 (0.2%)
West Indian: 59 (0.2%)
Welsh: 58 (0.1%)
Danish: 29 (0.07%)
Ukrainian: 28 (0.07%)
Slovak: 21 (0.05%)
Most common places of birth for foreign-born residents (%):
Ireland
Braintree:
15.5% (422)
Massachusetts:
2.3% (17,987)
Italy
Braintree:
11.7% (318)
Massachusetts:
3.7% (28,319)
Canada
Braintree:
7.7% (210)
Massachusetts:
5.2% (40,247)
United Kingdom
Braintree:
5.9% (159)
Massachusetts:
3.3% (25,403)
Vietnam
Braintree:
5.0% (136)
Massachusetts:
3.9% (30,457)
Pakistan
Braintree:
4.9% (132)
Massachusetts:
0.5% (3,660)
China, excluding Hong Kong and Taiwan
Braintree:
4.1% (111)
Massachusetts:
5.1% (39,255)
Greece
Braintree:
3.8% (103)
Massachusetts:
1.7% (12,975)
Hong Kong
Braintree:
3.5% (94)
Massachusetts:
1.0% (7,937)
Poland
Braintree:
3.3% (90)
Massachusetts:
1.8% (13,543)
India
Braintree:
3.2% (87)
Massachusetts:
3.6% (28,086)
Mexico
Braintree:
2.6% (70)
Massachusetts:
1.0% (7,867)
Portugal
Braintree:
2.5% (69)
Massachusetts:
8.6% (66,627)
Other Western Africa
Braintree:
2.4% (64)
Massachusetts:
2.6% (20,299)
Trinidad and Tobago
Braintree:
2.1% (56)
Massachusetts:
0.8% (6,005)
Philippines
Braintree:
1.8% (49)
Massachusetts:
1.0% (7,414)
Colombia
Braintree:
1.7% (45)
Massachusetts:
2.0% (15,286)
Turkey
Braintree:
1.5% (42)
Massachusetts:
0.5% (3,525)
Place of birth for U.S.-born residents:
This state: 27,800
Other state: 3,039
Northeast: 1,865
Midwest: 407
South: 563
West: 204
70% of Braintree residents lived in the same house 5 years ago. Out of people who lived in different houses, 60% lived in this county. Out of people who lived in different counties, 74% lived in Massachusetts.
Education attainment for males 25 years and older:
No schooling: 13
Nursery to 4th grade: 22
5th and 6th grade: 83
7th and 8th grade: 168
9th grade: 65
10th grade: 128
11th grade: 158
12th grade, no diploma: 286
High school graduate (or equivalency): 3,288
Less than 1 year of college: 635
Some college more than 1 year, no degree: 1,490
Associate degree: 742
Bachelor's degree: 2,508
Master's degree: 956
Professional school degree: 263
Doctorate degree: 42
Education attainment for females 25 years and older:
No schooling: 37
Nursery to 4th grade: 32
5th and 6th grade: 47
7th and 8th grade: 189
9th grade: 110
10th grade: 222
11th grade: 118
12th grade, no diploma: 460
High school graduate (or equivalency): 4,438
Less than 1 year of college: 936
Some college more than 1 year, no degree: 1,457
Associate degree: 1,211
Bachelor's degree: 2,735
Master's degree: 895
Professional school degree: 189
Doctorate degree: 63
Housing units in structures:
One, detached: 9,105
One, attached: 357
Two: 889
3 or 4: 618
5 to 9: 430
10 to 19: 891
20 to 49: 167
50 or more: 454
Mobile homes: 14
Median worth of mobile homes: $249,995
Housing units lacking complete plumbing facilities: 0.2%
Housing units lacking complete kitchen facilities: 0.9%