Bradenton, FL (Florida) Houses and Residents
Estimated median house or condo value in 2022: $310,298 (it was $90,300 in 2000 )
Bradenton:
$310,298Florida:
$354,100
Lower value quartile - upper value quartile: $218,487 - $452,773Mean price in 2022: Detached houses: $332,762 Here:
$332,762State:
$500,941
Townhouses or other attached units: $271,519 Here:
$271,519State:
$370,869
In 2-unit structures: $321,760 Here:
$321,760State:
$423,188
In 3-to-4-unit structures: $424,436 Here:
$424,436State:
$309,944
In 5-or-more-unit structures: $212,369 Here:
$212,369State:
$447,145
Mobile homes: $65,074 Here:
$65,074State:
$113,202
Total population: 52,769 (Urban population: 49,908, Rural population: 0)
Houses: 29,850 (23,469 occupied: 14,200 owner occupied, 10,032 renter occupied )
% of renters here:
41%State:
33%
Housing density: 2,465 houses/condos per square mile
Median price asked for vacant for-sale houses and condos in 2022: $314,709.
Median contract rent in 2022: $1,294 (lower quartile is $998, upper quartile is $1,682)
Median rent asked for vacant for-rent units in 2022: $2,088
Median gross rent in Bradenton, FL in 2022: $1,460
Housing units in Bradenton with a mortgage: 7,019 (762 second mortgage, 20 home equity loan, 708 both second mortgage and home equity loan )Houses without a mortgage: 228
Median household income for houses/condos with a mortgage: $86,560
Median household income for apartments without a mortgage: $54,751
Median monthly housing costs: $1,255
Data:
Median house or condo value ($)
Median house or condo value ($ change since 2000)
Median house or condo value ($) - White
Median house or condo value ($) - Black or African American
Median house or condo value ($) - Asian
Median house or condo value ($) - Hispanic or Latino
Median house or condo value ($) - American Indian and Alaska Native
Median house or condo value ($) - Multirace
Median house or condo value ($) - Other Race
Median price asked for mobile homes ($)
Household density (households per square mile)
Mean house or condo value by units in structure - 1, detached ($)
Mean house or condo value by units in structure - 1, attached ($)
Mean house or condo value by units in structure - 2 ($)
Mean house or condo value by units in structure by units in structure - 3 or 4 ($)
Mean house or condo value by units in structure - 5 or more ($)
Mean house or condo value by units in structure - Boat, RV, van, etc. ($)
Mean house or condo value by units in structure - Mobile home ($)
Median contract rent ($)
Median contract rent - Lower quartile ($)
Median contract rent - Upper quartile ($)
Median gross rent ($)
Urban houses (%)
Rural houses (%)
Houses occupied (%)
Houses occupied (% change since 2000)
Houses owner occupied (%)
Houses owner occupied (% change since 2000)
Houses renter occupied (%)
Houses renter occupied (% change since 2000)
Vacant housing units - For rent (%)
Vacant housing units - For rent (% change since 2000)
Vacant housing units - For sale only (%)
Vacant housing units - For sale only (% change since 2000)
Vacant housing units - Rented or sold, not occupied (%)
Vacant housing units - Rented or sold, not occupied (% change since 2000)
Vacant housing units - For seasonal, recreational, or occasional use (%)
Vacant housing units - For seasonal, recreational, or occasional use (% change since 2000)
Vacant housing units - For migrant workers (%)
Vacant housing units - For migrant workers (% change since 2000)
Vacant housing units - Other vacant (%)
Vacant housing units - Other vacant (% change since 2000)
Median monthly housing costs ($)
Median household income for houses/condos with a mortgage ($)
Median household income for houses/condos without a mortgage ($)
Median household income ($)
Median household income ($) - White
Median household income ($) - Black or African American
Median household income ($) - Asian
Median household income ($) - Hispanic or Latino
Median household income ($) - American Indian and Alaska Native
Median household income ($) - Multirace
Median household income ($) - Other Race
Mortgage status - with mortgage (%)
Mortgage status - with second mortgage (%)
Mortgage status - with home equity loan (%)
Mortgage status - with both second mortgage and home equity loan (%)
Mortgage status - without a mortgage (%)
Median year house/condo built
Median year apartment built
Household type by relationship - Male householder living alone (%)
Household type by relationship - Male householder not living alone (%)
Household type by relationship - Female householder living alone (%)
Household type by relationship - Female householder not living alone (%)
Household type by relationship - Opposite-Sex spouse (%)
Household type by relationship - Same-Sex spouse (%)
Household type by relationship - Opposite-Sex unmarried partner (%)
Household type by relationship - Same-Sex unmarried partner (%)
Household type by relationship - In group quarters (%)
Size of family households - 2-person household (%)
Size of family households - 3-person household (%)
Size of family households - 4-person household (%)
Size of family households - 5-person household (%)
Size of family households - 6-person household (%)
Size of family households - 7-or-more-person household (%)
Size of nonfamily households - 1-person household (%)
Size of nonfamily households - 2-person household (%)
Size of nonfamily households - 3-person household (%)
Size of nonfamily households - 4-person household (%)
Size of nonfamily households - 5-person household (%)
Size of nonfamily households - 6-person household (%)
Size of nonfamily households - 7-or-moreperson household (%)
Year house built - Built 2010 or later (%)
Year house built - Built 2000 to 2009 (%)
Year house built - Built 1990 to 1999 (%)
Year house built - Built 1980 to 1989 (%)
Year house built - Built 1970 to 1979 (%)
Year house built - Built 1960 to 1969 (%)
Year house built - Built 1950 to 1959 (%)
Year house built - Built 1940 to 1949 (%)
Year house built - Built 1939 or earlier (%)
Median number of rooms in houses and condos
Median number of rooms in apartments
Median number of bedrooms in owner occupied houses
Mean number of bedrooms in owner occupied houses
Median number of bedrooms in renter occupied houses
Mean number of bedrooms in renter occupied houses
Median number of vehichles in owner occupied houses
Mean number of vehichles in owner occupied houses
Median number of vehichles in renter occupied houses
Mean number of vehichles in renter occupied houses
Rooms in owner-occupied houses - 1 room (%)
Rooms in owner-occupied houses - 2 rooms (%)
Rooms in owner-occupied houses - 3 rooms (%)
Rooms in owner-occupied houses - 4 rooms (%)
Rooms in owner-occupied houses - 5 rooms (%)
Rooms in owner-occupied houses - 6 rooms (%)
Rooms in owner-occupied houses - 7 rooms (%)
Rooms in owner-occupied houses - 8 rooms (%)
Rooms in owner-occupied houses - 9+ rooms (%)
Rooms in renter-occupied houses - 1 room (%)
Rooms in renter-occupied houses - 2 rooms (%)
Rooms in renter-occupied houses - 3 rooms (%)
Rooms in renter-occupied houses - 4 rooms (%)
Rooms in renter-occupied houses - 5 rooms (%)
Rooms in renter-occupied houses - 6 rooms (%)
Rooms in renter-occupied houses - 7 rooms (%)
Rooms in renter-occupied houses - 8 rooms (%)
Rooms in renter-occupied houses - 9+ rooms (%)
Bedrooms in owner-occupied houses - no bedrooms (%)
Bedrooms in owner-occupied houses - 1 bedroom (%)
Bedrooms in owner-occupied houses - 2 bedrooms (%)
Bedrooms in owner-occupied houses - 3 bedrooms (%)
Bedrooms in owner-occupied houses - 4 bedrooms (%)
Bedrooms in owner-occupied houses - 5+ bedrooms (%)
Bedrooms in renter-occupied houses - no bedrooms (%)
Bedrooms in renter-occupied houses - 1 bedroom (%)
Bedrooms in renter-occupied houses - 2 bedrooms (%)
Bedrooms in renter-occupied houses - 3 bedrooms (%)
Bedrooms in renter-occupied houses - 4 bedrooms (%)
Bedrooms in renter-occupied houses - 5+ bedrooms (%)
Vehicles available in owner-occupied houses - no vehicle available (%)
Vehicles available in owner-occupied houses - 1 vehicle available(%)
Vehicles available in owner-occupied houses - 2 Vehicles available (%)
Vehicles available in owner-occupied houses - 3 Vehicles available (%)
Vehicles available in owner-occupied houses - 4 Vehicles available (%)
Vehicles available in owner-occupied houses - 5+ Vehicles available (%)
Vehicles available in renter-occupied houses - no vehicle available (%)
Vehicles available in renter-occupied houses - 1 vehicle available (%)
Vehicles available in renter-occupied houses - 2 Vehicles available (%)
Vehicles available in renter-occupied houses - 3 Vehicles available (%)
Vehicles available in renter-occupied houses - 4 Vehicles available (%)
Vehicles available in renter-occupied houses - 5+ Vehicles available (%)
Housing units in structures - 1, detached (%)
Housing units in structures - 1, attached (%)
Housing units in structures - 2 (%)
Housing units in structures - 3 or 4 (%)
Housing units in structures - 5 to 9 (%)
Housing units in structures - 10 to 19 (%)
Housing units in structures - 20 to 49 (%)
Housing units in structures - 50 or more (%)
Housing units in structures - Mobile home (%)
Housing units in structures - Boat, RV, van, etc. (%)
Housing units in structures - Owners - 1, detached (%)
Housing units in structures - Owners - 1, attached (%)
Housing units in structures - Owners - 2 (%)
Housing units in structures - Owners - 3 or 4 (%)
Housing units in structures - Owners - 5 to 9 (%)
Housing units in structures - Owners - 10 to 19 (%)
Housing units in structures - Owners - 20 to 49 (%)
Housing units in structures - Owners - 50 or more (%)
Housing units in structures - Owners - Mobile home (%)
Housing units in structures - Owners - Boat, RV, van, etc. (%)
Housing units in structures - Renters - 1, detached (%)
Housing units in structures - Renters - 1, attached (%)
Housing units in structures - Renters - 2 (%)
Housing units in structures - Renters - 3 or 4 (%)
Housing units in structures - Renters - 5 to 9 (%)
Housing units in structures - Renters - 10 to 19 (%)
Housing units in structures - Renters - 20 to 49 (%)
Housing units in structures - Renters - 50 or more (%)
Housing units in structures - Renters - Mobile home (%)
Housing units in structures - Renters - Boat, RV, van, etc. (%)
House/condo owner moved in on average (years ago)
Renter moved in on average (years ago)
Year householder moved into unit - Moved in 1999 to March 2000 (%)
Year householder moved into unit - Moved in 1999 to March 2000 (%) - White
Year householder moved into unit - Moved in 1999 to March 2000 (%) - Black or African American
Year householder moved into unit - Moved in 1999 to March 2000 (%) - Asian
Year householder moved into unit - Moved in 1999 to March 2000 (%) - Hispanic or Latino
Year householder moved into unit - Moved in 1999 to March 2000 (%) - American Indian and Alaska Native
Year householder moved into unit - Moved in 1999 to March 2000 (%) - Multirace
Year householder moved into unit - Moved in 1999 to March 2000 (%) - Other Race
Year householder moved into unit - Moved in 1995 to 1998 (%)
Year householder moved into unit - Moved in 1995 to 1998 (%) - White
Year householder moved into unit - Moved in 1995 to 1998 (%) - Black or African American
Year householder moved into unit - Moved in 1995 to 1998 (%) - Asian
Year householder moved into unit - Moved in 1995 to 1998 (%) - Hispanic or Latino
Year householder moved into unit - Moved in 1995 to 1998 (%) - American Indian and Alaska Native
Year householder moved into unit - Moved in 1995 to 1998 (%) - Multirace
Year householder moved into unit - Moved in 1995 to 1998 (%) - Other Race
Year householder moved into unit - Moved in 1990 to 1994 (%)
Year householder moved into unit - Moved in 1990 to 1994 (%) - White
Year householder moved into unit - Moved in 1990 to 1994 (%) - Black or African American
Year householder moved into unit - Moved in 1990 to 1994 (%) - Asian
Year householder moved into unit - Moved in 1990 to 1994 (%) - Hispanic or Latino
Year householder moved into unit - Moved in 1990 to 1994 (%) - American Indian and Alaska Native
Year householder moved into unit - Moved in 1990 to 1994 (%) - Multirace
Year householder moved into unit - Moved in 1990 to 1994 (%) - Other Race
Year householder moved into unit - Moved in 1980 to 1989 (%)
Year householder moved into unit - Moved in 1980 to 1989 (%) - White
Year householder moved into unit - Moved in 1980 to 1989 (%) - Black or African American
Year householder moved into unit - Moved in 1980 to 1989 (%) - Asian
Year householder moved into unit - Moved in 1980 to 1989 (%) - Hispanic or Latino
Year householder moved into unit - Moved in 1980 to 1989 (%) - American Indian and Alaska Native
Year householder moved into unit - Moved in 1980 to 1989 (%) - Multirace
Year householder moved into unit - Moved in 1980 to 1989 (%) - Other Race
Year householder moved into unit - Moved in 1970 to 1979 (%)
Year householder moved into unit - Moved in 1970 to 1979 (%) - White
Year householder moved into unit - Moved in 1970 to 1979 (%) - Black or African American
Year householder moved into unit - Moved in 1970 to 1979 (%) - Asian
Year householder moved into unit - Moved in 1970 to 1979 (%) - Hispanic or Latino
Year householder moved into unit - Moved in 1970 to 1979 (%) - American Indian and Alaska Native
Year householder moved into unit - Moved in 1970 to 1979 (%) - Multirace
Year householder moved into unit - Moved in 1970 to 1979 (%) - Other Race
Year householder moved into unit - Moved in 1969 or earlier (%)
Year householder moved into unit - Moved in 1969 or earlier (%) - White
Year householder moved into unit - Moved in 1969 or earlier (%) - Black or African American
Year householder moved into unit - Moved in 1969 or earlier (%) - Asian
Year householder moved into unit - Moved in 1969 or earlier (%) - Hispanic or Latino
Year householder moved into unit - Moved in 1969 or earlier (%) - American Indian and Alaska Native
Year householder moved into unit - Moved in 1969 or earlier (%) - Multirace
Year householder moved into unit - Moved in 1969 or earlier (%) - Other Race
Housing units lacking complete plumbing facilities (%)
Housing units lacking complete kitchen facilities (%)
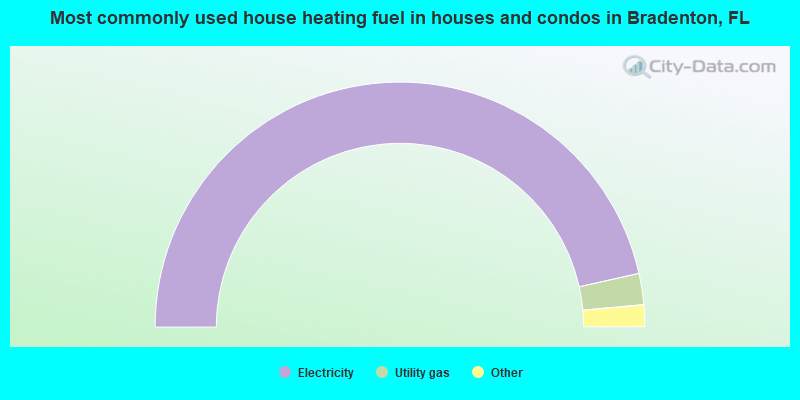
House heating fuel used in houses and condos - Utility gas (%)
House heating fuel used in houses and condos - Bottled, tank, or LP gas (%)
House heating fuel used in houses and condos - Electricity (%)
House heating fuel used in houses and condos - Fuel oil, kerosene, etc. (%)
House heating fuel used in houses and condos - Coal or coke (%)
House heating fuel used in houses and condos - Wood (%)
House heating fuel used in houses and condos - Solar energy (%)
House heating fuel used in houses and condos - Other fuel (%)
House heating fuel used in houses and condos - No fuel used (%)
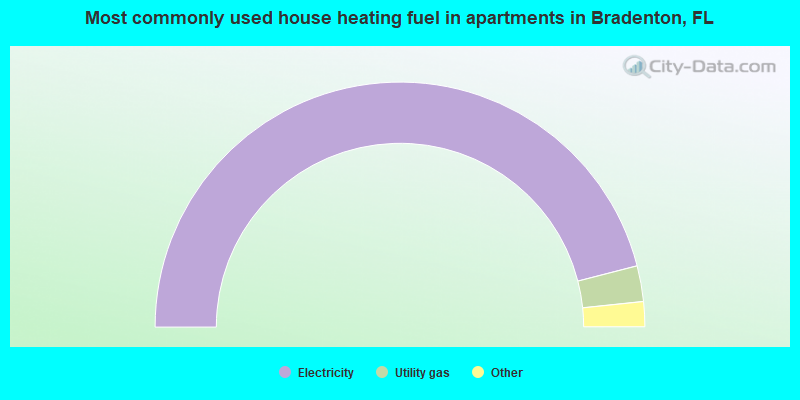
House heating fuel used in apartments - Utility gas (%)
House heating fuel used in apartments - Bottled, tank, or LP gas (%)
House heating fuel used in apartments - Electricity (%)
House heating fuel used in apartments - Fuel oil, kerosene, etc. (%)
House heating fuel used in apartments - Coal or coke (%)
House heating fuel used in apartments - Wood (%)
House heating fuel used in apartments - Solar energy (%)
House heating fuel used in apartments - Other fuel (%)
House heating fuel used in apartments - No fuel used (%)
Latest news about housing in Bradenton, FL collected exclusively by city-data.com from local newspapers, TV, and radio stations
Median year house/condo built: 1980Median year apartment built: 1984Household type by relationship:
Households: 59,108
Male householders: 10,995 (3,196 living alone ), Female householders: 12,481 (5,080 living alone )9,565 spouses (9,469 opposite-sex spouses ), 2,121 unmarried partners , (1,949 opposite-sex unmarried partners ), 13,736 children (12,471 natural , 510 adopted , 754 stepchildren ), 2,156 grandchildren , 948 brothers or sisters , 1,340 parents , 122 foster children , 1,310 other relatives , 2,371 non-relatives In group quarters: 1,957
Size of family households: 7,956 2-persons , 2,687 3-persons , 1,915 4-persons , 986 5-persons , 233 6-persons , 368 7-or-more-persons .
Size of nonfamily households: 7,912 1-person , 1,758 2-persons , 159 3-persons , 75 4-persons , 28 7-or-more-persons .
5,014 married couples with children. single-parent households (950 men , 2,733 women ).
79.1% of residents of Bradenton speak English at home. of residents speak Spanish at home (65% speak English very well , 12% speak English well , 12% speak English not well , 10% don't speak English at all ).of residents speak other Indo-European language at home (71% speak English very well , 16% speak English well , 10% speak English not well , 2% don't speak English at all ).of residents speak Asian or Pacific Island language at home (54% speak English very well , 34% speak English well , 12% speak English not well ).of residents speak other language at home (43% speak English very well , 57% speak English well ).
Foreign born population: 8,008 (13.5%)of them are naturalized citizens )
Median number of rooms in houses and condos:
Median number of rooms in apartments
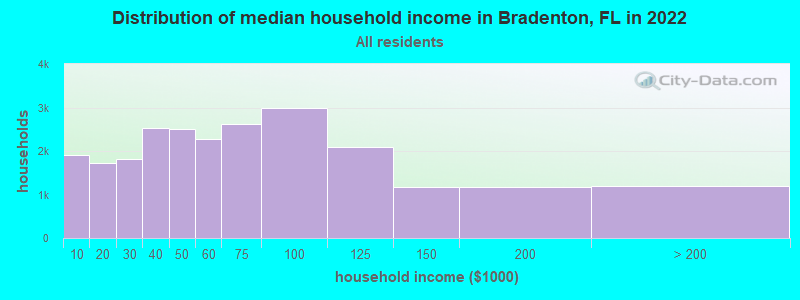
Bradenton, FL household income distribution 1,910 Less than $10,0001,730 $10,000 to $19,9991,815 $20,000 to $29,9992,531 $30,000 to $39,9992,498 $40,000 to $49,9992,275 $50,000 to $59,9992,629 $60,000 to $74,9992,989 $75,000 to $99,9992,089 $100,000 to $124,9991,176 $125,000 to $149,9991,175 $150,000 to $199,9991,184 $200,000 or more
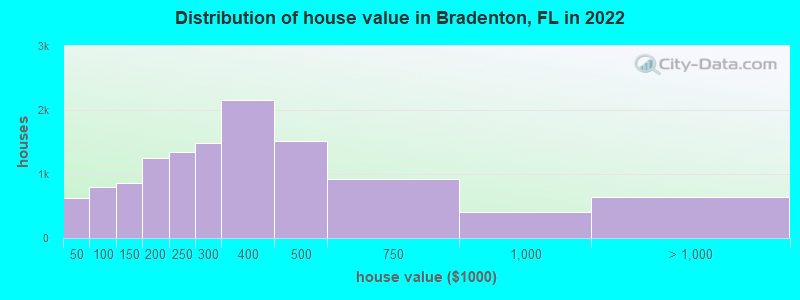
Home value of owner - occupied houses in 2022 in Bradenton, FL 122 Less than $10,00026 $10,000 to $14,99992 $15,000 to $19,99922 $20,000 to $24,99990 $25,000 to $29,99935 $30,000 to $34,999100 $35,000 to $39,999139 $40,000 to $49,999139 $50,000 to $59,999123 $60,000 to $69,99969 $70,000 to $79,999150 $80,000 to $89,999173 $90,000 to $99,999501 $100,000 to $124,999354 $125,000 to $149,999834 $150,000 to $174,999422 $175,000 to $199,9991,344 $200,000 to $249,9991,481 $250,000 to $299,9992,157 $300,000 to $399,9991,523 $400,000 to $499,999921 $500,000 to $749,999407 $750,000 to $999,999408 $1,000,000 to $1,499,99966 $1,500,000 to $1,999,999172 $2,000,000 or moreRent paid by renters in 2022 in Bradenton, FL 16 Less than $10028 $100 to $149142 $150 to $19948 $200 to $24969 $300 to $34934 $350 to $39921 $400 to $449207 $450 to $49934 $500 to $54987 $550 to $599139 $600 to $649123 $650 to $69965 $700 to $749383 $750 to $799245 $800 to $899851 $900 to $9992,146 $1,000 to $1,2491,773 $1,250 to $1,4991,848 $1,500 to $1,999570 $2,000 to $2,499341 $2,500 to $2,999157 $3,000 to $3,499223 $3,500 or more515 No cash rent
Percentage of workers working in this county: 73.9%Number of people working at home: 2,335 (9.4% of all workers )
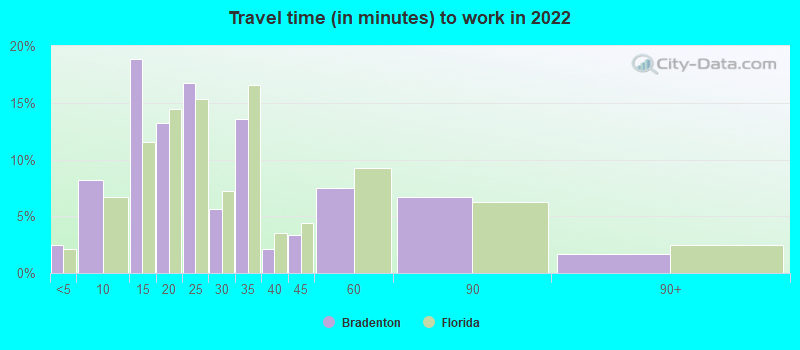
Travel time to work (commute)
Less than 5 minutes: 8205 to 9 minutes: 2,21110 to 14 minutes: 3,36515 to 19 minutes: 2,72720 to 24 minutes: 3,32625 to 29 minutes: 1,62430 to 34 minutes: 3,31135 to 39 minutes: 66240 to 44 minutes: 1,01645 to 59 minutes: 1,34260 to 89 minutes: 1,03390 or more minutes: 683
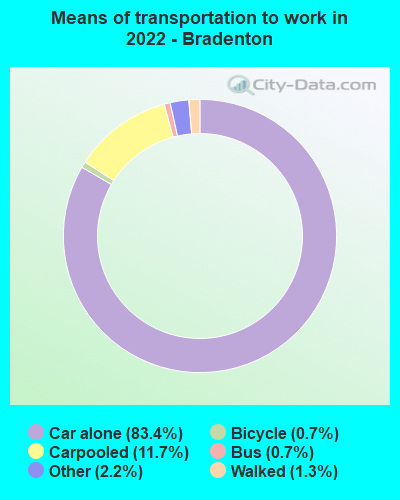
Means of transportation to work:
Drove a car alone: 27,552 (76.0%)Carpooled: 3,125 (8.6%)Bus : 211 (0.6%)Taxi: 792 (2.2%)Bicycle: 285 (0.8%)Walked: 609 (1.7%)Worked at home: 2,335 (6.4%)
Unemployment by race in 2022
Unemployment rate for White non-Hispanic residents 4.2% Males3.0% FemalesUnemployment rate for Black residents 13.2% Males2.4% FemalesUnemployment rate for Asian residents 2.4% Males7.1% FemalesUnemployment rate for other race residents 4.0% Males15.6% FemalesUnemployment rate for two or more race residents 2.1% Males6.1% FemalesUnemployment rate for Hispanic or Latino residents 6.9% Males10.1% Females
Year of entry for the foreign-born population in Bradenton, Florida
2,367 2010 or later 2,694 2000 to 2009 1,305 1990 to 1999 1,055 1980 to 1989 410 1970 to 1979 778 Before 1970
First ancestries reported:
American: 3,885 (11.3%)
German: 2,964 (8.7%)
English: 2,401 (7.0%)
Irish: 1,796 (5.2%)
Italian: 1,504 (4.4%)
Jamaican: 714 (2.1%)
Polish: 481 (1.4%)
Haitian: 480 (1.4%)
African: 364 (1.1%)
Dutch: 353 (1.0%)
French: 294 (0.9%)
Norwegian: 257 (0.8%)
Swedish: 246 (0.7%)
French Canadian: 246 (0.7%)
Canadian: 240 (0.7%)
European: 230 (0.7%)
Russian: 226 (0.7%)
Scottish: 220 (0.6%)
Greek: 199 (0.6%)
Brazilian: 194 (0.6%)
Scotch-Irish: 174 (0.5%)
Ukrainian: 150 (0.4%)
British: 134 (0.4%)
British West Indian: 121 (0.4%)
Danish: 80 (0.2%)
Czech: 72 (0.2%)
West Indian: 68 (0.2%)
Finnish: 66 (0.2%)
Austrian: 66 (0.2%)
Northern European: 65 (0.2%)
Welsh: 59 (0.2%)
Scandinavian: 58 (0.2%)
Slavic: 56 (0.2%)
Romanian: 50 (0.1%)
Lebanese: 49 (0.1%)
Eastern European: 48 (0.1%)
Slovak: 44 (0.1%)
Belgian: 43 (0.1%)
Trinidadian and Tobagonian: 38 (0.1%)
Arab: 33 (0.10%)
Lithuanian: 30 (0.09%)
Pennsylvania German: 28 (0.08%)
Hungarian: 23 (0.07%)
Croatian: 21 (0.06%)
Swiss: 17 (0.05%)
Egyptian: 14 (0.04%)
Nigerian: 11 (0.03%)
Bahamian: 10 (0.03%)
Portuguese: 9 (0.03%)
Albanian: 9 (0.03%)
Turkish: 8 (0.02%)
Barbadian: 8 (0.02%)
Serbian: 7 (0.02%)
Slovene: 7 (0.02%)
Czechoslovakian: 7 (0.02%)
Most common places of birth for foreign-born residents (%): Mexico Bradenton:
24.2% (1,949)Florida:
5.6% (257,152)
Canada Bradenton:
7.1% (569)Florida:
2.4% (109,132)
Haiti Bradenton:
6.0% (481)Florida:
7.5% (342,375)
Venezuela Bradenton:
5.6% (449)Florida:
5.7% (262,042)
Jamaica Bradenton:
5.1% (409)Florida:
5.0% (227,319)
Honduras Bradenton:
4.2% (337)Florida:
2.3% (107,160)
Guatemala Bradenton:
3.5% (281)Florida:
2.1% (97,632)
Cuba Bradenton:
3.1% (251)Florida:
22.0% (1,006,576)
Philippines Bradenton:
3.0% (242)Florida:
1.8% (84,403)
Brazil Bradenton:
2.9% (230)Florida:
2.7% (122,906)
El Salvador Bradenton:
2.7% (219)Florida:
1.1% (49,838)
Dominican Republic Bradenton:
2.5% (205)Florida:
3.0% (137,727)
Colombia Bradenton:
2.3% (183)Florida:
6.5% (298,669)
United Kingdom, excluding England and Scotland Bradenton:
2.1% (171)Florida:
0.7% (34,227)
Ecuador Bradenton:
2.0% (163)Florida:
1.2% (54,585)
Ukraine Bradenton:
1.7% (136)Florida:
0.5% (21,886)
Cameroon Bradenton:
1.6% (127)Florida:
0.0% (1,288)
Germany Bradenton:
1.6% (126)Florida:
1.2% (54,272)
Place of birth for U.S.-born residents:
This state: 20,733Other state: 28,150Northeast: 10,310Midwest: 10,283South: 5,426West: 2,150 83.4% of Bradenton residents lived in the same house 1 years ago.
Out of people who lived in different houses, 30.5% lived in this county.
Out of people who lived in different counties, 32.6% lived in Florida.
Bradenton:
83.4%State average:
86.3%
Education attainment for males 25 years and older:
No schooling: 252Nursery to 4th grade: 1215th and 6th grade: 1007th and 8th grade: 2709th grade: 14810th grade: 44711th grade: 15312th grade, no diploma: 474High school graduate (or equivalency): 6,255Less than 1 year of college: 1,389Some college more than 1 year, no degree: 2,533Associate degree: 1,757Bachelor's degree: 3,957Master's degree: 1,089Professional school degree: 509Doctorate degree: 440
Education attainment for females 25 years and older:
No schooling: 251Nursery to 4th grade: 1485th and 6th grade: 3167th and 8th grade: 1219th grade: 12010th grade: 39211th grade: 18612th grade, no diploma: 708High school graduate (or equivalency): 6,708Less than 1 year of college: 1,461Some college more than 1 year, no degree: 3,651Associate degree: 2,344Bachelor's degree: 4,493Master's degree: 1,735Professional school degree: 289Doctorate degree: 365
Housing units in structures:
One, detached: 12,972One, attached: 2,194Two: 8343 or 4: 1,6035 to 9: 3,54310 to 19: 2,25520 to 49: 2,88150 or more: 2,210Mobile homes: 1,344Boats, RVs, vans, etc.: 10Median worth of mobile homes: $77,852
Housing units lacking complete plumbing facilities in 2022: 0.3%Housing units lacking complete kitchen facilities in 2022: 1.2%House/condo owner moved in on average 9 years ago
Renter moved in on average 4 years ago
Private vs. public school enrollment:
Students in private schools in grades 1 to 8 (elementary and middle school): 633 Students in private schools in grades 9 to 12 (high school): 205 Students in private undergraduate colleges: 402