Bountiful, UT (Utah) Houses and Residents
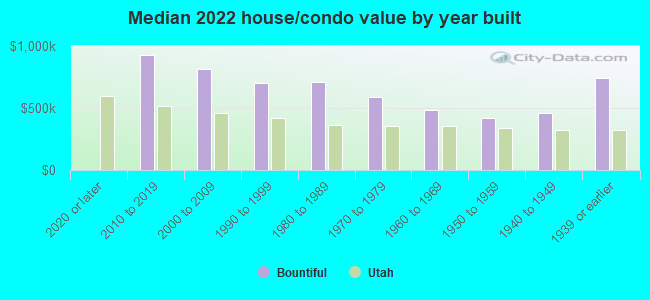
| Bountiful: | $555,694 |
| Utah: | $499,500 |
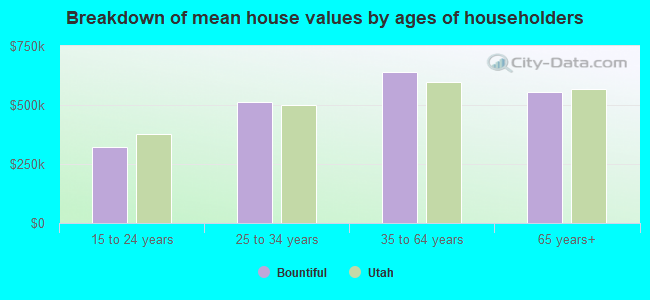
Mean price in 2022:
Detached houses: $651,078
Here: $651,078 State: $607,750 Townhouses or other attached units: $419,561
Here: $419,561 State: $444,505 In 2-unit structures: $407,679
Here: $407,679 State: $433,540 In 3-to-4-unit structures: $143,732
Here: $143,732 State: $362,850 In 5-or-more-unit structures: $270,917
Here: $270,917 State: $412,810
Total population: 43,385 (Urban population: 40,844, Rural population: 548 (all nonfarm))
Houses: 16,265 (15,207 occupied: 11,020 owner occupied, 4,073 renter occupied)
| % of renters here: | 27% |
| State: | 29% |
Housing density: 1,207 houses/condos per square mile
Median price asked for vacant for-sale houses and condos in 2022: $645,025.
Median contract rent in 2022: $1,460 (lower quartile is $1,109, upper quartile is $1,886)
Median rent asked for vacant for-rent units in 2022: $3,336
Median gross rent in Bountiful, UT in 2022: $1,579
Housing units in Bountiful with a mortgage: 7,002 (906 second mortgage, 34 home equity loan, 739 both second mortgage and home equity loan)
Houses without a mortgage: 156
Median household income for houses/condos with a mortgage: $123,340
Median household income for apartments without a mortgage: $103,705
Median monthly housing costs: $1,487
Compare current foreclosures in Bountiful, UT:
| Photo | Address | Area | Beds / Baths | Price | Details |
|---|---|---|---|---|---|

|
#1
E 1050 N
Bountiful, UT 84010
|
- sq. feet
|
- baths - beds |
show details | |

|
#2
Orchard Dr Ste 5
Bountiful, UT 84010
|
- sq. feet
|
- baths - beds |
show details | |

|
#3
N 200 W, Apt 3
Bountiful, UT 84010
|
- sq. feet
|
- baths - beds |
show details | |

|
#4
E 1050 N
Bountiful, UT 84010
|
889 sq. feet
|
- baths - beds |
show details | |

|
#5
W 500 S # 151
Bountiful, UT 84010
|
- sq. feet
|
- baths - beds |
show details | |

|
#6
S Highway 89, Apt 2
Bountiful, UT 84010
|
- sq. feet
|
- baths - beds |
show details | |

|
#7
S 500 W
Bountiful, UT 84010
|
- sq. feet
|
- baths - beds |
show details | |

|
#8
W 1050 N
Bountiful, UT 84010
|
1,645 sq. feet
|
- baths - beds |
show details | |

|
#9
S 200 W
Bountiful, UT 84010
|
- sq. feet
|
- baths - beds |
show details | |

|
#10
N Main St Apt 340
Bountiful, UT 84010
|
- sq. feet
|
- baths - beds |
show details |
| Photo | Address | Area | Beds / Baths | Price | Details |
|---|---|---|---|---|---|

|
#11
W 3300 S
Bountiful, UT 84010
|
1,160 sq. feet
|
- baths - beds |
show details | |

|
#12
S Highway 89, Apt 1
Bountiful, UT 84010
|
- sq. feet
|
- baths - beds |
show details | |

|
#13
Applewood Dr
Bountiful, UT 84010
|
- sq. feet
|
- baths - beds |
show details | |

|
#14
W 2350 S
Bountiful, UT 84010
|
1,444 sq. feet
|
- baths - beds |
show details | |

|
#15
S 850 W
Bountiful, UT 84010
|
- sq. feet
|
- baths - beds |
show details | |

|
#16
S Main St Apt 1
Bountiful, UT 84010
|
- sq. feet
|
- baths - beds |
show details | |

|
#17
W Center St Apt 76
Bountiful, UT 84010
|
- sq. feet
|
- baths - beds |
show details | |

|
#18
W 3200 S
Bountiful, UT 84010
|
4,480 sq. feet
|
- baths - beds |
show details | |

|
#19
S Main St # 9
Bountiful, UT 84010
|
876 sq. feet
|
- baths - beds |
show details | |

|
#20
Claremont Dr
Bountiful, UT 84010
|
- sq. feet
|
- baths - beds |
show details |
| Photo | Address | Area | Beds / Baths | Price | Details |
|---|---|---|---|---|---|

|
#21
E 100 N
Bountiful, UT 84010
|
- sq. feet
|
- baths - beds |
show details | |

|
#22
S 440 W
Bountiful, UT 84010
|
- sq. feet
|
- baths - beds |
show details | |

|
#23
N 300 E
Bountiful, UT 84010
|
824 sq. feet
|
- baths - beds |
show details | |

|
#24
S Main St # 212
Bountiful, UT 84010
|
- sq. feet
|
- baths - beds |
show details | |

|
#25
E 1250 N
Bountiful, UT 84010
|
1,100 sq. feet
|
- baths - beds |
show details | |

|
#26
Country Springs Cir
Bountiful, UT 84010
|
1,613 sq. feet
|
- baths - beds |
show details | |

|
#27
E Center St
Bountiful, UT 84010
|
1,166 sq. feet
|
- baths - beds |
show details | |

|
#28
Ridgeview Dr
Bountiful, UT 84010
|
1,166 sq. feet
|
- baths - beds |
show details | |

|
#29
E 400 S
Bountiful, UT 84010
|
- sq. feet
|
- baths - beds |
show details | |

|
#30
N Main St Apt 145
Bountiful, UT 84010
|
- sq. feet
|
- baths - beds |
show details |
| Photo | Address | Area | Beds / Baths | Price | Details |
|---|---|---|---|---|---|

|
#31
S 575 W Apt A
Bountiful, UT 84010
|
- sq. feet
|
- baths - beds |
show details | |

|
#32
E Center St Apt 4
Bountiful, UT 84010
|
- sq. feet
|
- baths - beds |
show details | |

|
#33
W 200 N
Bountiful, UT 84010
|
- sq. feet
|
- baths - beds |
show details | |

|
#34
W 1000 N
Bountiful, UT 84010
|
- sq. feet
|
- baths - beds |
show details | |

|
#35
E 1700 S
Bountiful, UT 84010
|
1,372 sq. feet
|
- baths - beds |
show details | |

|
#36
Orchard Dr Apt 7
Bountiful, UT 84010
|
- sq. feet
|
- baths - beds |
show details | |

|
#37
W 1000 N
Bountiful, UT 84010
|
- sq. feet
|
- baths - beds |
show details | |

|
#38
W 1500 S Apt 511
Bountiful, UT 84010
|
- sq. feet
|
- baths - beds |
show details | |

|
#39
Ridgewood Ln
Bountiful, UT 84010
|
1,427 sq. feet
|
- baths - beds |
show details | |

|
#40
E Center St
Bountiful, UT 84010
|
3,530 sq. feet
|
- baths - beds |
show details |
| Photo | Address | Area | Beds / Baths | Price | Details |
|---|---|---|---|---|---|

|
#41
S 625 W Apt D101
Bountiful, UT 84010
|
- sq. feet
|
- baths - beds |
show details | |

|
#42
N Main St
Bountiful, UT 84010
|
1,288 sq. feet
|
- baths - beds |
show details | |

|
#43
S 575 W
Bountiful, UT 84010
|
1,142 sq. feet
|
- baths - beds |
show details | |

|
#44
W 4050 S
Bountiful, UT 84010
|
- sq. feet
|
- baths - beds |
show details | |

|
#45
S 150 W
Bountiful, UT 84010
|
974 sq. feet
|
- baths - beds |
show details | |

|
#46
N Main St Apt 1
Bountiful, UT 84010
|
- sq. feet
|
- baths - beds |
show details | |

|
#47
Orchard Dr # B
Bountiful, UT 84010
|
- sq. feet
|
- baths - beds |
show details | |

|
#48
N 400 E
Bountiful, UT 84010
|
1,328 sq. feet
|
- baths - beds |
show details | |

|
#49
N Main St
Bountiful, UT 84010
|
1,130 sq. feet
|
- baths - beds |
show details | |

|
Check over 1 million property listings on Foreclosure.com!
|
browse all offers | |||

Latest news about housing in Bountiful, UT collected exclusively by city-data.com from local newspapers, TV, and radio stations

 | Best sites to look up real estate and homes for rent?? (2 replies) |
| Which towns have small(ish) houses? (9 replies) |
| Confused about apartments (13 replies) |
| Black in SLC (154 replies) |
| Looking for a new place to call home! (15 replies) |
| Housing in SLC Area (7 replies) |

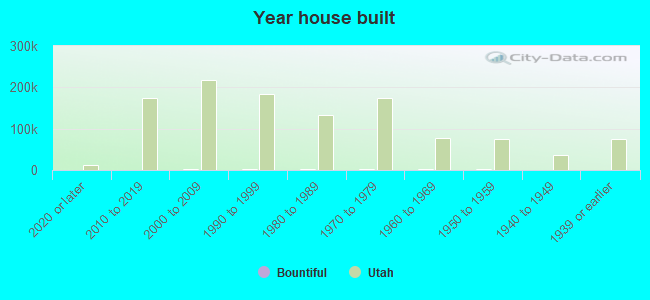
Median year apartment built: 1979
Household type by relationship:
Households: 46,217- Male householders: 7,502 (1,088 living alone), Female householders: 7,279 (1,987 living alone)
9,469 spouses (9,469 opposite-sex spouses), 511 unmarried partners, (479 opposite-sex unmarried partners), 16,585 children (15,563 natural, 495 adopted, 525 stepchildren), 1,081 grandchildren, 436 brothers or sisters, 507 parents, 6 foster children, 929 other relatives, 1,432 non-relatives
- In group quarters: 476
Size of family households: 4,526 2-persons, 2,058 3-persons, 1,915 4-persons, 1,607 5-persons, 679 6-persons, 732 7-or-more-persons.
Size of nonfamily households: 2,912 1-person, 412 2-persons, 75 3-persons, 164 4-persons.
10,773 married couples with children.
1,274 single-parent households (345 men, 929 women).
89.9% of residents of Bountiful speak English at home.
5.3% of residents speak Spanish at home (77% speak English very well, 11% speak English well, 10% speak English not well, 3% don't speak English at all).
2.2% of residents speak other Indo-European language at home (93% speak English very well, 6% speak English well, 1% speak English not well).
2.2% of residents speak Asian or Pacific Island language at home (80% speak English very well, 15% speak English well, 5% speak English not well).
0.4% of residents speak other language at home (100% speak English very well).
Foreign born population: 1,615 (3.5%)
(62.9% of them are naturalized citizens)
| Here: | 10.0 |
| State: | 7.6 |
| Here: | 4.7 |
| State: | 4.3 |
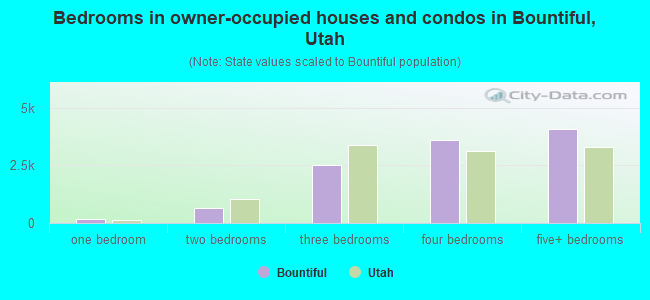
- Bedrooms in owner-occupied houses and condos in Bountiful, Utah
- 12no bedroom
- 1771 bedroom
- 6472 bedrooms
- 2,5133 bedrooms
- 3,5964 bedrooms
- 4,0745+ bedrooms
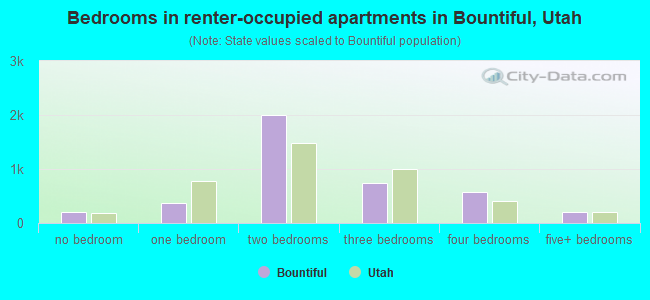
- Bedrooms in renter-occupied apartments in Bountiful, Utah
- 203no bedroom
- 3621 bedroom
- 1,9942 bedrooms
- 7383 bedrooms
- 5804 bedrooms
- 1985+ bedrooms
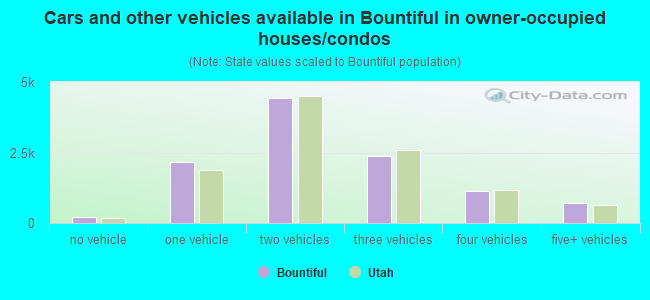
- Cars and other vehicles available in Bountiful in owner-occupied houses/condos
- 200no vehicle
- 2,1551 vehicle
- 4,4362 vehicles
- 2,3853 vehicles
- 1,1474 vehicles
- 6975+ vehicles
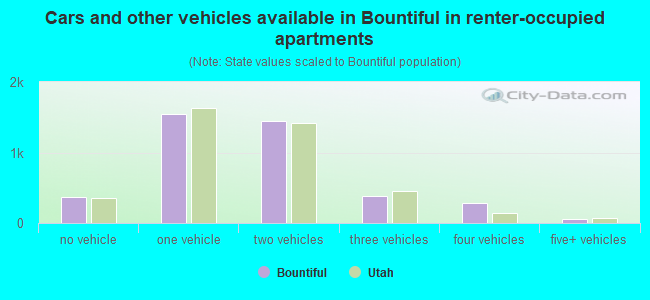
- Cars and other vehicles available in Bountiful in renter-occupied apartments
- 362no vehicle
- 1,5521 vehicle
- 1,4402 vehicles
- 3813 vehicles
- 2814 vehicles
- 585+ vehicles
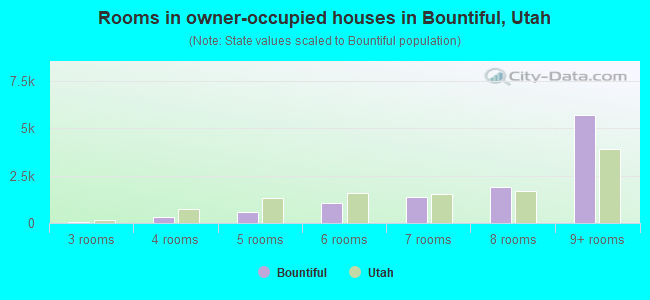
- Rooms in owner-occupied houses in Bountiful, Utah
- 121 room
- 02 rooms
- 573 rooms
- 3084 rooms
- 5995 rooms
- 1,0736 rooms
- 1,3647 rooms
- 1,8978 rooms
- 5,7099+ rooms
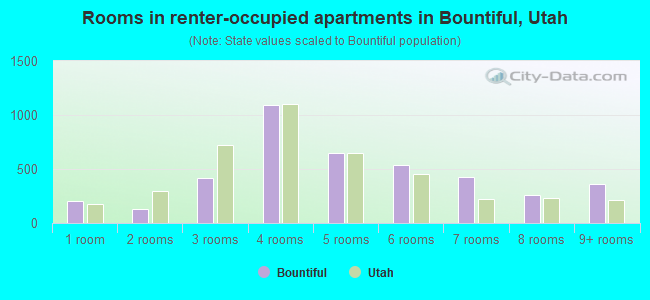
- Rooms in renter-occupied apartments in Bountiful, Utah
- 2031 room
- 1292 rooms
- 4143 rooms
- 1,0974 rooms
- 6515 rooms
- 5336 rooms
- 4277 rooms
- 2598 rooms
- 3619+ rooms
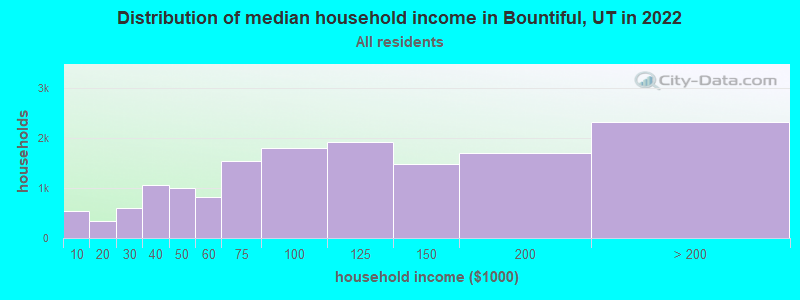
Bountiful, UT household income distribution

- 542Less than $10,000
- 338$10,000 to $19,999
- 600$20,000 to $29,999
- 1,057$30,000 to $39,999
- 1,003$40,000 to $49,999
- 826$50,000 to $59,999
- 1,534$60,000 to $74,999
- 1,807$75,000 to $99,999
- 1,920$100,000 to $124,999
- 1,487$125,000 to $149,999
- 1,706$150,000 to $199,999
- 2,321$200,000 or more
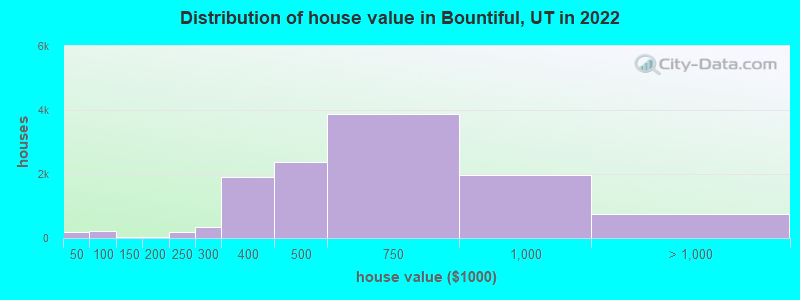
Home value of owner - occupied houses in 2022 in Bountiful, UT
-
- 41Less than $10,000
- 4$10,000 to $14,999
- 10$20,000 to $24,999
- 23$25,000 to $29,999
- 11$30,000 to $34,999
- 105$40,000 to $49,999
- 6$50,000 to $59,999
- 58$60,000 to $69,999
- 34$70,000 to $79,999
- 5$80,000 to $89,999
- 8$100,000 to $124,999
- 12$125,000 to $149,999
- 17$150,000 to $174,999
- 27$175,000 to $199,999
- 202$200,000 to $249,999
- 328$250,000 to $299,999
- 1,920$300,000 to $399,999
- 2,363$400,000 to $499,999
- 3,880$500,000 to $749,999
- 1,968$750,000 to $999,999
- 494$1,000,000 to $1,499,999
- 217$1,500,000 to $1,999,999
- 39$2,000,000 or more
Rent paid by renters in 2022 in Bountiful, UT
-
- 3Less than $100
- 19$200 to $249
- 4$250 to $299
- 48$300 to $349
- 13$350 to $399
- 5$450 to $499
- 86$500 to $549
- 33$550 to $599
- 24$650 to $699
- 108$700 to $749
- 89$750 to $799
- 202$800 to $899
- 271$900 to $999
- 690$1,000 to $1,249
- 778$1,250 to $1,499
- 1,114$1,500 to $1,999
- 405$2,000 to $2,499
- 198$2,500 to $2,999
- 14$3,000 to $3,499
- 86$3,500 or more
- 51No cash rent
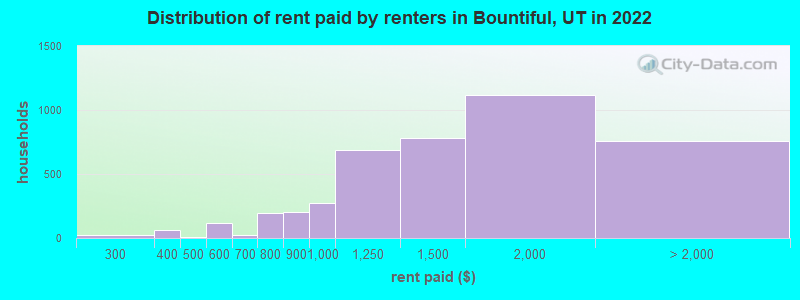
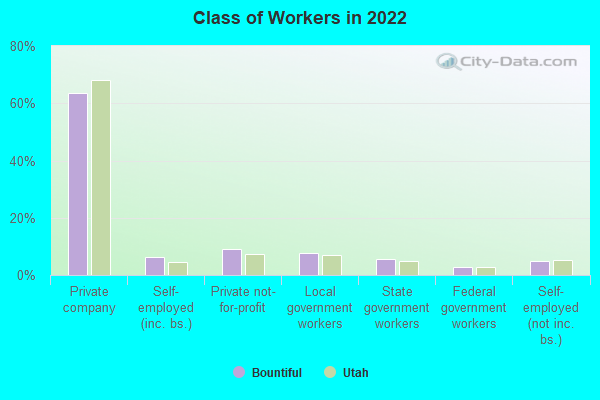
Percentage of workers working in this county: 55.3%
Number of people working at home: 5,539 (25.1% of all workers)
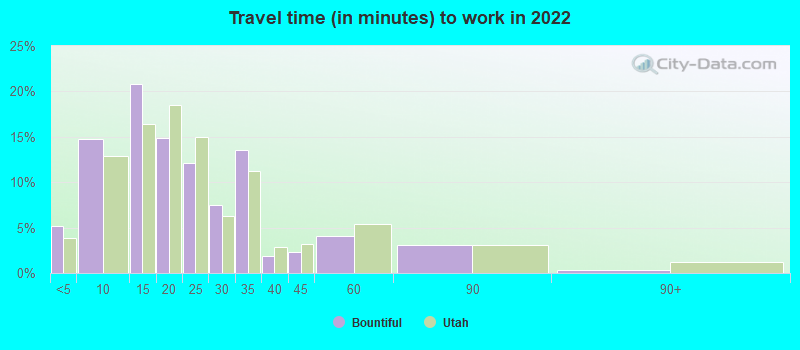
Travel time to work (commute)
- Less than 5 minutes: 716
- 5 to 9 minutes: 1,811
- 10 to 14 minutes: 2,588
- 15 to 19 minutes: 2,476
- 20 to 24 minutes: 3,058
- 25 to 29 minutes: 1,474
- 30 to 34 minutes: 2,484
- 35 to 39 minutes: 448
- 40 to 44 minutes: 576
- 45 to 59 minutes: 671
- 60 to 89 minutes: 196
- 90 or more minutes: 165
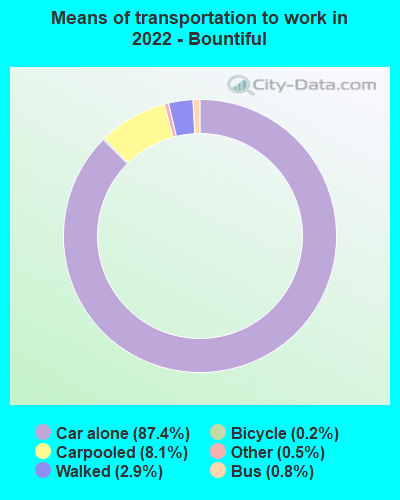
Means of transportation to work:
- Drove a car alone: 12,238 (62.2%)
- Carpooled: 1,441 (7.3%)
- Bus: 225 (1.1%)
- Subway or elevated rail: 5 (0.0%)
- Taxi: 91 (0.5%)
- Bicycle: 32 (0.2%)
- Walked: 413 (2.1%)
- Worked at home: 5,539 (28.1%)
- Unemployment by race in 2022
- Unemployment rate for White non-Hispanic residents
- 1.7%Males
- 2.4%Females
- Unemployment rate for Black residents
- 1.1%Females
- Unemployment rate for Asian residents
- 0.2%Females
- Unemployment rate for two or more race residents
- 6.6%Males
- 7.3%Females
- Unemployment rate for Hispanic or Latino residents
- 1.5%Males
- 6.2%Females
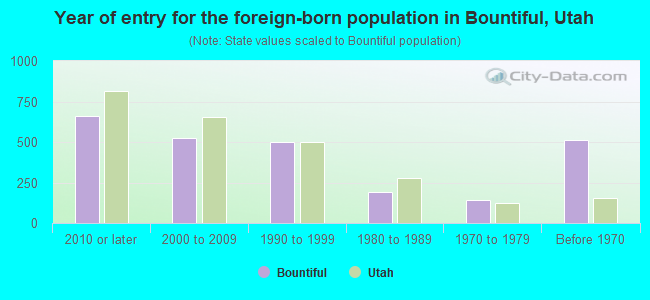
- Year of entry for the foreign-born population in Bountiful, Utah
- 6612010 or later
- 5242000 to 2009
- 4971990 to 1999
- 1901980 to 1989
- 1421970 to 1979
- 513Before 1970
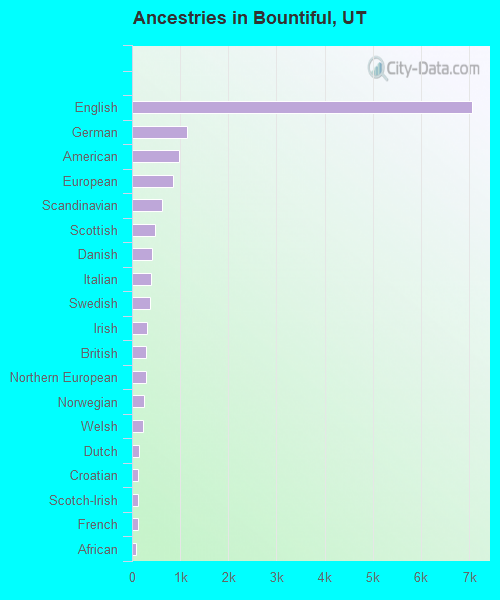
First ancestries reported:
- English: 7,060 (36.1%)
- German: 1,151 (5.9%)
- American: 971 (5.0%)
- European: 851 (4.4%)
- Scandinavian: 615 (3.1%)
- Scottish: 474 (2.4%)
- Danish: 419 (2.1%)
- Italian: 386 (2.0%)
- Swedish: 364 (1.9%)
- Irish: 320 (1.6%)
- British: 294 (1.5%)
- Northern European: 292 (1.5%)
- Norwegian: 241 (1.2%)
- Welsh: 229 (1.2%)
- Dutch: 148 (0.8%)
- Croatian: 132 (0.7%)
- Scotch-Irish: 126 (0.6%)
- French: 120 (0.6%)
- African: 93 (0.5%)
- Greek: 61 (0.3%)
- Serbian: 48 (0.2%)
- Ukrainian: 41 (0.2%)
- Polish: 37 (0.2%)
- Brazilian: 30 (0.2%)
- Canadian: 30 (0.2%)
- Swiss: 28 (0.1%)
- Lebanese: 18 (0.09%)
- Slavic: 18 (0.09%)
- Ethiopian: 17 (0.09%)
- Austrian: 16 (0.08%)
- Albanian: 15 (0.08%)
- Belgian: 15 (0.08%)
- Hungarian: 15 (0.08%)
- Australian: 6 (0.03%)
- Icelander: 5 (0.03%)
- Russian: 2 (0.01%)
Most common places of birth for foreign-born residents (%):
| Bountiful: | 14.8% (308) |
| Utah: | 36.1% (99,740) |
| Bountiful: | 7.6% (158) |
| Utah: | 2.9% (7,901) |
| Bountiful: | 6.4% (133) |
| Utah: | 2.8% (7,644) |
| Bountiful: | 5.7% (119) |
| Utah: | 1.6% (4,524) |
| Bountiful: | 5.5% (115) |
| Utah: | 3.0% (8,341) |
| Bountiful: | 5.3% (110) |
| Utah: | 1.5% (4,247) |
| Bountiful: | 4.9% (102) |
| Utah: | 0.4% (1,143) |
| Bountiful: | 4.8% (101) |
| Utah: | 2.6% (7,211) |
| Bountiful: | 4.1% (85) |
| Utah: | 2.6% (7,062) |
| Bountiful: | 3.5% (73) |
| Utah: | 0.2% (685) |
| Bountiful: | 3.5% (73) |
| Utah: | 2.1% (5,902) |
| Bountiful: | 3.4% (70) |
| Utah: | 3.0% (8,294) |
| Bountiful: | 3.0% (62) |
| Utah: | 0.8% (2,087) |
| Bountiful: | 2.9% (61) |
| Utah: | 0.6% (1,743) |
| Bountiful: | 2.0% (42) |
| Utah: | 0.3% (808) |
| Bountiful: | 1.9% (40) |
| Utah: | 2.9% (8,017) |
| Bountiful: | 1.8% (37) |
| Utah: | 0.5% (1,315) |
| Bountiful: | 1.6% (34) |
| Utah: | 0.7% (1,949) |
| Bountiful: | 1.6% (34) |
| Utah: | 0.2% (528) |
| Bountiful: | 1.6% (34) |
| Utah: | 3.2% (8,804) |
Place of birth for U.S.-born residents:
- This state: 31,611
- Other state: 12,695
- Northeast: 1,135
- Midwest: 2,189
- South: 1,252
- West: 8,261
86.9% of Bountiful residents lived in the same house 1 years ago.
Out of people who lived in different houses, 35.8% lived in this county.
Out of people who lived in different counties, 73.1% lived in Utah.
| Bountiful: | 86.9% |
| State average: | 85.7% |
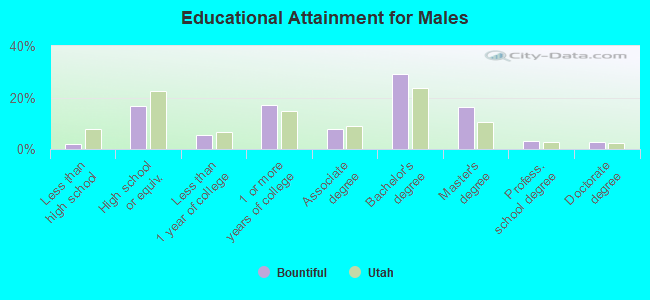
Education attainment for males 25 years and older:
- No schooling: 6
- Nursery to 4th grade: 0
- 5th and 6th grade: 0
- 7th and 8th grade: 24
- 9th grade: 44
- 10th grade: 21
- 11th grade: 44
- 12th grade, no diploma: 128
- High school graduate (or equivalency): 2,455
- Less than 1 year of college: 774
- Some college more than 1 year, no degree: 2,479
- Associate degree: 1,152
- Bachelor's degree: 4,234
- Master's degree: 2,357
- Professional school degree: 453
- Doctorate degree: 413
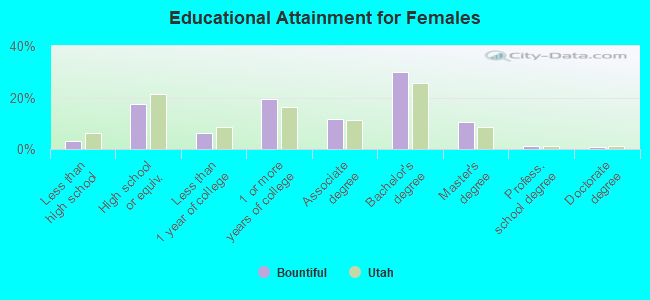
Education attainment for females 25 years and older:
- No schooling: 121
- Nursery to 4th grade: 0
- 5th and 6th grade: 0
- 7th and 8th grade: 4
- 9th grade: 15
- 10th grade: 20
- 11th grade: 32
- 12th grade, no diploma: 248
- High school graduate (or equivalency): 2,601
- Less than 1 year of college: 910
- Some college more than 1 year, no degree: 2,876
- Associate degree: 1,731
- Bachelor's degree: 4,458
- Master's degree: 1,534
- Professional school degree: 194
- Doctorate degree: 143


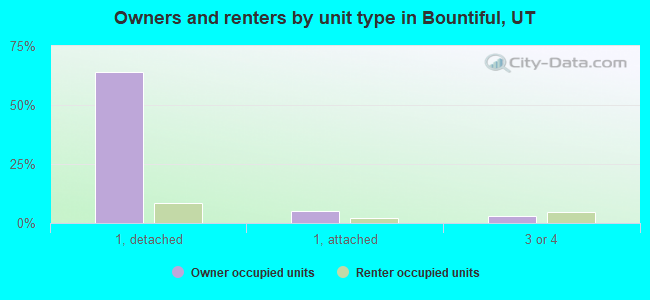
Housing units in structures:
- One, detached: 11,545
- One, attached: 981
- Two: 445
- 3 or 4: 1,261
- 5 to 9: 380
- 10 to 19: 665
- 20 to 49: 421
- 50 or more: 564
Housing units lacking complete kitchen facilities in 2022: 3.7%
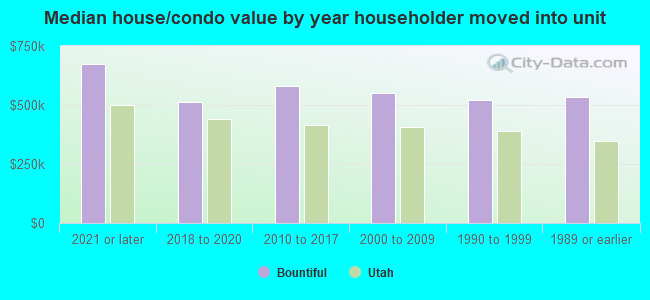
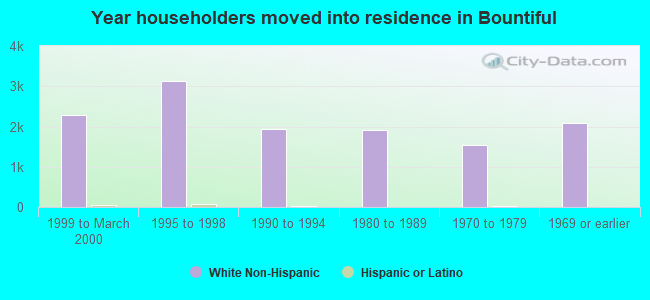
House/condo owner moved in on average 13 years ago
Renter moved in on average 3 years ago
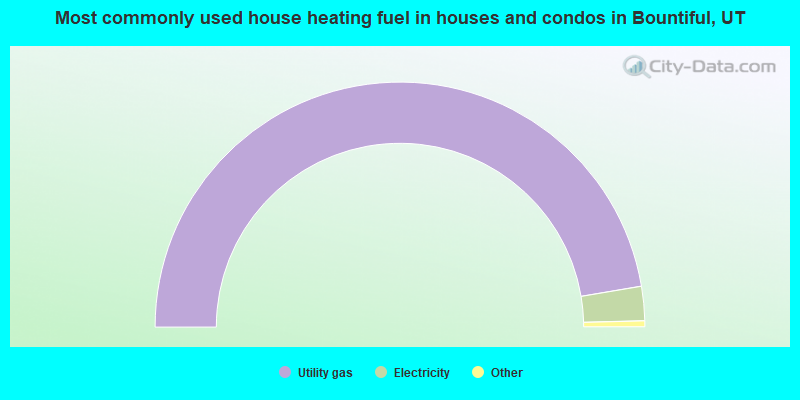
- 94.7%Utility gas
- 4.5%Electricity
- 0.6%Bottled, tank, or LP gas
- 0.2%Solar energy
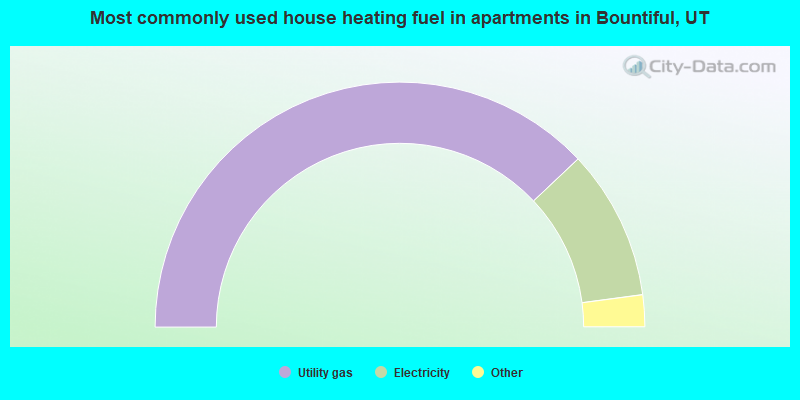
- 76.0%Utility gas
- 19.9%Electricity
- 3.4%Bottled, tank, or LP gas
- 0.4%Wood
- 0.3%No fuel used
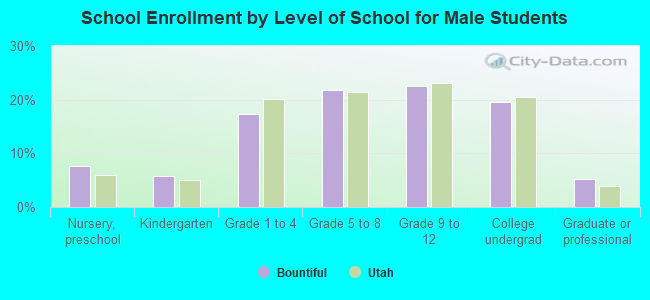
Private vs. public school enrollment:
| Here: | 10.4% |
| Utah: | 7.2% |
| Here: | 3.3% |
| Utah: | 5.3% |
| Here: | 25.0% |
| Utah: | 26.7% |