Housing density: 1,988 houses/condos per square mile
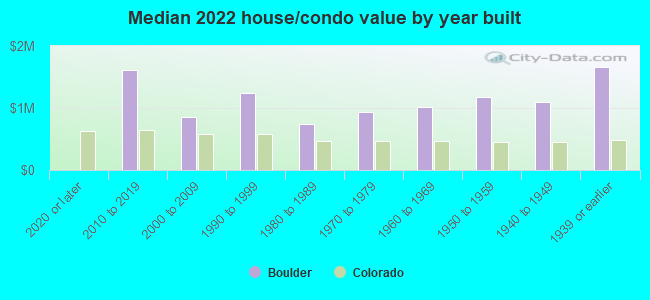
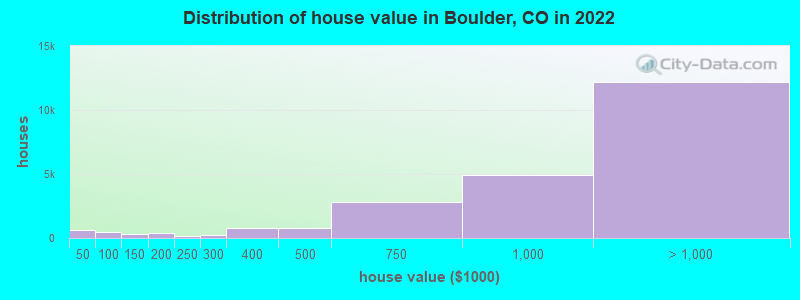
Median price asked for vacant for-sale houses and condos in 2022: $1,282,398.
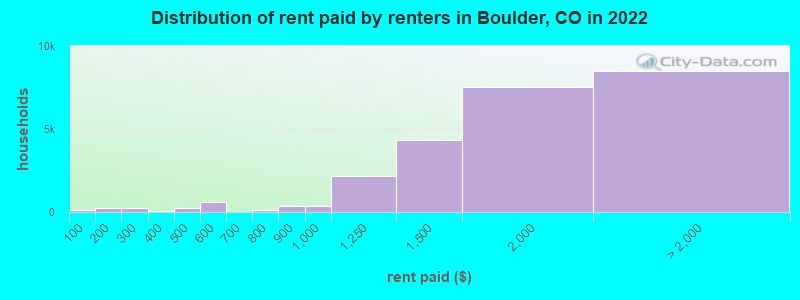
Median contract rent in 2022: $1,700 (lower quartile is $1,306, upper quartile is over $2,000)
Median rent asked for vacant for-rent units in 2022: $3,203
Median gross rent in Boulder, CO in 2022: $1,811
Housing units in Boulder with a mortgage: 12,881 (1,671 second mortgage, 134 home equity loan, 1,459 both second mortgage and home equity loan) Houses without a mortgage: 267
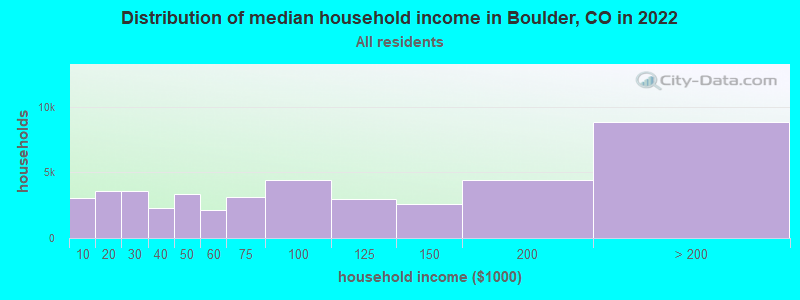
Median household income for houses/condos with a mortgage: $170,409
Median household income for apartments without a mortgage: $124,519
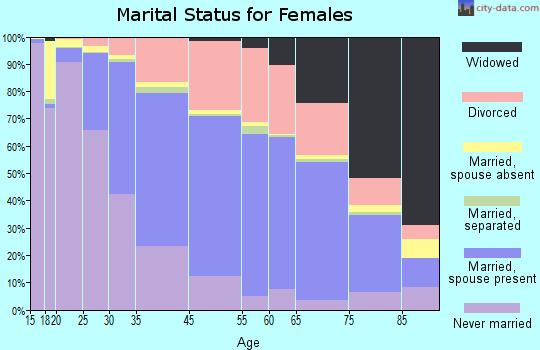
8,781 married couples with children.
2,578 single-parent households (680 men, 1,898 women).
85.2% of residents of Boulder speak English at home.
6.0% of residents speak Spanish at home (76% speak English very well, 17% speak English well, 6% speak English not well, 1% don't speak English at all).
4.5% of residents speak other Indo-European language at home (88% speak English very well, 8% speak English well, 3% speak English not well, 1% don't speak English at all).
3.7% of residents speak Asian or Pacific Island language at home (66% speak English very well, 25% speak English well, 9% speak English not well).
0.7% of residents speak other language at home (91% speak English very well, 9% speak English well).
Foreign born population: 9,565 (9.1%)
(52.3% of them are naturalized citizens)
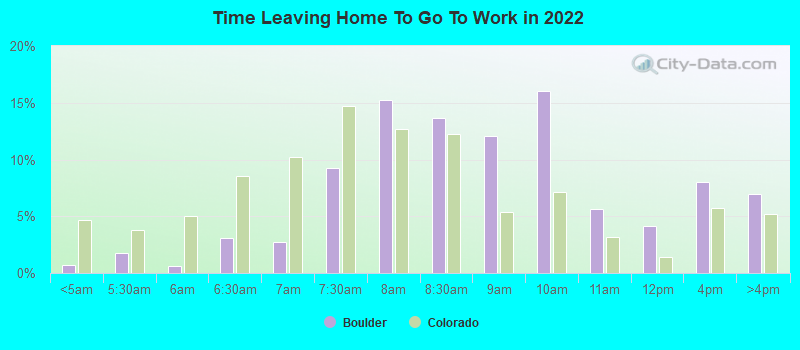
Percentage of workers working in this county: 91.2% Number of people working at home: 19,180 (32.5% of all workers)
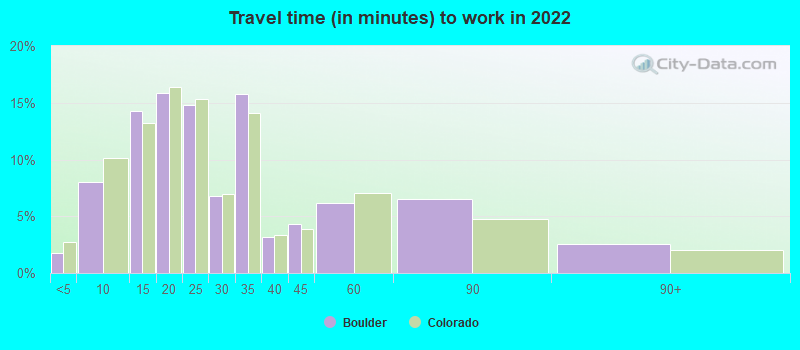
Travel time to work (commute)
Less than 5 minutes: 864
5 to 9 minutes: 6,346
10 to 14 minutes: 10,537
15 to 19 minutes: 7,604
20 to 24 minutes: 5,802
25 to 29 minutes: 1,711
30 to 34 minutes: 3,227
35 to 39 minutes: 823
40 to 44 minutes: 679
45 to 59 minutes: 1,089
60 to 89 minutes: 707
90 or more minutes: 387
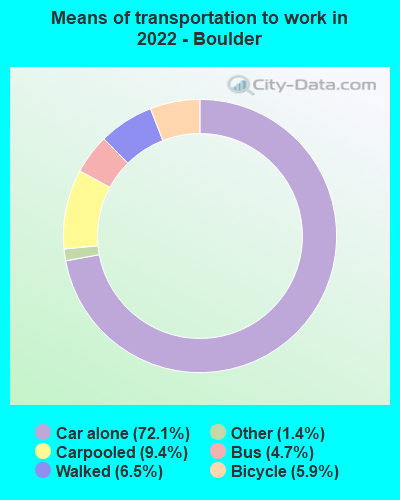
Means of transportation to work:
Drove a car alone: 58,131 (58.2%)
Carpooled: 7,608 (7.6%)
Bus: 3,780 (3.8%)
Taxi: 1,123 (1.1%)
Bicycle: 4,775 (4.8%)
Walked: 5,217 (5.2%)
Worked at home: 19,180 (19.2%)
Unemployment by race in 2022
Unemployment rate for White non-Hispanic residents
2.6%Males
1.1%Females
Unemployment rate for Black residents
1.1%Males
Unemployment rate for American Indian and Alaska Native residents
10.7%Males
Unemployment rate for Asian residents
9.8%Males
6.8%Females
Unemployment rate for two or more race residents
16.2%Males
4.3%Females
Unemployment rate for Hispanic or Latino residents
1.8%Males
6.0%Females
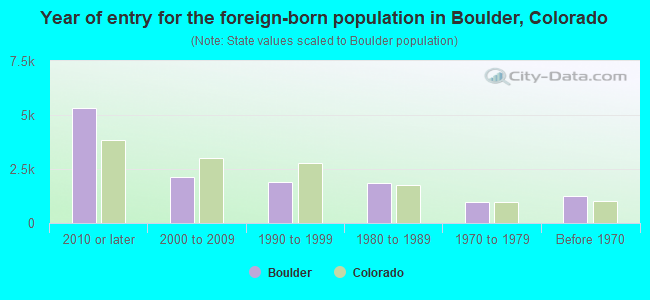
Year of entry for the foreign-born population in Boulder, Colorado
5,3322010 or later
2,1272000 to 2009
1,8811990 to 1999
1,8491980 to 1989
9741970 to 1979
1,240Before 1970
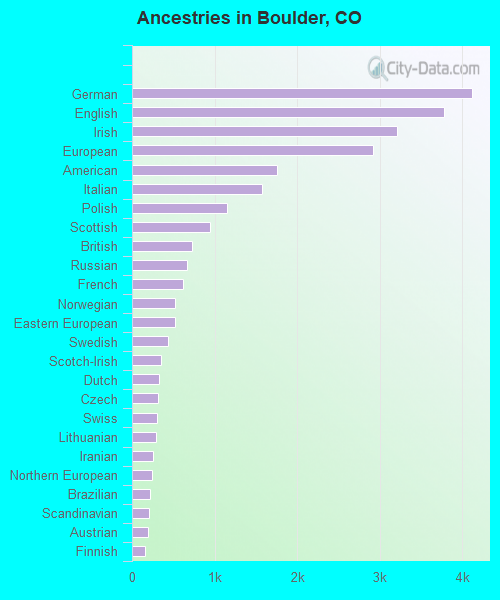
First ancestries reported:
German: 4,115 (10.0%)
English: 3,782 (9.1%)
Irish: 3,206 (7.8%)
European: 2,914 (7.0%)
American: 1,759 (4.3%)
Italian: 1,578 (3.8%)
Polish: 1,155 (2.8%)
Scottish: 946 (2.3%)
British: 721 (1.7%)
Russian: 670 (1.6%)
French: 617 (1.5%)
Norwegian: 526 (1.3%)
Eastern European: 521 (1.3%)
Swedish: 439 (1.1%)
Scotch-Irish: 348 (0.8%)
Dutch: 327 (0.8%)
Czech: 311 (0.8%)
Swiss: 297 (0.7%)
Lithuanian: 290 (0.7%)
Iranian: 258 (0.6%)
Northern European: 241 (0.6%)
Brazilian: 212 (0.5%)
Scandinavian: 205 (0.5%)
Austrian: 188 (0.5%)
Finnish: 160 (0.4%)
Canadian: 158 (0.4%)
Welsh: 146 (0.4%)
Hungarian: 145 (0.4%)
Greek: 143 (0.3%)
Danish: 142 (0.3%)
Arab: 129 (0.3%)
Ethiopian: 127 (0.3%)
French Canadian: 119 (0.3%)
Ukrainian: 115 (0.3%)
South African: 112 (0.3%)
Portuguese: 99 (0.2%)
African: 98 (0.2%)
Israeli: 97 (0.2%)
Belgian: 93 (0.2%)
Yugoslavian: 89 (0.2%)
Haitian: 66 (0.2%)
Cypriot: 62 (0.1%)
Croatian: 56 (0.1%)
Bulgarian: 48 (0.1%)
Slavic: 40 (0.10%)
Slovak: 38 (0.09%)
Australian: 38 (0.09%)
Turkish: 37 (0.09%)
Celtic: 34 (0.08%)
Afghan: 34 (0.08%)
Egyptian: 33 (0.08%)
Ghanaian: 32 (0.08%)
Romanian: 30 (0.07%)
Armenian: 26 (0.06%)
Jamaican: 26 (0.06%)
Slovene: 21 (0.05%)
Macedonian: 14 (0.03%)
Pennsylvania German: 12 (0.03%)
Iraqi: 11 (0.03%)
German Russian: 9 (0.02%)
Dutch West Indian: 9 (0.02%)
Cajun: 8 (0.02%)
Jordanian: 7 (0.02%)
Czechoslovakian: 6 (0.01%)
Albanian: 5 (0.01%)
Belizean: 5 (0.01%)
Somali: 3 (0.01%)
Most common places of birth for foreign-born residents (%):
China, excluding Hong Kong and Taiwan
Boulder:
13.6% (1,521)
Colorado:
3.3% (17,998)
Mexico
Boulder:
9.2% (1,025)
Colorado:
38.3% (209,491)
India
Boulder:
7.1% (792)
Colorado:
4.0% (21,689)
Germany
Boulder:
5.9% (661)
Colorado:
2.5% (13,706)
Canada
Boulder:
5.3% (596)
Colorado:
2.7% (15,026)
Korea
Boulder:
3.3% (368)
Colorado:
2.9% (15,981)
El Salvador
Boulder:
3.2% (356)
Colorado:
2.2% (12,150)
Brazil
Boulder:
3.1% (345)
Colorado:
1.0% (5,365)
England
Boulder:
2.8% (312)
Colorado:
1.2% (6,672)
United Kingdom, excluding England and Scotland
Boulder:
2.4% (271)
Colorado:
1.1% (5,799)
Iran
Boulder:
2.3% (261)
Colorado:
0.7% (3,568)
Nepal
Boulder:
2.0% (226)
Colorado:
1.0% (5,214)
Ireland
Boulder:
1.8% (203)
Colorado:
0.3% (1,441)
France
Boulder:
1.8% (203)
Colorado:
0.5% (2,620)
Colombia
Boulder:
1.8% (200)
Colorado:
1.1% (5,971)
Kuwait
Boulder:
1.5% (172)
Colorado:
0.1% (524)
Place of birth for U.S.-born residents:
This state: 29,842
Other state: 63,834
Northeast: 14,724
Midwest: 18,434
South: 15,648
West: 15,028
61.5% of Boulder residents lived in the same house 1 years ago. Out of people who lived in different houses, 36.3% lived in this county. Out of people who lived in different counties, 40.4% lived in Colorado.
Boulder:
61.5%
State average:
83.6%
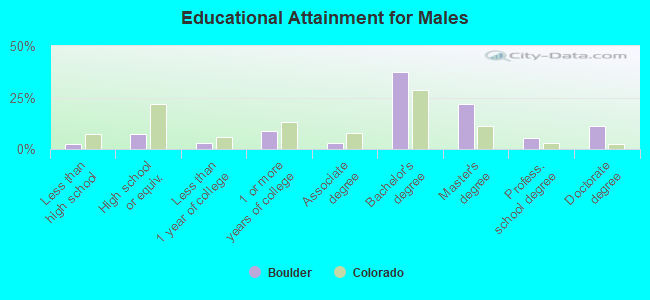
Education attainment for males 25 years and older:
No schooling: 0
Nursery to 4th grade: 0
5th and 6th grade: 58
7th and 8th grade: 0
9th grade: 35
10th grade: 0
11th grade: 58
12th grade, no diploma: 592
High school graduate (or equivalency): 2,183
Less than 1 year of college: 931
Some college more than 1 year, no degree: 2,729
Associate degree: 927
Bachelor's degree: 11,663
Master's degree: 6,729
Professional school degree: 1,632
Doctorate degree: 3,485
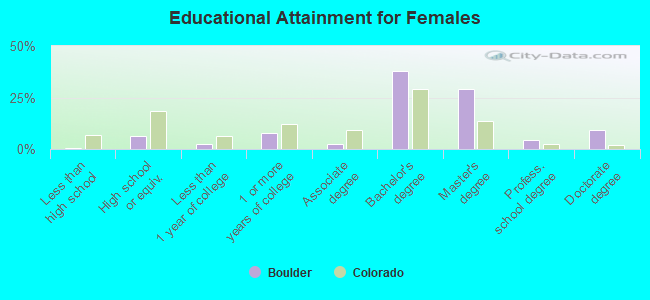
Education attainment for females 25 years and older:
No schooling: 0
Nursery to 4th grade: 0
5th and 6th grade: 131
7th and 8th grade: 0
9th grade: 0
10th grade: 0
11th grade: 3
12th grade, no diploma: 0
High school graduate (or equivalency): 1,755
Less than 1 year of college: 735
Some college more than 1 year, no degree: 2,291
Associate degree: 714
Bachelor's degree: 10,886
Master's degree: 8,369
Professional school degree: 1,231
Doctorate degree: 2,614
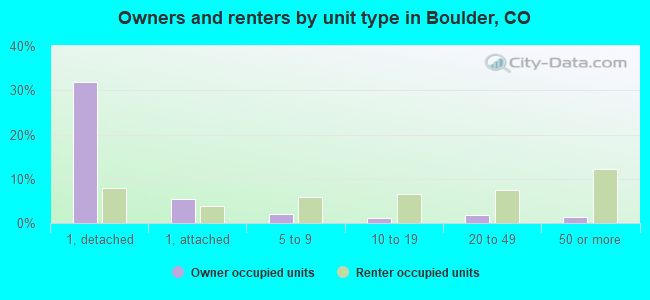
Housing units in structures:
One, detached: 18,279
One, attached: 4,413
Two: 1,556
3 or 4: 3,674
5 to 9: 3,722
10 to 19: 3,792
20 to 49: 4,573
50 or more: 7,358
Mobile homes: 1,079
Median worth of mobile homes: $49,605
Housing units lacking complete plumbing facilities in 2022: 0.3%
Housing units lacking complete kitchen facilities in 2022: 0.1%
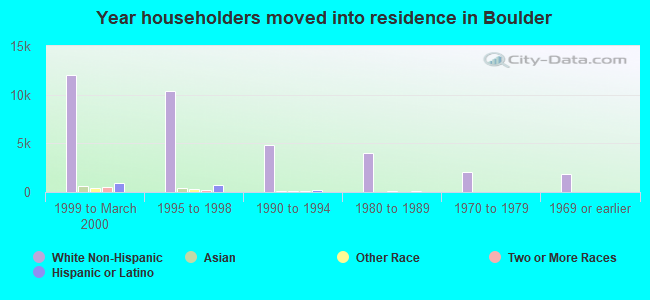
House/condo owner moved in on average 10 years ago