Boston, NY (New York) Houses and Residents
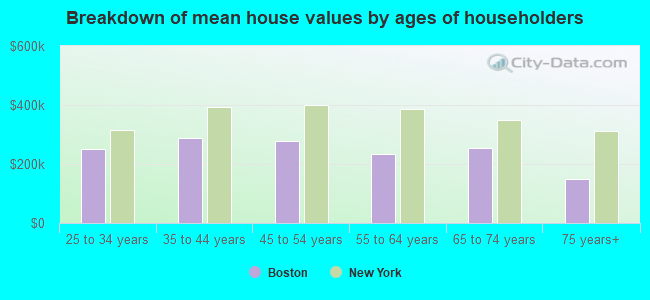
| Boston: | $279,570 |
| New York: | $400,400 |
Total population: 8,023 (Urban population: 3,964, Rural population: 3,933 (111 farm, 3,822 nonfarm))
Houses: 3,122 (2,997 occupied: 2,494 owner occupied, 503 renter occupied)
| % of renters here: | 17% |
| State: | 46% |
Housing density: 87 houses/condos per square mile
Median price asked for vacant for-sale houses and condos in 2022 in this county: $275,138.
Median contract rent in 2022: $948 (lower quartile is $727, upper quartile is $1,196)
Median rent asked for vacant for-rent units in 2022: $1,113
Median gross rent in Boston, NY in 2022: $1,080
Housing units in Boston with a mortgage: 1,369 (66 second mortgage, 282 home equity loan, 7 both second mortgage and home equity loan)
Houses without a mortgage: 587
Compare current foreclosures near Boston, NY:
| Photo | Address | Area | Beds / Baths | Price | Details |
|---|---|---|---|---|---|

|
#1
Trevett Rd
Boston, NY 14025
|
1,726 sq. feet
|
1 baths 2 beds |
show details | |

|
#2
Boston Colden Rd
Boston, NY 14025
|
940 sq. feet
|
1 baths 2 beds |
show details | |

|
#3
Boston State Rd
Boston, NY 14025
|
- sq. feet
|
- baths - beds |
show details | |

|
#4
Cattaraugus St
Springville, NY 14141
|
1,424 sq. feet
|
1 baths 3 beds |
$249,900
|
show details |

|
#5
Heussy Ave
Buffalo, NY 14220
|
1,455 sq. feet
|
2 baths 3 beds |
$245,000
|
show details |

|
#6
Eastwood Ave
Hamburg, NY 14075
|
2,206 sq. feet
|
2 baths 3 beds |
show details | |

|
#7
Aurora Ave
Buffalo, NY 14224
|
1,040 sq. feet
|
1 baths 2 beds |
show details | |

|
#8
Vermont St
North Collins, NY 14111
|
1,864 sq. feet
|
1 baths 5 beds |
show details | |

|
#9
Abbott Rd
Orchard Park, NY 14127
|
1,232 sq. feet
|
1 baths 3 beds |
show details | |

|
#10
Old Glenwood Rd
West Falls, NY 14170
|
2,096 sq. feet
|
1 baths 3 beds |
show details |
| Photo | Address | Area | Beds / Baths | Price | Details |
|---|---|---|---|---|---|

|
#11
Hayes Hollow Rd
Colden, NY 14033
|
3,752 sq. feet
|
3 baths 7 beds |
show details | |

|
#12
Main St
Collins, NY 14034
|
2,560 sq. feet
|
1 baths 4 beds |
show details | |

|
#13
George Dr
Buffalo, NY 14224
|
1,706 sq. feet
|
1 baths 3 beds |
show details | |

|
#14
Newman St
Buffalo, NY 14218
|
1,344 sq. feet
|
1 baths 3 beds |
show details | |

|
#15
Jamison Rd
Elma, NY 14059
|
2,457 sq. feet
|
2 baths 4 beds |
show details | |

|
#16
Pleasant View Avenue Aka 9 Pleasant Avenue
Angola, NY 14006
|
2,078 sq. feet
|
2 baths 4 beds |
show details | |

|
#17
Eureka Pl
Buffalo, NY 14204
|
1,308 sq. feet
|
1 baths 3 beds |
show details | |

|
#18
Quebec St
Angola, NY 14006
|
1,262 sq. feet
|
1 baths 3 beds |
show details | |

|
#19
Dempster St
Buffalo, NY 14206
|
1,070 sq. feet
|
1 baths 3 beds |
show details | |

|
#20
Koester St
Buffalo, NY 14220
|
964 sq. feet
|
1 baths 2 beds |
show details |
| Photo | Address | Area | Beds / Baths | Price | Details |
|---|---|---|---|---|---|

|
#21
Meadow Dr
Buffalo, NY 14224
|
1,903 sq. feet
|
1 baths 3 beds |
show details | |

|
#22
Kingston Pl
Buffalo, NY 14210
|
1,861 sq. feet
|
1 baths 4 beds |
show details | |

|
#23
Frank Ave
Buffalo, NY 14210
|
1,008 sq. feet
|
1 baths 3 beds |
show details | |

|
#24
French Lea Rd
Buffalo, NY 14224
|
2,296 sq. feet
|
3 baths 6 beds |
show details | |

|
#25
S Park Ave
Buffalo, NY 14220
|
2,232 sq. feet
|
2 baths 6 beds |
show details | |

|
#26
Koester St
Buffalo, NY 14220
|
1,180 sq. feet
|
1 baths 3 beds |
show details | |

|
#27
French Lea Rd
Buffalo, NY 14224
|
2,296 sq. feet
|
3 baths 6 beds |
show details | |

|
#28
Melrose St
Buffalo, NY 14220
|
2,001 sq. feet
|
2 baths 4 beds |
show details | |

|
#29
N Legion Dr
Buffalo, NY 14210
|
1,453 sq. feet
|
1 baths 3 beds |
show details | |

|
#30
Knoerl Ave
Buffalo, NY 14210
|
1,780 sq. feet
|
2 baths 5 beds |
show details |
| Photo | Address | Area | Beds / Baths | Price | Details |
|---|---|---|---|---|---|

|
#31
Old Mill Cir
Elma, NY 14059
|
1,427 sq. feet
|
2 baths 2 beds |
show details | |

|
#32
George Dr
Buffalo, NY 14224
|
1,706 sq. feet
|
1 baths 3 beds |
show details | |

|
#33
Knox Ave
Buffalo, NY 14224
|
1,194 sq. feet
|
1 baths 4 beds |
show details | |

|
#34
Rutland St
Buffalo, NY 14220
|
1,651 sq. feet
|
1 baths 3 beds |
show details | |

|
#35
S Protection Rd
Holland, NY 14080
|
1,152 sq. feet
|
1 baths 2 beds |
show details | |

|
#36
Gregory Dr
Buffalo, NY 14224
|
1,437 sq. feet
|
1 baths 3 beds |
show details | |

|
#37
Mineral Springs Rd
Buffalo, NY 14224
|
1,476 sq. feet
|
2 baths 3 beds |
show details | |

|
#38
Preble Ct
Buffalo, NY 14224
|
1,686 sq. feet
|
1 baths 4 beds |
show details | |

|
#39
Leamington Pl # 2
Buffalo, NY 14210
|
2,288 sq. feet
|
2 baths 4 beds |
show details | |

|
#40
Nancy Pl
Buffalo, NY 14227
|
1,064 sq. feet
|
1 baths 3 beds |
show details |
| Photo | Address | Area | Beds / Baths | Price | Details |
|---|---|---|---|---|---|

|
#41
Danielle Dr
Buffalo, NY 14227
|
960 sq. feet
|
1 baths 3 beds |
show details | |

|
#42
Hardpan Rd
Angola, NY 14006
|
1,853 sq. feet
|
1 baths 3 beds |
show details | |

|
#43
Eldred Ave
Buffalo, NY 14224
|
1,200 sq. feet
|
1 baths 3 beds |
show details | |

|
#44
Emporium Ave
Buffalo, NY 14224
|
1,619 sq. feet
|
1 baths 3 beds |
show details | |

|
#45
Aurora Ave
Buffalo, NY 14224
|
1,153 sq. feet
|
1 baths 3 beds |
show details | |

|
#46
Collins Ave
Buffalo, NY 14224
|
1,544 sq. feet
|
1 baths 3 beds |
show details | |

|
#47
Kimmel Ave
Buffalo, NY 14220
|
1,008 sq. feet
|
1 baths 2 beds |
show details | |

|
#48
Emporium Ave
Buffalo, NY 14224
|
1,683 sq. feet
|
1 baths 4 beds |
show details | |

|
#49
Frank Ct
Buffalo, NY 14224
|
1,136 sq. feet
|
1 baths 3 beds |
show details | |

|
Check over 1 million property listings on Foreclosure.com!
|
browse all offers | |||
Latest news about housing in Boston, NY collected exclusively by city-data.com from local newspapers, TV, and radio stations


Household type by relationship:
Households: 890,653- In family households: 703,665 (150,587 male householders, 79,422 female householders)
161,163 spouses, 259,954 children (245,472 natural, 6,125 adopted, 8,357 stepchildren), 13,651 grandchildren, 7,172 brothers or sisters, 6,060 parents, foster children, 6,352 other relatives, 16,208 non-relatives
- In nonfamily households: 186,988 (69,279 male householders (54,381 living alone)), 83,876 female householders (72,187 living alone)), 33,833 nonrelatives
- In group quarters: 28,387 (12,145 institutionalized population)
148,778 married couples with children.
64,240 single-parent households (9,850 men, 54,390 women).
96.0% of residents of Boston speak English at home.
1.2% of residents speak Spanish at home (40% speak English very well, 27% speak English well, 33% speak English not well).
2.2% of residents speak other Indo-European language at home (86% speak English very well, 9% speak English well, 4% speak English not well).
0.1% of residents speak Asian or Pacific Island language at home (100% speak English very well).
0.5% of residents speak other language at home (100% speak English very well).
Foreign born population: 390 (4.9%)
(55.6% of them are naturalized citizens)
| Here: | 6.6 |
| State: | 6.3 |
| Here: | 4.5 |
| State: | 3.8 |
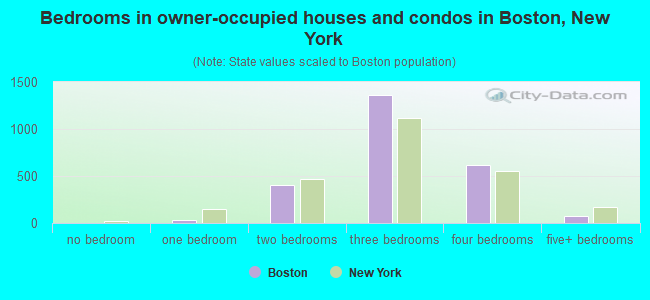
- Bedrooms in owner-occupied houses and condos in Boston, New York
- 0no bedroom
- 311 bedroom
- 4052 bedrooms
- 1,3603 bedrooms
- 6204 bedrooms
- 785+ bedrooms
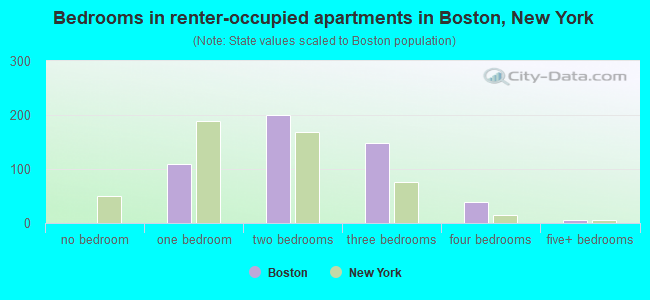
- Bedrooms in renter-occupied apartments in Boston, New York
- 0no bedroom
- 1091 bedroom
- 2002 bedrooms
- 1493 bedrooms
- 394 bedrooms
- 65+ bedrooms
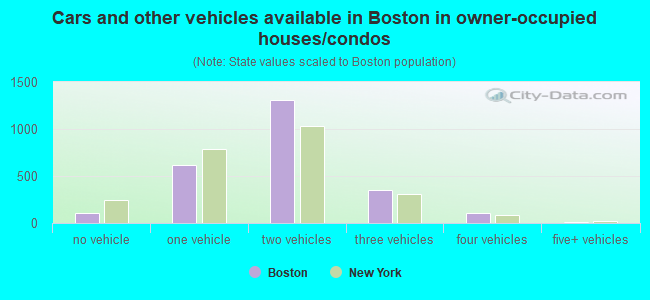
- Cars and other vehicles available in Boston in owner-occupied houses/condos
- 107no vehicle
- 6151 vehicle
- 1,3092 vehicles
- 3543 vehicles
- 1034 vehicles
- 65+ vehicles
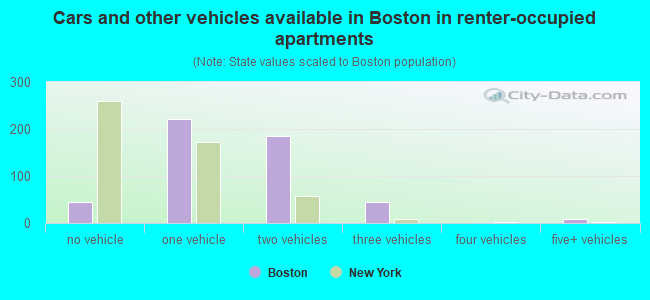
- Cars and other vehicles available in Boston in renter-occupied apartments
- 44no vehicle
- 2211 vehicle
- 1852 vehicles
- 453 vehicles
- 04 vehicles
- 85+ vehicles
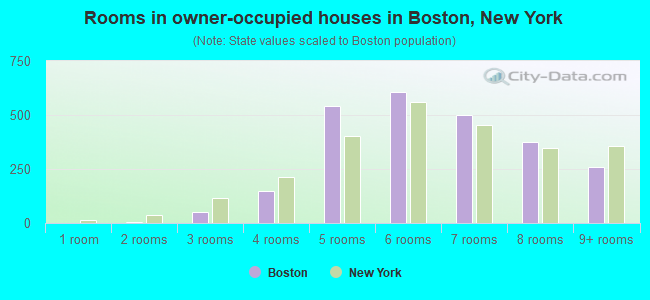
- Rooms in owner-occupied houses in Boston, New York
- 01 room
- 62 rooms
- 533 rooms
- 1474 rooms
- 5435 rooms
- 6066 rooms
- 5027 rooms
- 3778 rooms
- 2609+ rooms
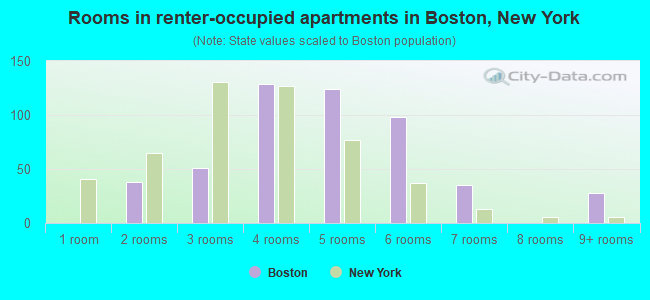
- Rooms in renter-occupied apartments in Boston, New York
- 01 room
- 382 rooms
- 513 rooms
- 1294 rooms
- 1245 rooms
- 986 rooms
- 357 rooms
- 08 rooms
- 289+ rooms
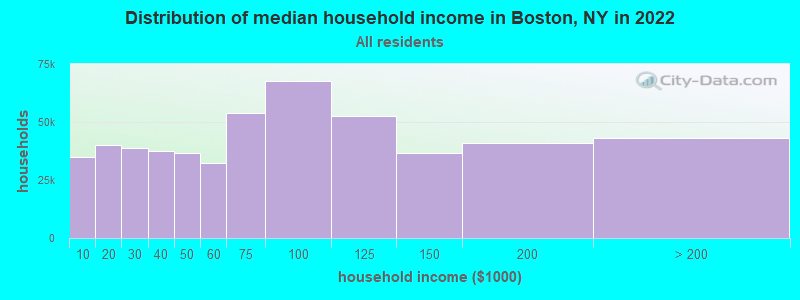
Boston, NY household income distribution

- 34,982Less than $10,000
- 40,146$10,000 to $19,999
- 38,996$20,000 to $29,999
- 37,498$30,000 to $39,999
- 36,569$40,000 to $49,999
- 32,364$50,000 to $59,999
- 54,063$60,000 to $74,999
- 67,726$75,000 to $99,999
- 52,782$100,000 to $124,999
- 36,476$125,000 to $149,999
- 40,767$150,000 to $199,999
- 43,041$200,000 or more
Percentage of workers working in this county: 94.4%
Number of people working at home: 569 (13.5% of all workers)
Travel time to work (commute)
- Less than 5 minutes: 170
- 5 to 9 minutes: 187
- 10 to 14 minutes: 318
- 15 to 19 minutes: 506
- 20 to 24 minutes: 707
- 25 to 29 minutes: 452
- 30 to 34 minutes: 538
- 35 to 39 minutes: 253
- 40 to 44 minutes: 252
- 45 to 59 minutes: 239
- 60 to 89 minutes: 63
- 90 or more minutes: 70
Means of transportation to work:
- Drove a car alone: 3,411 (88.8%)
- Carpooled: 305 (7.9%)
- Walked: 39 (1.0%)
- Worked at home: 86 (2.2%)
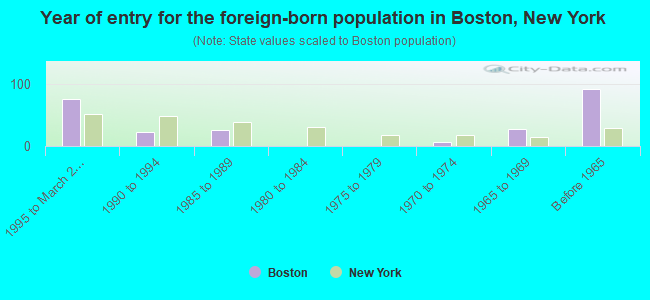
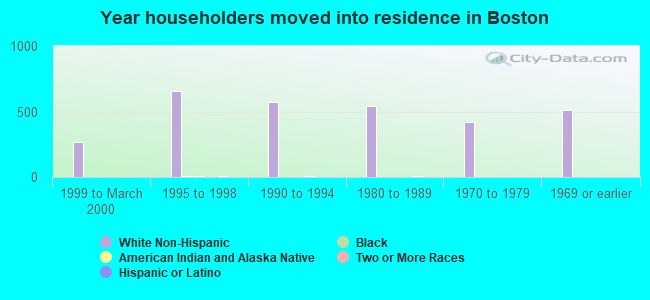
- Year of entry for the foreign-born population in Boston, New York
- 761995 to March 2000
- 221990 to 1994
- 261985 to 1989
- 01980 to 1984
- 01975 to 1979
- 71970 to 1974
- 271965 to 1969
- 91Before 1965
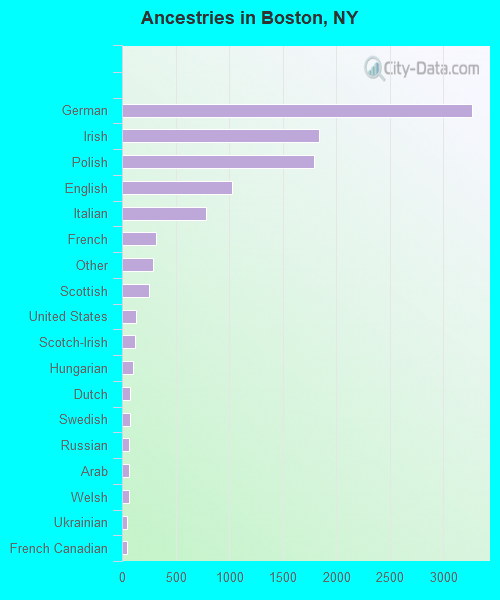
First ancestries reported:
- German: 3,262 (31.2%)
- Irish: 1,841 (17.6%)
- Polish: 1,789 (17.1%)
- English: 1,028 (9.8%)
- Italian: 785 (7.5%)
- French: 316 (3.0%)
- Other: 292 (2.8%)
- Scottish: 250 (2.4%)
- United States: 133 (1.3%)
- Scotch-Irish: 120 (1.1%)
- Hungarian: 104 (1.0%)
- Dutch: 74 (0.7%)
- Swedish: 71 (0.7%)
- Russian: 65 (0.6%)
- Arab: 64 (0.6%)
- Welsh: 64 (0.6%)
- Ukrainian: 48 (0.5%)
- French Canadian: 44 (0.4%)
- Lithuanian: 22 (0.2%)
- Portuguese: 22 (0.2%)
- Slovak: 19 (0.2%)
- Czech: 18 (0.2%)
- Swiss: 18 (0.2%)
- Norwegian: 9 (0.09%)
Most common places of birth for foreign-born residents (%):
| Boston: | 20.9% (52) |
| New York: | 1.4% (54,876) |
| Boston: | 11.6% (29) |
| New York: | 1.8% (69,327) |
| Boston: | 10.4% (26) |
| New York: | 0.5% (20,012) |
| Boston: | 6.8% (17) |
| New York: | 0.3% (13,508) |
| Boston: | 6.0% (15) |
| New York: | 1.6% (62,237) |
| Boston: | 6.0% (15) |
| New York: | 2.4% (94,595) |
| Boston: | 5.2% (13) |
| New York: | 0.6% (25,059) |
| Boston: | 4.8% (12) |
| New York: | 0.1% (4,273) |
| Boston: | 4.0% (10) |
| New York: | 0.7% (25,688) |
| Boston: | 3.6% (9) |
| New York: | 2.5% (97,933) |
| Boston: | 3.2% (8) |
| New York: | 0.5% (20,310) |
| Boston: | 2.8% (7) |
| New York: | 1.4% (53,825) |
| Boston: | 2.8% (7) |
| New York: | 0.1% (3,269) |
| Boston: | 2.4% (6) |
| New York: | 3.8% (147,729) |
| Boston: | 2.4% (6) |
| New York: | 0.4% (17,401) |
| Boston: | 2.4% (6) |
| New York: | 2.4% (93,187) |
| Boston: | 2.4% (6) |
| New York: | 2.9% (111,727) |
| Boston: | 2.0% (5) |
| New York: | 0.3% (11,299) |
Place of birth for U.S.-born residents:
- This state: 6,998
- Other state: 602
- Northeast: 300
- Midwest: 117
- South: 133
- West: 52
73% of Boston residents lived in the same house 5 years ago.
Out of people who lived in different houses, 91% lived in this county.
Out of people who lived in different counties, 55% lived in New York.
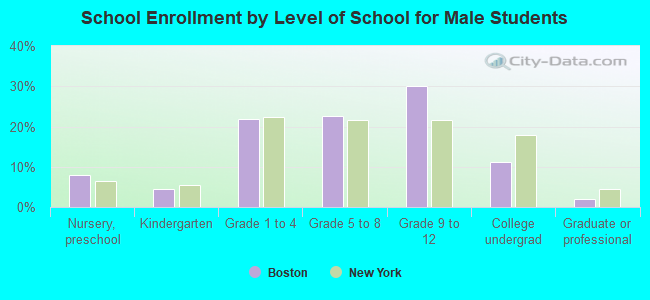
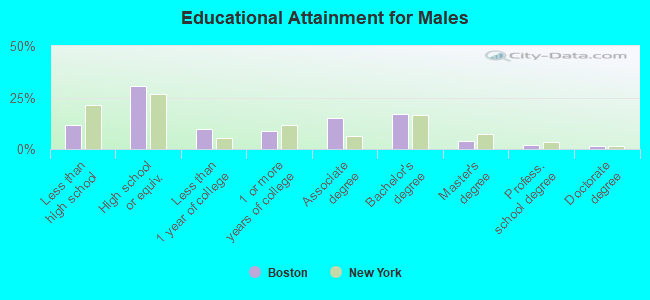
Education attainment for males 25 years and older:
- No schooling: 13
- Nursery to 4th grade: 0
- 5th and 6th grade: 21
- 7th and 8th grade: 85
- 9th grade: 33
- 10th grade: 66
- 11th grade: 46
- 12th grade, no diploma: 39
- High school graduate (or equivalency): 792
- Less than 1 year of college: 252
- Some college more than 1 year, no degree: 225
- Associate degree: 387
- Bachelor's degree: 437
- Master's degree: 98
- Professional school degree: 48
- Doctorate degree: 36
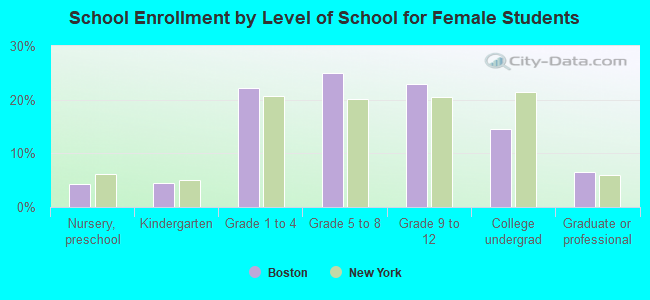
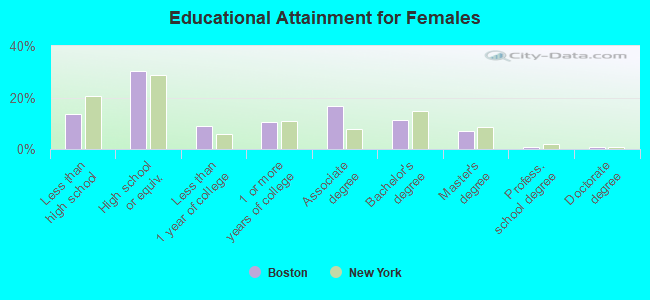
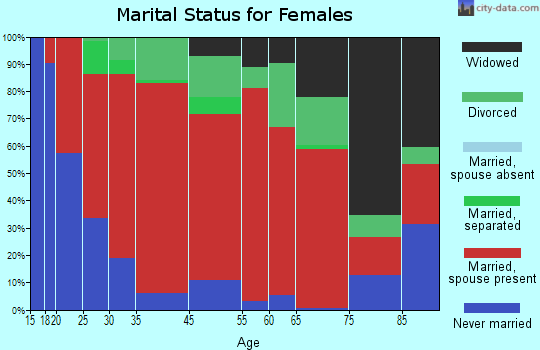
Education attainment for females 25 years and older:
- No schooling: 9
- Nursery to 4th grade: 0
- 5th and 6th grade: 0
- 7th and 8th grade: 75
- 9th grade: 49
- 10th grade: 67
- 11th grade: 76
- 12th grade, no diploma: 97
- High school graduate (or equivalency): 845
- Less than 1 year of college: 253
- Some college more than 1 year, no degree: 288
- Associate degree: 462
- Bachelor's degree: 311
- Master's degree: 196
- Professional school degree: 23
- Doctorate degree: 26
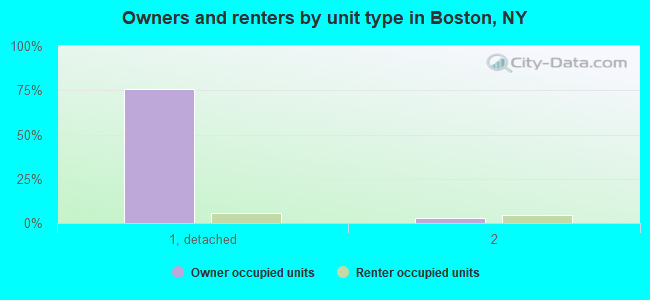
Housing units in structures:
- One, detached: 2,512
- One, attached: 38
- Two: 225
- 3 or 4: 60
- 5 to 9: 99
- 20 to 49: 19
- 50 or more: 9
- Mobile homes: 160
Median worth of mobile homes: $21,940
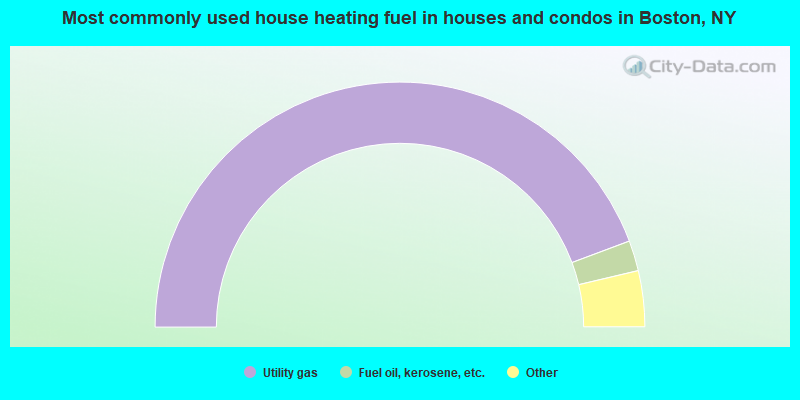
- 88.6%Utility gas
- 4.0%Fuel oil, kerosene, etc.
- 3.1%Bottled, tank, or LP gas
- 3.1%Wood
- 1.0%Electricity
- 0.2%Other fuel
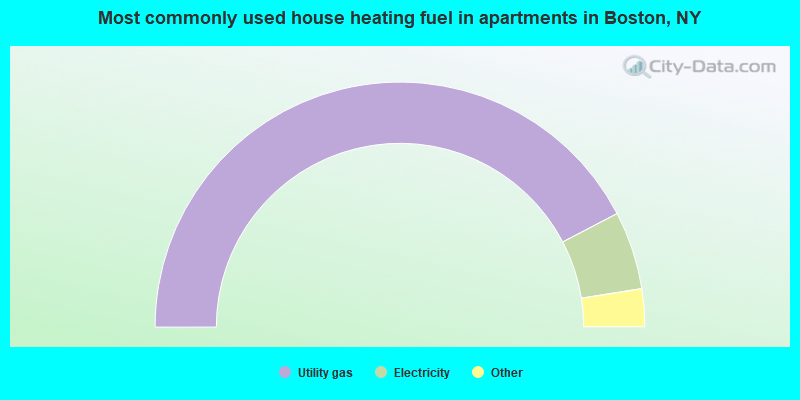
- 84.7%Utility gas
- 10.3%Electricity
- 2.8%Other fuel
- 2.2%Wood
Private vs. public school enrollment:
| Here: | 10.2% |
| New York: | 14.0% |
| Here: | 7.9% |
| New York: | 13.2% |
| Here: | 38.1% |
| New York: | 38.2% |